


Abstract
Wild-type transthyretin amyloid cardiomyopathy (ATTR-CM) is an increasingly recognized condition. It remains challenging to estimate the extent of disease and the prognosis for most patients. Myocardial work is a sensitive echocardiographic approach that improves the characterization of myocardial damage. We investigate the parameters of myocardial deformation and work in ATTR-CM patients and their changes over time.
We analysed clinical, electrocardiographic, biological, and echocardiographic characteristics in 113 patients [median age 82 (77–85), 90.4% male] diagnosed with wild-type ATTR-CM based on international consensus at a single centre. We compared the data at baseline and 18-month follow-up. Thirty-four patients died and 12 were hospitalized for heart failure at a median follow-up of 935 days (interquartile range 691–1159 days). Left ventricular end-diastolic diameter, left atrial strain during reservoir phase (LASRES), left ventricular longitudinal strain, global work index (GWI), global constructive work significantly decreased from baseline to 18 months, while left ventricular wall thickness increased. Left ventricular ejection fraction, right ventricular free wall strain (FWS), global wasted work (GWW), and global work efficiency did not alter significantly. Strain parameters were identified as prognostic on baseline evaluation using a multivariate analysis: GWI, GWW, FWS, and LASRES. They were significantly associated with the risk of death and hospitalization for heart failure.
Multi-chamber strain assessment may improve the surveillance of patients with ATTR-CM, and myocardial work parameters may improve clinical risk stratification in this population.
See the editorial comment for this article ‘Echocardiographic tools for prognostic stratification in transthyretin cardiac amyloidosis: a new arrow in the quiver’, by R. Citro et al., https://doi.org/10.1093/ehjci/jeae028.
Introduction
Transthyretin amyloid cardiomyopathy (ATTR-CM) is an increasingly recognized clinical condition characterized by the aggregation and deposition of misfolded transthyretin in the myocardium, leading to progressive heart failure with median survival without treatment of 3–5 years.1–3
Despite increasing awareness of amyloid build-up in the heart muscle,2,4–6 cardiac amyloidosis is often diagnosed late.2,7 A better characterization of the extent of myocardial involvement is needed to improve disease prognostication.8 Left ventricular ejection fraction (LVEF) often remains preserved until very late in the disease process.9,10 The analysis of myocardial deformation has been highlighted, particularly the analysis of global longitudinal strain (GLS) and apical sparring pattern.11 Finally, myocardial work is estimated by non-invasive pressure–strain loops. It is a novel method for a less afterload-dependent left ventricular (LV) systolic function assessment, which may have an advantage over GLS.12,13 Myocardial work has been shown to have an additive value beyond GLS in differentiating AL vs. ATTR amyloidosis.14 Myocardial work is associated with peak oxygen consumption and might provide relevant prognostic information.13 Also, left atrial strain (LAS) and right ventricular (RV) strain may also play an important role in the echocardiographic assessment of TTR-amyloidosis patients.15 We postulate that the strain-based parameters may be superior in assessing the degree of cardiac involvement in amyloidosis over traditional measures of cardiac function.
In the present study, we sought to investigate the evolution in time and prognostic value of strain and myocardial work indices in ATTR-CM.
Methods
Patient selection
We followed 113 consecutive patients diagnosed with a wild-type ATTR-CM based on international consensus6,12 at our institution (Department of Cardiology, CHU-Rennes, France) between June 2016 and October 2020. The study was conducted according to the Declaration of Helsinki and approved by the internal review board. All patients provided informed consent for the conduction of the study. The inclusion criteria were age ≥ 18 years and a diagnosis of ATTR-CM.
The exclusion criteria were patients with concomitant heart which may impact the myocardial work or GLS, e.g. significant valvular heart disease or ischaemic cardiomyopathy, excessive frailty, or unable be followed. No patient with any significant aortic valve stenosis was included. No intervention on the aortic valve has been performed during the follow-up, no patient with left bundle branch block either.
The diagnosis was established according to consensus recommendations using biology, echocardiography, and bone scintigraphy.12 Genetic analysis was performed in all patients. Six patients had hereditary ATTR-CM (hATTR-CM), of whom three had the Val122Ile variant, one had Tyr77, and two had Ala39Asp.
Every patient had a 99m-technetium-3,3-diphosphono-1,2-propanodicarboxylic acid scintigraphy at the time of diagnosis.
Treatment with tafamidis was started at the clinician’s discretion, after November 2018. Prior to this date, the drug was not available in France. It does not impact on the result, as each patient is his own witness.
Clinical and biological characteristics
Clinical data were taken from baseline consultation notes. It included physical examination, medical history, pharmacological treatment, and electrocardiogram.
Biological data were collected within 1 month from the time of diagnosis: NT-proBNP, high-sensitivity troponin T, estimated glomerular filtration rate (eGFR), haemoglobin, and transaminases. It allows the clinical prognostic evaluation according to Gillmore et al.1
The date of introduction of tafamidis was noted.4,6
Echocardiographic data
Comprehensive echocardiography was performed at baseline in all patients.
All acquisitions and measurements were carried out according to the guidelines and recommendations.16,17
Exams were stored on a dedicated PACs (ViewPoint, GE Healthcare, Horten, Norway) and were available on EchoPAC (version 202, GE Healthcare) at the Central Core Lab in Rennes (CIC, ISO-9001 accredited lab, Inserm1414, Rennes, France).
LV function. Left atrial and ventricular volume-like LV diastolic functions were assessed as recommended.16,17
LV GLS was evaluated.18 The relative regional strain ratio was calculated as previously suggested.11
Myocardial work
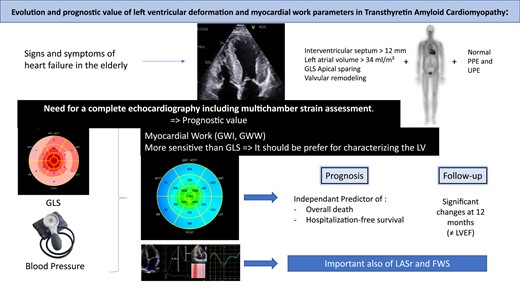
Myocardial work was estimated based on the combination of a non-invasively estimated LV pressure curve and LV strain data obtained by speckle-tracking echocardiography as described by Russell et al. (Figure 1).12,13 Systolic blood pressure was recorded at baseline with a brachial cuff manometer, at the end of the echocardiogram recording. The peak arterial pressure was assumed to be equal to peak systolic LV pressure and to be uniform throughout the ventricle. Strain and pressure data were synchronized using the R-wave on electrocardiogram (ECG) as a common time reference.
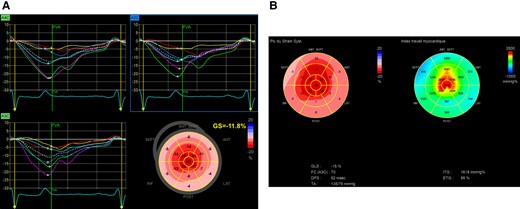
(A) An LV GLS calculation. (B) Example of ‘bull’s eye’, obtained as described above. On the left, the representation of the GLS. On the right, the myocardial work.
The timing of opening and closure of the aortic and mitral valves was identified by echocardiography and recorded in the dedicated software. It resulted in a non-invasive LV pressure curve, validated in prior publications.13,19
A bull’s eye with segmental and global work index (GWI) was obtained from opening to the closure of the mitral valve. Other indices for each segment were also obtained: the constructive work as the addition of lengthening in isovolumetric relaxation and shortening during systole, the wasted work as the addition of shortening in isovolumetric relaxation lengthening during systole, and work efficiency as the division of constructive work by the sum of constructive work and wasted work. The average of every segmental constructive work, wasted work, and work efficiency correspond, respectively, to LV global constructive work, global wasted work (GWW), and global work efficiency (GWE).13,19
Left atrial function
LAS was assessed from both biplane apical two-chamber and apical four-chamber views. If two or more segments could not be tracked, the values were rejected. Three components of LAS were distinguished, as described in guidelines:18,20 Left atrial reservoir, conduit, and contractile strains (LASRES, LASCD, and LASCT, respectively), corresponding to the three phases of the left atrial cycle.
Example of LAS is shown in Figure 2.
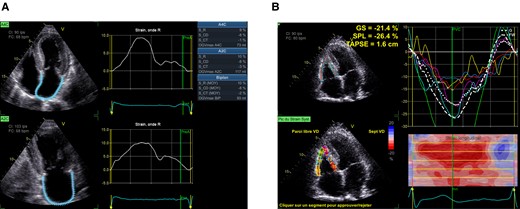
(A) LAS measurement (R, reservoir phase; CD, conduit phase; CT, contraction phase). (B) RV strain measurement.
RV function
RV function was measured by tricuspid annular plane systolic excursion (TAPSE) and RV free wall strain (FWS). RV-focused four-chamber apical view was used to measure RV-FWS. The myocardium of the RV free wall between the free wall base and the insertion point of the RV into the LV is divided into three segments of equal length at ventricular end-diastole which are named basal, mid, and apical. To assess regional longitudinal strain, each free wall segment was averaged with its septal counterpart (Figure 2).
All analyses were performed by two experienced physicians blinded to the clinical data.20
Six- and 18-month follow-up echocardiography
LV volume and function, left atrial volume, and deformation parameters of LV, LA, and RV were analysed according to the same principles if echocardiography was available at 6 ± 1 and 18 ± 2 months. The difference between baseline data and the last available measurement within 18 months was then expressed as annualized absolute difference mean.
Intra- and inter-observer variabilities
Intra- and inter-observer variabilities of GLS and myocardial work measurements were reported previously.21
Outcome
The endpoint was all-cause death within follow-up. The secondary endpoint was cardiovascular death or hospitalization for heart failure.
Statistical analysis
Continuous variables were expressed as mean ± standard deviation, or median (first–third quartile); categorical variables were expressed as frequencies (percentages).
We explored 10 echo variables: (i) PLAX (parasternal long-axis view) measurements (4 parameters), (ii) systolic LV function (3 parameters), (iii) diastolic LV function (6 parameters), (iv) RV size and function (9 parameters), (v) valvular function (5 parameters), (vi) atrial size and function (2 parameters), (vii) LV GLS (5 parameters), (viii) LV myocardial work index (4 parameters), (ix) RV GLS (5 parameters), and (x) LAS (3 parameters). We checked for strong correlation (Spearman or Pearson coefficient > 0.70) within each dimension and then across dimensions. For the remaining echo parameters, non-highly correlated and with <15% of missing values, we generated five datasets with imputed missing values (Monte-Carlo Markov chain).
Cox proportional hazard models were fitted. Among the 46 echo parameters across 10 dimensions, only those statistically associated with the outcome were tested in multivariate Cox models. A time-dependent variable was used to model the effect of patients transferring from no treatment to tafamidis. The treatment variable took the value 1 or 0 at the time (measured from the date of the first prescription), depending on whether the patient was prescribed tafamidis at that time. Plots of the cumulative martingale residuals against the values of each quantitative covariates were created, and the P-value of a Kolmogorov-type supremum test based on a sample of 1000 simulated residual patterns was computed.22 Both the graphical and numerical results indicated whether a transform was deemed necessary for a given covariate in the model or not. It was also used to check the proportional hazards assumption of the model. When both the graphical and numerical results indicated that a transform was deemed necessary, we used a spline expansion replacing the original variable on a cubic B-spline basis with three equally spaced knots positioned between the minimum and maximum values of that variable.
Echo parameter evolution between the last available measurement within 18 months and baseline measurement expressed as annualized absolute mean difference was described and a signed-rank tested for a mean equal to zero. Based on the multivariable model, Kaplan–Meier curves were built for the two independent prognostic markers (GWW and RV free wall longitudinal strain).
Results
Population description
Clinical, laboratory, electrocardiographic, and echocardiographic characteristics at the time of diagnosis, according to the vital status at 2 years, are summarized in Table 1.
Clinical and biological characteristics and univariate association with overall death (main endpoint), cardiovascular death, and heart failure hospitalization free survival (secondary endpoints)
| Variable | n | Statistics | Unitsa | Main endpoint | Cardiovascular death | HF hospitalization free survival | |||||||||
|---|---|---|---|---|---|---|---|---|---|---|---|---|---|---|---|
| HR | LCL | UCL | P-value | HR | LCL | UCL | P-value | HR | LCL | UCL | P-value | ||||
| Age, years | 113 | 82 (77–85) | 10 | 1.98 | 1.08 | 3.65 | 0.0279 | 1.63 | 1.04 | 2.56 | 0.0346 | 1.36 | 0.94 | 1.97 | 0.1044 |
| Gender, female | 113 | 10.6 (12) | 0.41 | 0.10 | 1.72 | 0.2248 | 0.58 | 0.15 | 2.26 | 0.4362 | 0.34 | 0.09 | 1.27 | 0.1101 | |
| Body mass index (kg/m2) | 113 | 25.2 ± 3.40 | 3 | 0.84 | 0.62 | 1.15 | 0.2766 | 0.83 | 0.59 | 1.17 | 0.2929 | 0.94 | 0.71 | 1.24 | 0.6501 |
| Arterial hypertension | 112 | 70.5 (79) | 1.67 | 0.74 | 3.77 | 0.2177 | 1.06 | 0.44 | 2.51 | 0.9023 | 1.04 | 0.53 | 2.05 | 0.9007 | |
| CAD at baseline | 112 | 25.9 (29) | 2.11 | 1.06 | 4.19 | 0.0327 | 2.14 | 1.02 | 4.47 | 0.0434 | 1.92 | 1.03 | 3.58 | 0.0401 | |
| Revascularization | 112 | 13.4 (15) | 1.51 | 0.66 | 3.49 | 0.3300 | 1.31 | 0.58 | 2.99 | 0.5155 | 1.70 | 0.83 | 3.49 | 0.1467 | |
| NYHA | 112 | 49.1 (57) | II | 1.31 | 0.37 | 4.65 | 0.0082 | 1.51 | 0.33 | 6.92 | 0.0142 | 1.70 | 0.48 | 6.11 | 0.0026 |
| 33.9 (38) | III and IV | 3.60 | 1.06 | 12.2 | 4.21 | 1.00 | 17.7 | 4.42 | 1.29 | 15.1 | |||||
| Atrial fibrillation at baseline | 112 | 62.5 (70) | 2.05 | 0.92 | 4.54 | 0.0781 | 2.08 | 0.83 | 5.20 | 0.1192 | 2.56 | 1.24 | 5.26 | 0.0109 | |
| Atrial fibrillation on ECG at baseline | 110 | 47.8 (54) | 1.56 | 0.77 | 3.14 | 0.2137 | 1.52 | 0.69 | 3.36 | 0.2970 | 2.18 | 1.14 | 4.15 | 0.0181 | |
| Atrial fibrillation (echo) | 113 | 49.6 (56) | 3.01 | 1.40 | 6.47 | 0.0048 | 3.56 | 1.41 | 9.01 | 0.0074 | 2.84 | 1.45 | 5.56 | 0.0024 | |
| Permanent pacemaker at baseline | 112 | 25.0 (28) | 2.15 | 1.08 | 4.27 | 0.0285 | 2.15 | 1.00 | 4.64 | 0.0501 | 2.33 | 1.25 | 4.33 | 0.0075 | |
| Stimulated | 110 | 16.4 (18) | 2.40 | 1.16 | 4.96 | 0.0183 | 2.56 | 1.16 | 5.65 | 0.0203 | 2.99 | 1.62 | 5.51 | 0.0005 | |
| ACE inhibitor/ARB | 112 | 44.6 (50) | 0.81 | 0.41 | 1.60 | 0.5351 | 0.70 | 0.33 | 1.50 | 0.3607 | 0.58 | 0.31 | 1.10 | 0.0946 | |
| Mineralocorticoid receptor antagonist | 112 | 33.9 (38) | 1.22 | 0.61 | 2.42 | 0.5764 | 1.53 | 0.71 | 3.29 | 0.2805 | 2.51 | 1.36 | 4.62 | 0.0032 | |
| Tafamidis | 113 | 0.38 | 0.19 | 0.76 | 0.0063 | 0.26 | 0.12 | 0.60 | 0.0014 | 0.47 | 0.25 | 0.88 | 0.0188 | ||
| NT-proBNP (pg/mL) | 108 | 2637 (1300–4140) | 1000 | 1.10 | 1.06 | 1.15 | <0.0001 | 1.07 | 1.02 | 1.12 | 0.0038 | 1.05 | 1.01 | 1.09 | 0.0106 |
| High-sensitivity troponin (ng/L) | 80 | 59.0 ± 50.1 | 50 | 1.16 | 0.84 | 1.60 | 0.3806 | 1.08 | 0.77 | 1.52 | 0.6385 | 1.08 | 0.82 | 1.42 | 0.5983 |
| NT-proBNP ≥ 3000 ng/L | 108 | 44.4 (48) | 3.42 | 1.63 | 7.18 | 0.0011 | 4.72 | 1.92 | 11.6 | 0.0007 | 3.29 | 1.71 | 6.33 | 0.0004 | |
| Haemoglobin at baseline (g/dL) | 104 | 13.5 ± 1.5 | 1.5 | 0.62 | 0.45 | 0.85 | 0.0030 | 0.58 | 0.40 | 0.83 | 0.0033 | 0.67 | 0.50 | 0.90 | 0.0072 |
| ALAT at baseline (U/L) | 100 | 29.3 ± 25.8 | 25 | 1.00 | 0.73 | 1.36 | 0.9783 | 0.68 | 0.33 | 1.43 | 0.3097 | 1.11 | 0.77 | 1.59 | 0.5787 |
| Albumin at baseline (g/dL) | 83 | 40.7 ± 3.7 | 4 | 0.76 | 0.52 | 1.10 | 0.1491 | 0.73 | 0.51 | 1.03 | 0.0721 | 0.61 | 0.44 | 0.86 | 0.0051 |
| Estimated GFR (mL/min/1.73 m2) | 109 | 59.9 ± 20.2 | 20 | 0.55 | 0.40 | 0.78 | 0.0007 | 0.56 | 0.40 | 0.79 | 0.0010 | 0.52 | 0.38 | 0.72 | <0.0001 |
| GFR ≥ 45 mL/min/m2 | 109 | 77.1 (84) | 0.29 | 0.15 | 0.59 | 0.0006 | 0.35 | 0.16 | 0.74 | 0.0063 | 0.25 | 0.14 | 0.47 | <0.0001 | |
Values are percentage (frequency), mean ± standard deviation, or median (first—third quartile).
ACE, angiotensin-converting enzyme; ALAT, alanine transaminase; ARB, angiotensin receptor blockers; BNP, brain (or B-type) natriuretic peptide; CAD, coronary artery disease; GFR, glomerular filtration rate; HR, hazard ratio; LCL (and UCL), lower (and upper) confidence limits; NYHA, New York Heart Association.
aThe units of change in the continuous explanatory variable for which the customized hazard ratio is estimated.
Almost all patients were Caucasian and the vast majority (90.4%) were male. The median age was 82 [interquartile range (IQR) 77–85] years. In six patients hATTR-CM was diagnosed, two of whom were siblings. The remainder (95%) had wtATTR-CM (wild type ATTR-cardiomyopathy).
A minority of patients (17%) did not have dyspnoea, but only signs of left or right heart failure (oedema, orthopnoea, and jugular turgidity).
Seventy patients (62,5%) had a history of atrial fibrillation, and associated comorbidities were common: 70.5% of hypertension, 9.8% of diabetes, and 49.1% of hyperlipidaemia.
Twenty-eight patients had a permanent pacemaker, and the reasons for implantation was high-grade atrioventricular block in 19, and radiofrequency ablation of the atrioventricular junction in atrial fibrillation or conduction disturbances after valve replacement surgery in the remaining subjects.
Patients who met the primary endpoint were older, more symptomatic, more often pacemaker dependent, and had higher NT-proBNP and troponins and lower haemoglobin, eGFR, and body mass index.
Tables 2 and 3 present echocardiographic parameters, according to the vital status at 2 years. The deformation data are given for patients in whom strain imaging was feasible. LV GLS, RV-FWS, and LAS are, respectively, available in 111 (98%), 101 (89%), and 108 patients (95%).
Echocardiographic parameters at baseline and univariate association with overall death (main endpoint), cardiovascular death, and heart failure hospitalization free survival (secondary endpoints)
| Variable | n | Statistics | Unitsa | Main endpoint | Testb | Cardiovascular death | HF hospitalization free survival | |||||||||
|---|---|---|---|---|---|---|---|---|---|---|---|---|---|---|---|---|
| HR | LCL | UCL | P-value | HR | LCL | UCL | P-value | HR | LCL | UCL | P-value | |||||
| LV ED diameter (mm) | 113 | 44.4 ± 6.35 | 6 | 1.42 | 1.04 | 1.95 | 0.0292 | 1.33 | 0.98 | 1.82 | 0.0712 | 1.14 | 0.88 | 1.48 | 0.3286 | |
| IV septal wall thickness (mm) | 113 | 16.0 (14.0–18.0) | 4 | 1.18 | 0.79 | 1.76 | 0.4075 | 0.95 | 0.57 | 1.59 | 0.8484 | 1.07 | 0.72 | 1.60 | 0.7268 | |
| LVEF (%) | 113 | 55.7 ± 12.7 | 10 | 0.60 | 0.48 | 0.76 | <0.0001 | 0.58 | 0.47 | 0.70 | <0.0001 | 0.67 | 0.55 | 0.81 | <0.0001 | |
| LV ED volume (mL) | 113 | 107 ± 37.8 | 38 | 1.24 | 0.90 | 1.70 | 0.1827 | 1.23 | 0.87 | 1.74 | 0.2406 | 1.21 | 0.91 | 1.61 | 0.1904 | |
| LV ES volume (mL) | 113 | 43.0 (29.0–63.0) | 30 | Spline | 0.0062 | 0.0220 | Spline | <0.0001 | Spline | <0.0001 | ||||||
| E velocity (cm/s) | 113 | 88.0 (75.0–100) | 25 | 0.94 | 0.70 | 1.25 | 0.6559 | 1.13 | 0.88 | 1.44 | 0.3364 | 1.05 | 0.77 | 1.43 | 0.7421 | |
| Deceleration time (ms) | 113 | 164 (138–205) | 60 | 0.80 | 0.56 | 1.14 | 0.2067 | 0.73 | 0.50 | 1.06 | 0.1005 | 0.89 | 0.64 | 1.22 | 0.4637 | |
| A velocity (cm/s) | 56 | 66.4 ± 29.7 | 30 | 1.29 | 0.64 | 2.60 | 0.4762 | 1.75 | 0.58 | 5.29 | 0.3187 | 1.48 | 0.78 | 2.82 | 0.2277 | |
| E/A ratio | 56 | 1.27 (0.99–2.17) | 0.5 | 0.97 | 0.76 | 1.23 | 0.7987 | 0.87 | 0.59 | 1.27 | 0.4616 | 0.86 | 0.70 | 1.06 | 0.1657 | |
| eʹ septal wall (cm/s) | 112 | 4.85 (3.75–6.00) | 2 | 0.76 | 0.49 | 1.17 | 0.2090 | 0.67 | 0.40 | 1.13 | 0.1308 | 0.78 | 0.54 | 1.13 | 0.1881 | |
| eʹ lateral wall (cm/s) | 110 | 6.00 (5.00–7.10) | 2 | 0.76 | 0.51 | 1.14 | 0.1840 | 0.82 | 0.57 | 1.18 | 0.2900 | 0.93 | 0.68 | 1.27 | 0.6612 | |
| E/eʹ | 111 | 16.0 (12.5–20.5) | 8 | Spline | 0.0851 | 0.0090 | Spline | 0.9072 | Spline | 0.2710 | ||||||
| aʹ | 112 | 3.67 ± 4.36 | 4 | 0.60 | 0.39 | 0.91 | 0.0170 | 0.55 | 0.33 | 0.93 | 0.0258 | 0.61 | 0.41 | 0.90 | 0.0135 | |
| RV ED area (cm2) | 111 | 18.0 ± 5.00 | 5 | Spline | 0.0161 | 0.0020 | Spline | <0.0001 | 0.0016 | Spline | 0.0001 | |||||
| RV basal diameter (mm) | 111 | 37.6 ± 7.16 | 7 | 1.33 | 0.97 | 1.82 | 0.0785 | 1.63 | 1.17 | 2.27 | 0.0039 | 1.44 | 1.08 | 1.93 | 0.0145 | |
| RV annulus diameter (mm) | 111 | 34.7 ± 6.15 | 6 | 1.41 | 1.04 | 1.90 | 0.0268 | 1.68 | 1.27 | 2.23 | 0.0003 | 1.46 | 1.14 | 1.88 | 0.0026 | |
| RV free wall thickness (mm) | 107 | 7.32 ± 1.78 | 2 | 1.34 | 0.94 | 1.90 | 0.1088 | 1.40 | 0.95 | 2.07 | 0.0867 | 1.05 | 0.76 | 1.43 | 0.7814 | |
| TAPSE (mm) | 110 | 16.7 ± 5.52 | 5 | 0.72 | 0.51 | 1.01 | 0.0547 | 0.64 | 0.42 | 0.99 | 0.0451 | 0.70 | 0.52 | 0.95 | 0.0234 | |
| RV systolic pressure (mmHg) | 90 | 42.7 ± 11.6 | 12 | 1.29 | 0.88 | 1.90 | 0.1924 | 1.18 | 0.81 | 1.73 | 0.3795 | 1.10 | 0.81 | 1.49 | 0.5477 | |
| RA pressure (mmHg) | 109 | 7.65 ± 4.61 | 5 | 1.70 | 1.18 | 2.45 | 0.0043 | 1.89 | 1.25 | 2.87 | 0.0026 | 1.80 | 1.31 | 2.48 | 0.0003 | |
| Mitral regurgitation | 113 | 57.5 (65) | 1 | 1.58 | 0.46 | 5.39 | 0.0713 | 0.95 | 0.27 | 3.31 | 0.0575 | 1.09 | 0.40 | 2.93 | 0.0350 | |
| 24.8 (28) | 2+ | 3.20 | 0.91 | 11.2 | 2.51 | 0.70 | 8.95 | 2.46 | 0.89 | 6.83 | ||||||
| Aortic regurgitation | 113 | 44.2 (50) | 1 | 2.14 | 0.97 | 4.73 | 0.1537 | 1.69 | 0.72 | 3.95 | 0.4776 | 1.64 | 0.84 | 3.18 | 0.3337 | |
| 12.4 (14) | 2+ | 2.08 | 0.74 | 5.84 | 1.48 | 0.47 | 4.65 | 1.17 | 0.44 | 3.10 | ||||||
| LVOT VTI (cm) | 113 | 16.8 ± 4.97 | 5 | 0.61 | 0.41 | 0.89 | 0.0106 | 0.49 | 0.29 | 0.82 | 0.0061 | 0.57 | 0.38 | 0.85 | 0.0062 | |
| Stroke volume index (mL/m2) | 113 | 34.6 ± 11.4 | 11 | 0.63 | 0.44 | 0.91 | 0.0130 | 0.53 | 0.32 | 0.89 | 0.0164 | 0.60 | 0.40 | 0.90 | 0.0146 | |
| LAVI (mL/m2) | 113 | 53.0 (43.0–64.0) | 20 | 1.10 | 0.77 | 1.56 | 0.6058 | 1.27 | 0.88 | 1.83 | 0.2033 | 1.29 | 0.95 | 1.76 | 0.1006 | |
| Right atrial area (cm2) | 111 | 20.0 (16.0–25.3) | 10 | 1.40 | 0.94 | 2.11 | 0.1018 | 1.77 | 1.28 | 2.44 | 0.0005 | 1.45 | 1.08 | 1.95 | 0.0127 | |
| Interatrial septum thickness (mm) | 111 | 4.27 ± 0.85 | 1 | 0.96 | 0.63 | 1.47 | 0.8673 | 0.98 | 0.55 | 1.75 | 0.9521 | 0.82 | 0.53 | 1.27 | 0.3782 | |
Values are percentage (frequency), mean ± standard deviation, or median (first—third quartile).
ED, end-diastolic; ES, end-systolic; GLS, global longitudinal strain; HR, hazard ratio; LCL (and UCL), lower (and upper) confidence limits; LAVI, left atrial volume index; LA, left atrium; LV, left ventricle; LVEF, left ventricle ejection fraction; RA, right atrium; RV, right ventricle; TAPSE, tricuspid annular plane excursion; VTI, velocity-time integral.
aThe units of change in the continuous explanatory variable for which the customized hazard ratio is estimated.
bKolmogorov-type supremum test, derived from cumulative sums of martingale residuals to assess the functional form of a covariate.
Echocardiographic parameters at baseline and univariate association with overall death (main endpoint), cardiovascular death, and heart failure hospitalization free survival (secondary endpoints) multivariable analysis according to the end-points
| Variable | n | Statistics | Unitsa | Main endpoint | Testb | Cardiovascular death | HF hospitalization free survival | |||||||||
|---|---|---|---|---|---|---|---|---|---|---|---|---|---|---|---|---|
| HR | LCL | UCL | P-value | HR | LCL | UCL | P-value | HR | LCL | UCL | P-value | |||||
| LV GLS (%) | 111 | −12.4 ± 3.75 | 4 | 2.08 | 1.39 | 3.13 | 0.0004 | 2.04 | 1.43 | 2.93 | <0.0001 | 1.65 | 1.25 | 2.18 | 0.0004 | |
| Apical/mid + basal ratio | 111 | 2.29 (1.84–2.67) | 1 | 0.78 | 0.47 | 1.30 | 0.3441 | 0.87 | 0.51 | 1.48 | 0.6156 | 0.83 | 0.55 | 1.25 | 0.3782 | |
| Global work index | 111 | 1075 (805–1523) | 700 | 0.39 | 0.22 | 0.69 | 0.0011 | 0.37 | 0.22 | 0.62 | 0.0002 | 0.43 | 0.28 | 0.65 | <0.0001 | |
| Global constructive work | 111 | 1440 ± 517 | 500 | 0.53 | 0.36 | 0.79 | 0.0017 | 0.52 | 0.35 | 0.77 | 0.0011 | 0.60 | 0.45 | 0.79 | 0.0003 | |
| Global wasted work | 111 | 146 (100–203) | 100 | Spline | 0.0005 | 0.0060 | Spline | NE | Spline | NE | ||||||
| Global work efficiency | 111 | 86.1 ± 6.15 | 6 | 0.80 | 0.59 | 1.09 | 0.1567 | 0.81 | 0.61 | 1.07 | 0.1361 | 0.78 | 0.62 | 0.99 | 0.0402 | |
| FWS (RV free wall strain) | 101 | −18.3 ± 7.29 | 8 | 1.83 | 1.17 | 2.87 | 0.0080 | 1.90 | 1.21 | 3.01 | 0.0057 | 1.88 | 1.28 | 2.76 | 0.0012 | |
| LA strain/reservoir phase, % | 108 | 7.00 (4.00–12.0) | 6 | 0.62 | 0.40 | 0.97 | 0.0379 | 0.54 | 0.33 | 0.86 | 0.0102 | 0.57 | 0.39 | 0.83 | 0.0031 | |
| LA strain/conduit phase, % | 108 | −5.00 (−9.00; −3.00) | 4 | 1.45 | 1.01 | 2.08 | 0.0428 | 1.66 | 1.09 | 2.53 | 0.0184 | 1.39 | 1.00 | 1.93 | 0.0472 | |
| LA strain/contraction phase, % | 108 | 0.00 (−5.00; 0.00) | 4 | 1.17 | 0.80 | 1.71 | 0.4198 | 1.14 | 0.79 | 1.64 | 0.4928 | 1.30 | 0.94 | 1.81 | 0.1154 | |
Values are percentage (frequency), mean ± standard deviation, or median (first—third quartile).
GLS, global longitudinal strain; HR, hazard ratio; LCL (and UCL), lower (and upper) confidence limits; LA, left atrium; LV, left ventricle; RV, right ventricle.
aThe units of change in the continuous explanatory variable for which the customized hazard ratio is estimated.
bKolmogorov-type supremum test, derived from cumulative sums of martingale residuals to assess the functional form of a covariate.
LV hypertrophy was present in most patients, with both the inter-ventricular septum [16.0 mm, IQR (14.0–18.0)] and posterior wall [14.0 (12.0–16.0)] being thickened.
Despite LVEF being within the normal range or only slightly reduced (55.7% ± 12.7), LV GLS was impaired (−12.4 ± 3.75, n < −16%). The average relative regional strain ratio was 2.29, concordant with visual relative apical sparing, shown in Figure 1.
RV systolic function would be classified as normal by TAPSE 16.7 ± 5.52; however, RV FWS was substantially reduced (−18.3 ± 7.29, n < −30%), indicating RV longitudinal shortening abnormalities.
The subset with the primary endpoint was characterized by larger LV end-diastolic diameter, LV end-systolic volume, RV area and RA pressure, and lower LVEF, LV and RV deformation parameters, LV GWI and GCW, and LA reservoir and conduit strain.
Description according to the outcome
The median follow-up time was 935 days (IQR 691–1159 days). Thirty-four patients (39%) died during the study follow-up (Table A1). Eighty-six patients were treated with tafamidis, either at baseline or during follow-up (Table A2).
In univariate analysis, treatment with tafamidis (P < 0.01), LV end-diastolic diameter (P < 0.05), LV end-systolic volume (P < 0.01), RV end-diastolic area (P < 0.05), RV end-systolic area (P < 0.05), right atrial pressure (P < 0.01), LVEF, left ventricular outflow tract velocity-time integral, stroke volume indexed, and output indexed (P < 0.01) were associated with the primary endpoint (Tables 1–3). Among the deformation-based parameters, LV GLS, GWI, GCW, GWW, and FWS were significantly associated with the primary outcome with a P < 0.01 (Figure 3). LA reservoir and conduit strain were also significant predictors of the primary endpoint, with a P < 0.05 (Table 3).
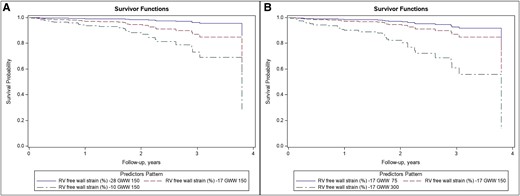
Kaplan–Meier curves according to two of the main predictor of prognosis according to the multivariable model (RV, right ventricular; GWW, global wasted work).
In multivariable analysis including clinical variables, NT-proBNP, eGFR, and treatment with tafamidis were significantly associated with the primary endpoint. When echocardiographic variables were added (final model), GWI, GWW, FWS, and LARs provided an independent prognostic contribution (Table 4). GWW (P = 0.002) showed a non-linear relationship with the study endpoints (Figure 4). In contrast, LV GLS and EF lost their significance after adjustment for other variables.
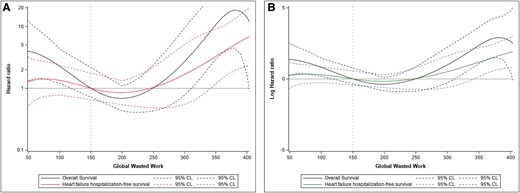
Results on primary and secondary endpoints of cardiovascular death (hospitalization for heart failure) for GWW, expressed as a hazard ratio (A) and as a log-hazard ratio (B).
Multivariable model including the clinical and echocardiographic parameters for association with overall death (main endpoint)
| Variable | Units | Baseline model | Final model | ||||||
|---|---|---|---|---|---|---|---|---|---|
| HR | LCL | UCL | P-value | HR | LCL | UCL | P-value | ||
| NT-proBNP (pg/mL) | 1000 | 1.06 | 1.01 | 1.18 | 0.0130 | 1.00 | 0.91 | 1.10 | 0.9995 |
| Estimated GFR (mL/min/1.73 m2) | 20 | 0.62 | 0.42 | 0.93 | 0.0218 | 0.76 | 0.44 | 1.30 | 0.3143 |
| Tafamidis (time-dependent) | 0.40 | 0.20 | 0.81 | 0.0110 | 0.0016 | ||||
| RV ED area (cm2) | Spline | 0.0314 | |||||||
| Global work index | 700 | 0.18 | 0.052 | 0.66 | 0.0091 | ||||
| Global wasted work | Spline | 0.0040 | |||||||
| FWS (RV free wall strain) | 8 | 4.14 | 1.32 | 12.9 | 0.0145 | ||||
| LA strain/reservoir phase | 6 | 0.31 | 0.09 | 0.99 | 0.0476 | ||||
Description of the selected echo parameter evolution across time
Sixty-two echocardiograms were available for reading, out of 95 living patients at 18 months.
Table B1 ( Appendix B) displays the echocardiographic parameter evolution between the last available measurement within 18 months and the baseline measurement expressed as annualized absolute mean difference.
A significant deterioration over time was demonstrated for: GWI (−299 mmHg/year, P < 0.001), global constructive work (−182 mmHg, P < 0.001) GLS (+1.47 points/year, P < 0.001), basal LS (+1.13 points/year, P < 0.01), apical LS (+2.22 points/year, P < 0.01), TAPSE (−2.15 cm/year, P < 0.001), and the LAS during reservoir phase (−1.69 points/year, P < 0.01).
Global concentric remodelling of the left ventricle was observed, with a decrease in LV end-diastolic diameter (−2.28 mm/year, P < 0.01), and an increase in the diastolic posterior wall thickness (+0.5 mm/year, P = 0.03) and the diastolic inter-ventricular septal wall thickness, although the latter did not reach significance (+0.47 mm/year, P = 0.06). LVEF, GWW, GWE, and RV FWS did not change significantly during follow-up.
Discussion
The major findings of this paper are that the deterioration of GWI and GCW is a feature of the natural history of transthyretin cardiac amyloidosis, and that GWI and GWW, in addition to RV and LA deformation, are associated with mortality and HF hospitalization. Accordingly myocardial work parameters might be considered for use in follow-up studies in patients with ATTR-CM (Graphical Abstract).
Our results are consistent with previous studies on amyloid heart disease,23,24 although to our knowledge, the present work is the first to include a transthyretin amyloidosis only population with follow-up. Our baseline strain and myocardial work data are comparable with other studies including patients with cardiac amyloidosis, which indicates a typical LV function impairment for this disease state.25,26
Our analysis revealed that low GWI and high GWW were associated with a poor prognosis (primary and secondary endpoints), independent of clinical and other echocardiographic factors. Importantly, these indices proved prognostically superior to GLS, which justifies the extension of LV strain assessment over myocardial work calculation in amyloidosis patients. Myocardial work integrates myocardial deformation and systolic blood pressure, which, in view of the afterload dependence of GLS, can explain the incremental prognostic information on cardiac mortality provided by GWI and GWW. GWW is affected by intra- and inter-ventricular conduction disorders, as it has been demonstrated in the population with heart failure.27 Conduction disorders are very common in ATTR-CM and dependence on pacing was associated with poorer prognosis in this group, which corresponds to the association of increased GWW with poor outcomes. Conduction disorders are related to the deposition of cardiac amyloid and may reflect the advanced stage of the disease. Twenty-eight (24.7%) patients had a pacemaker at the time of diagnosis, which illustrates this association28 in our study.
The beneficial effect of tafamidis on prognosis in amyloidosis is well recognized.6,10 Recently, the long-term extension study of ATTR-ACT trial4,29 supported the use of tafamidis 61 mg (as a bioequivalent to 80 mg), based on the reduction in the risk of death of 30%. The impact of this medication on echocardiographic parameters in our study is much challenging to affirm, as patients treated were selected by the team as being more likely to benefit from this treatment than those who were felt to be too comorbid. Thus, this might have provided some selection bias, enhancing the treatment effect seen.
We demonstrated that RV FWS and LASRES were associated with the study endpoints. This is in line with the study encompassing 127 patients aged 70 years, 80% of whom had AL amyloidosis, in which these two parameters predicted, along with GLS, all-cause mortality at 5 years.15 These data underscore the value of a multi-chamber strain analysis and echocardiographic follow-up of patients with amyloidosis.
The comparison of follow-up imaging supports the notion that cardiac amyloidosis is a progressive disease, as evidenced by the deterioration of GLS, GWI, global constructive work, TAPSE, and LASRES. LVEF was not prognostically useful and nor did it change significantly during follow-up. The degradation of strain-based parameters is probably related to the increase of amyloid deposits over time. The decrease in LV end-diastolic diameter associated with the increase in LV wall thickness and with the decrease in left atrial reservoir function supported this hypothesis.
The profile of myocardial work evolution over time in our cohort, with a decrease in GWI and GCW and no change in GWW, is like that seen in patients receiving cardiotoxic oncotherapy.30,31 It seems that the ‘active’ (constructive) component of myocardial work is most vulnerable to the progression of myocardial disease, thus being responsible for the overall decrease in cardiac performance in response to the pathological factor. Further studies are required to demonstrate the value of serial echocardiograms, but the current data are encouraging to set up a large prospective study based on the multi-chamber strain assessment, including myocardial work calculation, to better characterize LV function and its potential changes over time in cardiac amyloidosis.
Limitations
This is a single-centre, small sample-sized study investigating in detail echocardiographic parameters that could help to improve amyloidosis patient management. Our patients were referred for a suspicion of amyloidosis at a time the disease was not well known and the strategy of treatment with tafamidis was not established. Therefore, the prognostic role of myocardial function assessment at an earlier stage of ATTR-CM, considering also the impact of specific therapies, should be prospectively investigated in further studies.
Conclusion
Myocardial work parameters, especially GWI and GWW, are independent prognosticators in ATTR-CM, outperforming other LV indices in clinical risk stratification. Multi-chamber strain assessment may improve the surveillance of patients with ATTR-CM, and myocardial work may provide incremental prognostic value over other LV markers, including GLS, in this population.
Acknowledgements
The authors thank Dominique Fargeaud for the tremendous help to get the database completed and for the help in managing these patients.
Funding
None.
Data availability
The data underlying this article will be shared on reasonable request to the corresponding author.
Appendix A
Occurrence of primary and secondary outcomes
| Death during follow-up | Cause of death | Hospitalization for heart failure | Treatment | Frequency | Percent | Cumulative frequency | Cumulative percent |
|---|---|---|---|---|---|---|---|
| No | No | Tafamidis | 57 | 50.44 | 57 | 50.44 | |
| No tafamidis | 10 | 8.85 | 67 | 59.29 | |||
| Yes | Tafamidis | 12 | 10.62 | 79 | 69.91 | ||
| No tafamidis | 0 | 0 | 79 | 69.91 | |||
| Yes | Unknown | Unknown | Tafamidis | 1 | 0.88 | 80 | 70.79 |
| Cardiac | No | Tafamidis | 1 | 0.88 | 81 | 71.67 | |
| No tafamidis | 6 | 5.31 | 87 | 76.98 | |||
| Yes | Tafamidis | 10 | 8.85 | 97 | 85.83 | ||
| No tafamidis | 9 | 7.97 | 106 | 93.81 | |||
| Non-cardiac | No | Tafamidis | 2 | 1.77 | 108 | 95.58 | |
| No tafamidis | 1 | 0.88 | 109 | 96.46 | |||
| Yes | Tafamidis | 3 | 2.65 | 112 | 99.11 | ||
| No tafamidis | 1 | 0.88 | 113 | 100.00 |
Proportion of patients who received specific treatment for ATTR-CM
| Treatment | Frequency | Percent | Cumulative frequency | Cumulative percent |
|---|---|---|---|---|
| None | 25 | 22.12 | 25 | 22.12 |
| Tafamidis 20 | 76 | 67.26 | 101 | 89.38 |
| Tafamidis 61 | 10 | 8.85 | 111 | 98.23 |
| Patisiran or placebo 50% | 2 | 1.76 | 113 | 100.00 |
| Treatment | Frequency | Percent | Cumulative frequency | Cumulative percent |
|---|---|---|---|---|
| None | 25 | 22.12 | 25 | 22.12 |
| Tafamidis 20 | 76 | 67.26 | 101 | 89.38 |
| Tafamidis 61 | 10 | 8.85 | 111 | 98.23 |
| Patisiran or placebo 50% | 2 | 1.76 | 113 | 100.00 |
Appendix B
Echocardiographic parameter evolution between the last available measurement within 18 months and baseline measurement expressed as annualized absolute difference mean and signed-rank testing for a mean equal to zero
| Parameter | Baseline mean | Last measure mean | Absolute difference mean | Standard error of the mean | P-value |
|---|---|---|---|---|---|
| Left ventricular ejection fraction (LVEF) (%) | 56.01 | 53.89 | −1.544 | 1.562 | 0.1675 |
| LV global longitudinal strain (%) | −12.53 | −10.92 | 1.473 | 0.354 | <0.0001 |
| Average LV basal longitudinal strain (%) | −5.70 | −4.63 | 1.137 | 0.442 | 0.0044 |
| Average LV apical longitudinal strain (%) | −18.94 | −16.48 | 2.227 | 0.595 | <0.0001 |
| LV apical/mid + basal longitudinal strain | 2.43 | 2.43 | 0.012 | 0.111 | 0.9050 |
| Global work index (mmHg%) | 1408.57 | 1027.26 | −299.005 | 153.605 | <0.0001 |
| Global constructive work (mmHg%) | 1438.16 | 1250.39 | −182.760 | 38.938 | <0.0001 |
| Global wasted work (mmHg%) | 162.22 | 144.52 | −16.918 | 13.297 | 0.2329 |
| Global work efficiency (%) | 86.01 | 85.51 | −0.433 | 1.048 | 0.3767 |
| RV free wall strain (%) | −18.36 | −17.11 | 1.571 | 1.193 | 0.1502 |
| RV apical/mid + bas longitudinal strain | 1.34 | 1.71 | 0.204 | 0.368 | 0.4396 |
| Tricuspid annular plane systolic excursion (mm) | 16.57 | 14.92 | −2.154 | 0.590 | 0.0010 |
| LA strain during reservoir phase (%, positive value) | 8.81 | 7.65 | −1.689 | 0.588 | 0.0067 |
| LA strain during contraction phase (%, negative value) | −2.40 | −1.95 | 0.699 | 0.415 | 0.2717 |
| LA volume index | 54.79 | 56.08 | 0.127 | 1.644 | 0.8964 |
| LV ED diameter (mm) | 44.28 | 42.32 | −2.284 | 0.767 | 0.0019 |
| Posterior wall thickness, diastole (mm) | 14.37 | 15.13 | 0.504 | 0.290 | 0.0302 |
| Inter-ventricular septal wall thickness, diastole (mm) | 15.97 | 16.72 | 0.473 | 0.311 | 0.0684 |
| LVOT VTI | 16.96 | 16.18 | −0.509 | 0.523 | 0.3865 |
References
Author notes
Conflict of interest: General Electric Healthcare has provided research facilities to Rennes University Hospital through a contract with E.D.
