


Abstract
Mammography, commonly used for breast cancer screening in women, can also predict cardiovascular disease. We developed mammography-based deep learning models for predicting coronary artery calcium (CAC) scores, an established predictor of coronary events.
We evaluated a subset of Korean adults who underwent image mammography and CAC computed tomography and randomly selected approximately 80% of the participants as the training dataset, used to develop a convolutional neural network (CNN) to predict detectable CAC. The sensitivity, specificity, area under the receiver operating characteristic curve (AUROC), and overall accuracy of the model’s performance were evaluated. The training and validation datasets included 5235 and 1208 women, respectively [mean age, 52.6 (±10.2) years], including non-zero cases (46.8%). The CNN-based deep learning prediction model based on the Resnet18 model showed the best performance. The model was further improved using contrastive learning strategies based on positive and negative samples: sensitivity, 0.764 (95% CI, 0.667–0.830); specificity, 0.652 (95% CI, 0.614–0.710); AUROC, 0.761 (95% CI, 0.742–0.780); and accuracy, 70.8% (95% CI, 68.8–72.4). Moreover, including age and menopausal status in the model further improved its performance (AUROC, 0.776; 95% CI, 0.762–0.790). The Framingham risk score yielded an AUROC of 0.736 (95% CI, 0.712–0.761).
Mammography-based deep learning models showed promising results for predicting CAC, performing comparably to conventional risk models. This indicates mammography’s potential for dual-risk assessment in breast cancer and cardiovascular disease. Further research is necessary to validate these findings in diverse populations, with a particular focus on representation from national breast screening programmes.
See the editorial comment for this article ‘Can machine learning predict cardiac risk using mammography?', by G. Lip and D.P. O’Regan, https://doi.org/10.1093/ehjci/jeae019.
Introduction
Cardiovascular disease (CVD) is the leading cause of death worldwide and the second leading cause of death in Korea.1,2 Despite the increasing prevalence of CVD among middle-aged women, their risk is often underestimated,3,4 highlighting the need for efficient predictive tools to detect and prevent CVD in this population.
Coronary artery calcium (CAC) scoring has emerged as a reliable predictor of coronary events.5,6 Recently, CAC scoring was proven to be an effective means of evaluating cardiovascular risk in asymptomatic adults who are at particularly intermediate risk, leading to improved diagnosis, management, and outcomes of patients with CVD.5–7 However, the cost and radiation hazard may limit the utility and extendibility of CAC scoring to the general population.
Mammography, on the other hand, is a widely used screening tool for breast cancer in women aged over 40 years and has recently shown potential for predicting CVD.8,9 Breast artery calcification (BAC) observed on mammography significantly increases the risk of CVD, and other mammographic features, including breast density and calcifications, are also associated with CVD risk.8–10 Despite these promising findings, limited data are available on mammography-based deep learning models for CAC prediction. Deep learning technology has shown promising results in medical image analysis tasks, including classification, segmentation, and detection. Therefore, we hypothesized that mammography-based deep learning can predict the CAC score (CACS), which can be used as a risk stratification tool for cardiovascular events and eligibility criteria for statin treatment.
We aimed to develop mammography-based artificial intelligence (AI) models for CAC prediction to identify women with high CVD risk who may benefit the most from CAC testing and relevant interventions, ultimately reducing the social cost of CVD and improving women’s health.
Methods
Study population
This study was based on a subset of the Kangbuk Samsung Health Study, which observed Korean individuals who were at least 18 years old and underwent regular health check-ups at the Kangbuk Samsung Hospital Total Healthcare Centers in Seoul and Suwon, South Korea.11,12 We used clinical and imaging data routinely collected during health screening evaluations, including surveys, blood analysis, and imaging results, as well as medical procedures such as mammography and CAC computed tomography (CT).11,12 The study population was restricted to female participants who underwent mammography and CAC CT as part of a comprehensive health examination from January 2010 to December 2020 (n = 36 120 women, 41 492 examinations). To address the limited number of non-zero cases (representing only 10%) in comparison to the substantial number of zero cases, we retained all non-zero cases, excluding only those with identified errors during subsequent visits, particularly cases initially showing a positive CACS but later displaying zero CAC. To minimize measurement errors and establish a balanced dataset between zero and non-zero CAC cases, we incorporated cases with confirmed zero scores obtained through at least two measurements. Additionally, 1079 participants were excluded owing to missing data on postmenopausal status (n = 18), missing at least one of four mammography views (n = 272), or image information corruption during the preprocessing step when converting the image data format (n = 789). The final sample size for analysis included 6443 cases (3412 zero-CAC and 3031 non-zero CAC cases), considering individuals who met more than one exclusion criterion (refer to Figure 1, Supplementary data online, Material and also refer to Supplementary data online, Figures S1 and S2 for histograms depicting the age and CAC distribution in the full set, training set, and test set). The dataset was randomly divided into developmental and internal test sets at an 8:2 ratio, stratified by zero- and non-zero CAC categories at the individual level. Within the developmental set, random divisions were performed to create training and validation sets for hyperparameter tuning and model selection. To prevent overfitting, we partitioned the data by individuals, including only one examination per person, and maintained data exclusivity across training, validation, and internal test sets.
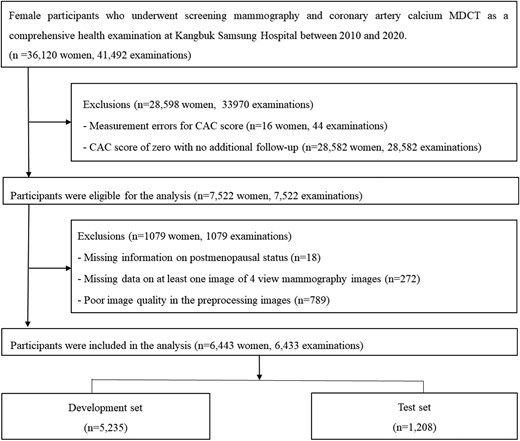
Flowchart of study participants. Abbreviations: CAC, coronary artery calcium; MDCT, multi-detector computed tomography.
This study was approved by the Institutional Review Board (IRB) of Kangbuk Samsung Hospital (IRB No. 2021-04-003) and conducted in accordance with the principles of the Declaration of Helsinki. The need for informed consent was waived by the IRB due to the use of de-identified data that was routinely collected during health screening examinations.
Coronary artery calcium scoring
The evaluation of coronary artery calcification was performed using a Lightspeed VCT XTe-64 slice multi-detector CT scanner (GE Healthcare, Chicago, IL, USA) following the standard scanning protocol11 of 2.5 mm thickness, 400 ms rotation time, 120 kV tube voltage, and 124 mAS (310 mA 0.4 s) tube current under electrocardiogram-gated dose modulation, without the administration of intravenous contrast medium. To minimize motion artefacts caused by breathing and improve the image quality, participants were advised to hold their breath at the end of inspiration during cardiac scans. The analysis of the CACS was conducted by skilled technicians using semi-automatic methodology and GE Smartscore software (GE Healthcare). Experienced radiologists verified the reconstructed images using a 512 × 512 matrix in the axial plane and identified areas suspected of CAC using the standard minimum calcium threshold of 130 Hounsfield units. CACS was computed using Agatston units and was divided into four categories (0, 1–10, 10–100, and >100) based on previous studies, with the latter being an important cut-off value for statin eligibility.13,14 Initially, the >300 category was considered distinct according to the coronary artery data and reporting system13 but was later merged with the >100 category due to a limited number of cases in this category. The inter- and intra-observer reliability for CACS was excellent, with an intra-class correlation coefficient of 0.99.11
Mammography images
We obtained consecutive digital screening mammograms from women who underwent routine comprehensive health examinations. All eligible women underwent standard four-view digital mammography exams [including bilateral craniocaudal (CC) and mediolateral oblique (MLO) views] using either a Senograph 2000D/DMR/DS system (GE Healthcare) or a Selenia system (Hologic, Marlborough, MA, USA) in our Suwon and Seoul centres.15 We also used the CACS and data for other CVD risk factors, which were obtained on the same day as the mammography exam.
Data collection and definition of conventional risk factors
Data on lifestyle factors, medical and medication history, and first-degree family history of CVD were collected using standardized, self-administered questionnaires. Trained nurses or technicians obtained anthropometric measurements, blood pressure (BP), and blood samples.11 We classified health behaviours into three categories: smoking status (never, former, or current smoker), average alcohol consumption (0, ≤10, or >10 grams per day), and regular exercise (none, <3, and 3 or more times per week). Participants with physician-diagnosed angina or myocardial infarction were classified as having a history of coronary heart disease (CHD). A family history of CHD was defined as having first-degree family members with a history of CHD at any age. Blood samples were obtained after at least a 10-h fast to measure serum glucose and lipid levels.
Framingham risk score (FRS) was calculated based on the six coronary risk factors including age, sex, total cholesterol, HDL-cholesterol, systolic BP, and smoking habits.16 There is no established FRS risk threshold for defining non-zero CAC scores. Zero CAC signifies low risk for cardiovascular events and mortality, while FRS <10% indicates low risk,17 and an FRS in the range of 0–5% is considered indicative of very low CVD risk.18 Hence, we used these thresholds to differentiate between individuals with zero CAC and those with non-zero CAC.
While there are some cardiovascular disease prediction models designed for the Korean population,10–12 the FRS, which has been extensively validated in the Korean context, demonstrates relatively good discriminatory capabilities, albeit with a tendency to overestimate absolute risk.11,13–15 Notably, unlike several other cardiovascular risk prediction models that impose a 40-year age limit, the FRS offers the advantage of not having such an age restriction, making it applicable as early as 20 years of age. Therefore, for our analysis, we selected the FRS as the most suitable tool, given its validation in multiple Korean studies and its broad age eligibility.
Mammography image preprocessing
We first converted the Digital Imaging and Communications in Medicine mammography images to Portable Network Graphic format for use in the deep learning system (also see the Supplementary data online, Material). Then, to reduce the proportion of black background in the image, we cropped the region of interest and resized it to 512 × 1024. To enhance the sharpness of the cropped image, contrast-limited adaptive histogram equalization was applied.
Deep learning system
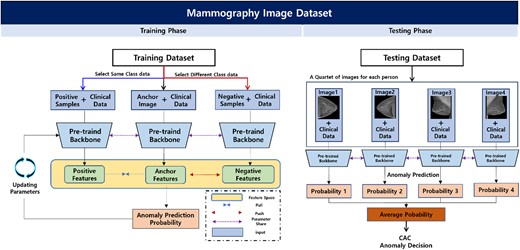
We developed a deep learning system using two tasks: the pretext and downstream tasks. The pretext task was deployed to improve the feature representation ability of the backbone network through self-supervised learning based on the inpainting task. A self-supervised-based pretext that allows convolutional neural network (CNN)-based backbone networks was used to express the mammography characteristics effectively in downstream tasks. Then, the pre-trained backbone network was used in the downstream task to differentiate CAC in mammography images and clinical data. For the downstream task, we utilized a two-step process that involved averaging the probability values of CAC anomalies from the backbone network using CC and MLO images of each participant to determine normal or abnormal results. To improve accuracy, we introduced contrastive learning, which allowed us to compare and adjust anchor features in the feature space based on deep learning techniques using multi-view mammography images of the participants. Finally, we extended the experiment to include additional clinical data (i.e. age and menopause) with mammography images as input values for a multi-modality method CNN to improve the accuracy of predicting CAC abnormalities beyond that of mammography alone (Figure 2). The code used is accessible at https://github.com/sangila3/CAC_prediction.
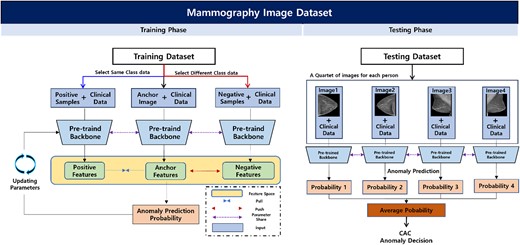
Overview of the proposed downstream task for predicting CAC abnormalities. Based on a pre-trained model from the pretext task, participants’ CC and MLO images and clinical data were used in the training phase to identify CAC abnormalities. In the feature space, contrastive learning can improve the performance of anomaly prediction and is applied to position the positive samples and features extracted from the anchor closer together, whereas negative samples and the features extracted from the anchor are positioned farther apart. Finally, in the test phase, the deep learning network developed from the training phase is used to make anonymous CAC decisions using the four-view image data of each testing participant. Abbreviations: CAC, coronary artery calcium; CC, craniocaudal; MLO, mediolateral oblique.
Statistical analysis
Descriptive statistics were used to summarize the characteristics of the participants in both the training and test sets separately.
The primary endpoint was prevalence of non-zero CAC; the secondary endpoints were the prevalence of CACS >10 or CACS >100, which is an important cut-off for statin eligibility. To evaluate the performance of the prediction model, four diagnostic metrics (95% confidence intervals) were measured, including sensitivity, specificity, area under the receiver operating characteristic curve (AUROC), and overall accuracy.
The predictive performance of the mammography-based CVD risk was compared with that of the FRS prediction model using the previously mentioned diagnostic metrics (sensitivity, specificity, AUROC, and overall accuracy).19
Sensitivity analyses were performed to evaluate the robustness of the primary results by (i) excluding women with a history of CHD, (ii) excluding women aged 30–39 years (below the recommended screening age in Korea), and (iii) conducting stratified analyses among individuals at low risk (<10% FRS) and higher risk. Statistical analyses were performed using STATA version 17.0 (StataCorp LLC, College Station, TX, USA). Statistical significance was set at P < 0.050.
Results
Characteristics of study participants
A total of 6443 participants were included in the study: 3412 had no CAC (52.95%); the mean [standard deviation (SD)] age was 46.44 (6.01) years, with 48.8% with postmenopausal status. Moreover, 3031 had CAC (47.04%); the mean (SD) age was 58.55 (10.08) years, with 50.9% with postmenopausal status. To construct the test dataset, we randomly selected 604 individuals from both the zero- and non-zero CAC groups (∼19% of all participants), and the remaining participants were used to construct a development dataset. The characteristics of the participants are summarized in Table 1, with stratification by development and test datasets. The mean age, parity, postmenopausal status, and cardiovascular risk factors were similar between the two groups.
Characteristics of the study population by development and test sets
| Characteristics | Development set | Test set |
|---|---|---|
| Number of participants | n = 5235 | n = 1208 |
| Age (years)a | 52.6 (10.1) | 52.8 (10.3) |
| Age groups (%) | ||
| 30–39 | 6.3 | 5.6 |
| 40–49 | 42.8 | 41.9 |
| 50–59 | 25.9 | 26.2 |
| 60–69 | 18.2 | 19.4 |
| ≥ 70 | 6.8 | 6.9 |
| Centre (%) | ||
| Seoul | 51.8 | 52.4 |
| Suwon | 48.2 | 47.6 |
| Alcohol intake (%)b | 9.5 | 9.9 |
| Regular exercise (%)c | 15.3 | 13.9 |
| Lipid-lowering drugs (%) | 15.3 | 15.8 |
| Parity (%) | 94.2 | 94.5 |
| Postmenopausal status (%) | 42.2 | 42.9 |
| LDL-C category | ||
| < 100 mg/dL (%) | 22.1 | 24.0 |
| 100-<130 mg/dL (%) | 30.5 | 30.5 |
| 130-<160 mg/dL (%) | 28.1 | 25.2 |
| 160-<190 mg/dL (%) | 13.6 | 14.0 |
| ≥ 190 mg/dL (%) | 5.7 | 6.4 |
| Traditional risk factors except LDL-C | ||
| Current smoking (%) | 2.1 | 1.2 |
| Diabetes (%) | 12.9 | 12.9 |
| Hypertension (%) | 26.1 | 28.9 |
| Low HDL-C (%) | 22.3 | 22.5 |
| Family history of CHD (%) | 11.0 | 10.4 |
| Number of traditional risk factors | ||
| 0 | 48.7 | 47.6 |
| 1 | 34.0 | 35.5 |
| 2 | 13.4 | 12.8 |
| ≥ 3 | 3.9 | 4.1 |
| Framingham risk score, % | ||
| < 10 | 88.6 | 88.5 |
| 10–19 | 9.3 | 9.7 |
| ≥ 20 | 2.1 | 1.8 |
| CACS category, % | ||
| 0 | 53.9 | 50.2 |
| 1-<10 | 13.7 | 15.2 |
| 10-<100 | 22.4 | 23.0 |
| 100-<300 | 6.7 | 7.5 |
| ≥ 300 | 3.3 | 4.2 |
Abbreviations: CACS, coronary artery calcium score; CHD, coronary heart disease, HDL-C, high-density lipoprotein cholesterol, LDL-C, low-density lipoprotein cholesterol
aData are presented as the mean (standard deviation) or percentage.
b ≥ 10 g of ethanol per day.
c ≥ 3 times/week.
Deep learning-mammographic CAC risk model
Convolutional-based deep neural network according to different models
First, we conducted an experiment to determine whether the deep learning system could identify CAC anomalies from mammographic images. We used well-known convolutional-based deep neural networks to extract meaningful feature values from image data learned using training data. The performance evaluation was then conducted to determine whether the groups of participants were correctly classified as either zero- and non-zero CAC. Among the deep learning systems based on CNN architecture, the VGG19 model showed the poorest performance, with an AUROC of 0.637. In contrast, the Resnet18 model showed the highest AUROC (0.702) (Table 2, Figure 3). Therefore, we chose the Resnet18 model as the backbone network for further experiments.
Deep learning system with contrastive learning strategy
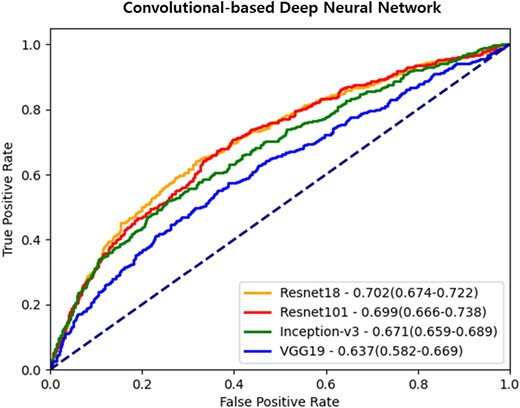
Receiver operating characteristic curves of convolutional-based deep neural networks. Each ROC curve demonstrates the evaluation results of CAC abnormality using mammography images with convolutional-based neural networks. The data is presented as the area under the curve, along with 95% confidence intervals.
Non-zero CAC prediction performance of deep learning-mammographic CAC risk models, compared with FRS models
| Models | Sensitivity | Specificity | AUROC | Accuracy (%) |
|---|---|---|---|---|
| CNN-based network according to different models | ||||
| Resnet18 | 0.730 (0.682–0.810) | 0.592 (0.523–0.645) | 0.702 (0.674–0.722) | 66.1 (63.4–68.3) |
| Resnet101 | 0.730 (0.638–0.816) | 0.586 (0.523–0.666) | 0.699 (0.666–0.738) | 65.8 (62.5–69.7) |
| Inception-v3 | 0.676 (0.611–0.738) | 0.587 (0.525–0.636) | 0.671 (0.659–0.689) | 63.1 (62.3–64.7) |
| VGG19 | 0.637 (0.574–0.694) | 0.580 (0.550–0.634) | 0.637 (0.582–0.669) | 60.9 (56.8–63.3) |
| Deep learning system with contrastive learning strategy | ||||
| Both positive and negative samples | 0.764 (0.667–0.830) | 0.652 (0.614–0.710) | 0.761 (0.742–0.780) | 70.8 (68.8–72.4) |
| Multi-modality approach with clinical data as input in addition to mammography images | ||||
| With age | 0.791 (0.752–0.825) | 0.640 (0.617–0.657) | 0.766 (0.748–0.786) | 71.5 (70.4–72.5) |
| With menopause | 0.800 (0.760–0.839) | 0.637 (0.603–0.696) | 0.772 (0.755–0.789) | 71.8 (70.5–72.9) |
| With age and menopause | 0.785 (0.757–0.825) | 0.656 (0.601–0.702) | 0.776 (0.762–0.790) | 72.1 (71.1–73.0) |
| Compared with the Framingham risk models | ||||
| FRS based on cut-off of 10% | 0.231 (0.196–0.270) | 0.990 (0.978–0.996) | 0.611 (0.592–0.629) | 63.0 (60.1–65.9) |
| FRS based on cut-off of 5% | 0.564 (0.520–0.606) | 0.909 (0.883–0.931) | 0.736 (0.712–0.761) | 74.6 (71.9–77.1) |
Abbreviations: AUROC, under the receiver operating characteristics; CAC, coronary artery calcium; CNN, convolutional neural network; FRS, Framingham risk models.
Second, we investigated whether a deep learning system could be used to compare the similarity between positive and negative samples to effectively differentiate between normal and abnormal mammography findings. We employed a contrastive learning strategy that used both positive and negative samples. This approach further improved the model’s performance, with the highest AUROC of 0.761 (Table 2, Figure 4) indicating the ability of the deep learning system to learn discriminative boundaries between classes. Supplementary data online, Table S1 shows the demographic characteristics and CVD risk factors based on the predicted CAC from mammography alone and original CAC. Notably, the difference between zero-CAC and non-zero CAC status, as determined by the original CAC CT findings, was similar to that of participants with non-zero CAC based on the predicted value using mammography. Specifically, individuals with non-zero CAC based on the predicted value according to mammography tended to be older with unfavourable CVD risk profiles in comparison with zero-CAC cases. Breast density was much higher in zero-CAC cases while fatty breast was higher in non-zero CAC categories despite similar distribution of mammographic calcification (see Supplementary data online, Table S1 and Figure 5 for saliency maps). In the comparison of concordant and discordant cases of predicted vs. actual CAC presence (see Supplementary data online, Table S2), we observed that concordant cases with both predicted and actual CAC = 0 were younger and had lower rates of diabetes, hypertension, and low HDL-C. In contrast, concordant cases with CAC > 0 exhibited the opposite pattern, and discordant cases displayed intermediate characteristics.
Deep learning system with additional clinical data
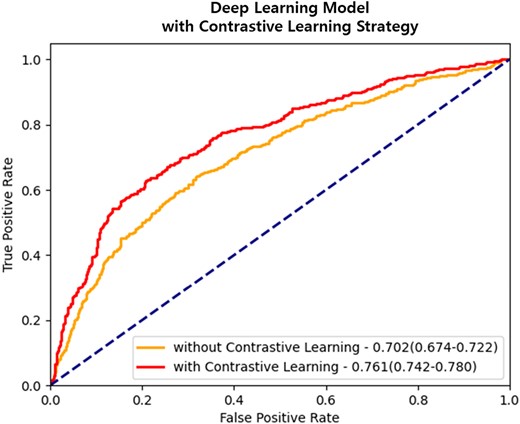
Evaluation performance after applying contrastive learning strategy. Applying contrastive learning to the ResNet18 model, which was the highest-performing convolutional-based deep neural network, demonstrates that it can improve the prediction performance of CAC abnormalities. The data is presented as the area under the curve, along with 95% confidence intervals.
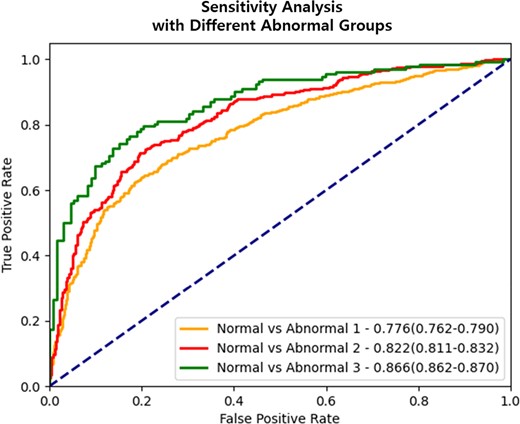
Evaluation results of performance in identifying CAC abnormality based on cut-off values. ROC curve represents the performance evaluation results of CAC abnormalities according to different cut-off values (CACS ≥10 or ≥100). The data is presented as the area under the curve, along with 95% confidence intervals. The deep learning system consistently demonstrates a pattern of better distinguishing CAC abnormality in mammography images of participants with a relatively high CACS. Abbreviations: CAC, coronary artery calcium; CACS, CAC score.
Finally, we integrated the clinical data with the mammography data as input to the deep learning system. To account for the disparate data types between clinical and mammography data, we initially preprocessed the clinical data while specifically focusing on the age variable, which was continuous data. We transformed the age data into categorical data by discretizing it into intervals of 10 years. In each experiment, the clinical data combined with the mammography data was used after concatenation. The resulting merged dataset served as the input for a convolutional-based deep learning network. To ensure compatibility and consistency, the clinical data was resized to match the dimensions of the mammography data. The results indicated that combining clinical information with mammography data resulted in a higher AUROC (0.776) compared with that of mammography data alone (Table 2).
Sensitivity analyses
We conducted additional experiments to assess the model’s ability to differentiate between normal and abnormal cases using different cut-off values (CACS ≥10 or ≥100) based on previous studies, with the latter being an important cut-off value for statin eligibility.13,14 For this experiment, we divided the data used in the previous experiment into two groups: the CACS = 0 vs. CACS ≥10 group, with 2122 normal and 2122 abnormal cases and the CACS = 0 vs. CACS ≥ 100 group, with 667 normal and 667 abnormal cases. To address the data imbalance, we randomly sampled normal participants to match the number of abnormal participants in each group from the available data on 3412 participants.
In Table 3 and Figure 6, we present the AUROC results for each model using different thresholds to define CAC abnormality. The AUROC for the deep learning model increased as a higher CACS was used to define CAC abnormality. Specifically, the AUROC for the model to classify zero-CAC vs. CACS ≥100 was the highest, with a value of 0.850 (95% confidence interval: 0.846–0.853), compared with that used to classify zero-CAC vs. non-zero CAC in the deep learning model for cases without clinical data. This pattern was consistently observed in the model with clinical data. Our findings indicate that the deep learning system can better distinguish CAC abnormality in the mammography images of participants with relatively high CACS.
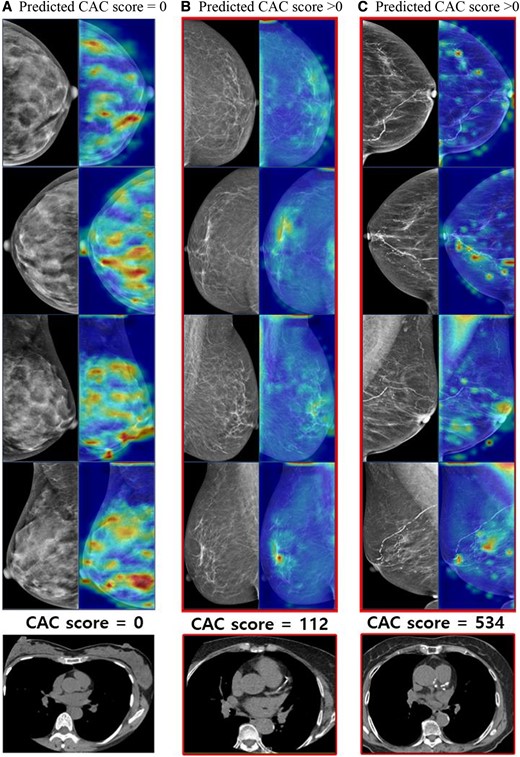
Heatmap of the zero CAC and non-zero CAC cases. The heatmap illustrates the application of our proposed method using deep learning system employing a contrastive learning strategy. The images in the first column represent participants with CAC score = 0, while the following two columns of images depict participants with CAC score > 0. (A) The breast tissue is exceptionally dense with no other abnormalities detected. (B) There are scattered fibroglandular densities in both breasts, along with benign calcifications in left breast. (C) Almost entirely fatty breasts parenchyma is observed, with benign vascular calcifications in both breasts. Please note that our model relied on CAC scores extracted from radiologists’ reports, rather than the images themselves.
Sensitivity analyses by different threshold CACS categories
| AUROC | |||
|---|---|---|---|
| Methods | Normal vs. Abnormal Ia | Normal vs. Abnormal IIb | Normal vs. Abnormal IIIc |
| Without clinical data | 0.761 (0.742–0.780) | 0.792 (0.785–0.802) | 0.850 (0.846–0.853) |
| With clinical data | |||
| With age | 0.766 (0.748–0.786) | 0.804 (0.800–0.807) | 0.859 (0.856–0.861) |
| With menopause | 0.772 (0.755–0.789) | 0.815 (0.803–0.828) | 0.858 (0.857–0.859) |
| With age and menopause | 0.776 (0.762–0.790) | 0.822 (0.811–0.832) | 0.866 (0.862–0.870) |
Compared with CACS = 0 as the normal reference.
Abbreviations: AUROC, under the receiver operating characteristics; CAC, coronary artery calcium; CACS, CAC score.
aCAC abnormalities using different CAC cut-offs were defined as Abnormal I(CACS ≥1).
bAbnormal II (CACS ≥10).
cAbnormal III (CACS ≥100).
Sensitivity analyses, excluding women with CHD history or those aged <40 years, yielded AI model performance consistent with the overall test set results (Table 4). In stratified analyses of individuals with low risk (<10% FRS) and higher risk, the performance in the low-risk group appeared inferior to that in the higher-risk group, despite similar AUROC values between the two subgroups.
Sensitivity analyses among subgroups encompassing participants without history of coronary heart disease (n = 1176), participants aged ≥40 years, the starting age of breast cancer screening in South Korea (n = 1140), and participants stratified by FRS risk
| Subgroups | Sensitivity | Specificity | AUROC | Accuracy (%) |
|---|---|---|---|---|
| Participants without history of coronary heart disease (n = 1176) | ||||
| 0.763 (0.664–0.829) | 0.644 (0.607–0.707) | 0.758 (0.740–0.777) | 70.5 (68.5–72.1) | |
| Participants aged ≥40 years, the starting age of breast cancer screening in South Korea (n = 1140) | ||||
| 0.749 (0.658–0.822) | 0.674 (0.631–0.728) | 0.764 (0.743–0.785) | 71.1 (69.3–72.7) | |
| Stratified by FRS risk | ||||
| Participants at low risk: FRS <10% (n = 984) | ||||
| 0.640 (0.584–0.767) | 0.695 (0.591–0.737) | 0.717 (0.707–0.730) | 66.5 (64.7–69.4) | |
| Participants at higher risk: FRS ≥10% (n = 128) | ||||
| 0.760 (0.620–0.800) | 0.730 (0.683–0.814) | 0.718 (0.623–0.774) | 73.1 (68.8–81.4) | |
Abbreviations: AUROC, under the receiver operating characteristics; CAC, coronary artery calcium; FRS, Framingham risk score.
Performance was assessed using a prediction model based on a deep learning system employing a contrastive learning strategy, which utilized both positive and negative samples.
Discussion
Our study found that a mammography-based deep learning model could comparably predict subclinical atherosclerosis measured by CAC. Only standalone mammography reasonably predicts the presence of CAC, and is even better for predicting high CACS of ≥100, meeting statin eligibility. These results are comparable with the performance of the conventional risk models, and its use in a breast cancer screening setting can help improve cardiovascular outcomes beyond improving breast cancer prognosis, which was the original purpose of mammography, without additional costs or radiation exposure (also refer to the potential workflow for the use of the AI algorithm provided in the Supplementary data online, Material). However, further research is necessary to validate these findings in diverse populations.
Numerous studies have been conducted to develop deep-learning models for detecting breast cancer based on mammography.20 However, to our knowledge, no deep-learning models have been reported for predicting CVD risk from mammography data. Our study is the first to demonstrate the potential role of mammography-derived CVD risk as a predictor of subclinical atherosclerosis. We employed a step-wise approach to enhance the model’s performance; this involved identifying the optimal CNN, implementing a contrastive learning strategy that used both positive and negative samples, and incorporating easily accessible clinical data such as age and menopausal status at the time of mammography alongside the mammography images. By minimizing the use of complex clinical data, we were able to demonstrate that the performance of our model using only mammography data or in combination with minimal clinical variables was comparable with that of conventional CVD risk models.
Breast cancer screening ages vary globally, but mammography, the primary method, consistently reduces advanced-stage disease by over 20% and lowers breast cancer mortality by 28–40%.21–23 Cancer modeling suggests that starting annual mammographic screening at age 40 can cut breast cancer mortality by nearly 40%.24 The American College of Radiology and the Society of Breast Imaging recommend annual mammographic screening from age 40,22 whereas in South Korea, biennial mammography starts at 40.25 In our dataset, 6.1% of women are aged 30–39, below Korea’s recommended screening age. Many under 40 opt for private or corporate mammograms due to concerns and easy access, potentially impacting result accuracy and over-diagnosis risk. To address this, we conducted a sensitivity analysis by excluding women aged 30–39, finding that the AI model's performance remained consistent with the results from the entire test set.
The exact mechanisms by which the mammographic features used in deep learning models predict cardiovascular risk are not yet fully understood, although recent research has revealed that mammography can provide valuable information about an individual’s risk for CVD.8,10 Observational studies and meta-analyses have identified BAC as a predictor for future cardiovascular risk,8,26 whereas breast density has been inversely associated with CVD risk.27 Mammographic parenchymal patterns could serve as an image marker of endogenous hormonal exposure, providing information about oestrogen levels that could potentially be used to predict CVD risk.28 Women with fatty breasts reportedly have high rates of hypertension and dyslipidemia, abnormal glucose metabolism, and a 3.48-fold increased risk of major cardiovascular events.27,29 Breast calcifications, which are small deposits of calcium in the breast tissue, are indicative of calcium deposition in other parts of the body and are also associated with future CVD events and mortality.10 Interestingly, during the development of a mammographic deep learning model for predicting breast cancer, predicting non-image clinical factors, such as age, family history, and hormonal factors, was possible from the mammogram vector when information on essential clinical factors was not available.30 Furthermore, shared risk factors exist between breast cancer and CVD, making this an intriguing finding.31
Our results revealed that participants with a non-zero predicted CACS based solely on mammography images, without the use of clinical data, displayed worse CVD risk profiles compared with those of participants with a zero predicted CACS, mirroring the results obtained using the original CACS. These findings suggest that a deep learning model trained on mammography images could serve as a reliable indicator of cardiovascular risk as it effectively captures image-based markers of CVD risk. As mammography has been used for breast cancer screening for over 40 years in many countries, the ability to predict CVD risk from mammography could help improve cardiovascular outcomes and reduce breast cancer mortality.8
Another intriguing avenue for future research lies in examining how this approach may influence patient perception and compliance with statin medication. Visualized risk assessments, as opposed to conventional risk scores, might have a more compelling impact on patient engagement. This potential could translate into improved patient adherence and greater adoption of relevant preventive measures and treatments, harnessing the power of image-based objective data alongside traditional questionnaires and blood tests. Nevertheless, further research is essential to fully explore the capabilities of this approach in improving health outcomes.
This study had several limitations. First, the participants were recruited from a single tertiary hospital health screening setting, possibly limiting the generalizability of our findings to the entire Korean female population or other ethnic populations. Second, while we were able to perform internal validation, external validation was not possible. Third, assessing BAC as a potential indicator of cardiovascular disease risk was not possible in this analysis due to the retrospective nature of data collection from routine health screening examinations. Although mandatory reporting was established for breast cancer probability, it did not encompass other non-malignant findings like BAC, which were typically reported as benign calcifications in radiological reports of screening mammography. Fourth, although the predicted CAC values were used to stratify individuals at high risk of CVD events and prompt timely intervention to reduce CVD mortality, they were not further validated to achieve the original purpose of CAC estimation.
Conclusions
Our study demonstrated that a mammography-based deep learning model can predict subclinical atherosclerosis, measured by CAC, comparably to that of traditional risk factors. As women over 40 years old often undergo routine screening mammography every 1–2 years in many countries, exploring the potential of mammography as a tool for estimating CVD risk could have important implications for women’s health, without adding extra costs or radiation exposure. However, further research is needed to confirm our findings in diverse populations, particularly emphasizing representation from national breast screening programmes, fully understand the mechanisms through which mammography predicts CVD risk, and assess the impact of mammography-based deep learning models on clinical practice.
Acknowledgements
The authors express their gratitude to the staff members of the Kangbuk Samsung Health Study for their hard work, dedication, and ongoing support, as well as to the participants of the Kangbuk Samsung Health Study for their valuable contributions.
Supplementary data
Supplementary data are available at European Heart Journal - Cardiovascular Imaging online.
Funding
This study was supported by the SKKU Excellence in Research Award Research Fund, Sungkyunkwan University, 2021; KBSMC-SKKU Future Clinical Convergence Academic Research Program, Kangbuk Samsung Hospital & Sungkyunkwan University, 2023; and the National Research Foundation of Korea funded by the Ministry of Science, ICT, and Future Planning (NRF-2021R1A2C1014363).
Data availability
These data were originally collected for health screening purposes and were not specifically designed for research or public dissemination. The data are not available to be shared publicly as we do not have IRB permission for distributing the data. However, supporting information or data is available from the corresponding author on reasonable request.
References
Author notes
Yoosoo Chang, Seungho Ryu and Jitae Shin contributed equally to this paper.
Conflict of interest: All authors report no conflict of interest.
