


Abstract
myocardial oedema is largely represented in takotsubo syndrome (TTS) and may contribute to alter the myocardium morphology and function. The aim of the study is to describe relationships between oedema, mechanical, and electrical abnormalities in TTS
the study included n = 32 hospitalized TTS patients and n = 23 controls. Cardiac magnetic resonance (CMR) with tissue mapping and feature tracking was performed with concomitant 12-lead electrocardiogram (ECG) recording. Mean age of TTS was 72 ± 12 years old, 94% women. Compared with controls, patients had higher left ventricular (LV) mass, worse systolic function, higher septal native T1 (1116 ± 73 msec vs. 970 ± 23 msec, P < 0.001), T2 (56 ± 5 msec vs. 46 ± 2 msec, P < 0.001), and extracellular volume (ECV) fraction (32 ± 5% vs. 24 ± 1%, P < 0.001). TTS patients had higher apicobasal gradient of T2 values (12 ± 6 msec vs. 2 ± 6 msec, P < 0.001); basal LV wall displayed higher native T1, T2, and ECV (all P < 0.002) but similar circumferential strain against controls (−23 ± 3% vs. −24 ± 4%, P = 0.351). In the TTS cohort, septal T2 values showed significant correlations with native T1 (r = 0.609, P < 0.001), ECV (r = 0.689, P < 0.001), left ventricular ejection fraction (r = −0.459, P = 0.008) and aVR voltage (r = −0.478, P = 0.009). Negative T-wave voltage and QTc length correlated with apicobasal T2 mapping gradient (r = 0.499, P = 0.007 and r = 0.372, P = 0.047, respectively) but not with other tissue mapping measurements.
CMR T1 and T2 mapping demonstrated increased myocardial water content conditioning interstitial expansion in acute TTS, detected even outside areas of abnormal wall motion. Oedema burden and distribution associated with mechanical and electrocardiographic changes, making it a potential prognostic marker and therapeutic target in TTS.

Introduction
Takotsubo syndrome (TTS) is an acute cardiac condition in which myocardial dysfunction develops in the absence of any culprit coronary artery disease.1 Though its underlying pathophysiology has not been fully elucidated yet, increased catecholaminergic drive at cardiac level is thought to play a central role,2 with myocardial oedema3 and inflammation4,5 being largely represented in the acute phase. In recent years, the development of cardiac magnetic resonance (CMR) tissue mapping imaging provided us with a parametric evaluation of myocardial tissue composition, including fibrosis, oedema, and estimation of the myocardial extracellular volume (ECV),6,7 with higher accuracy for the detection of myocardial inflammation as compared to less recent techniques.8 In TTS, native T1 and T2 mapping and ECV were described as elevated in the acute phase,9,10 while in the long term, native T1 mapping was used to report persistent myocardial tissue abnormalities,11 making CMR a valuable tool for the disease characterization.12 Preliminary investigations found a link between myocardial oedema and systolic function in TTS,9,13 however, fewer data are currently available comparing myocardial tissue composition and function by using a parametric assessment of myocardial deformation, such as CMR feature tracking.14 Moreover, the relationship between ECG changes and myocardial oedema has only partly been explored,15–17 with no study integrating the novel CMR mapping analysis paired with a timely ECG recording. The aim of the present research was to describe CMR tissue mapping findings in acute TTS as compared to a control cohort of similar age, sex, and cardiovascular risk factors distribution and to investigate relationships between the imaging biomarkers T1 and T2 mapping with the mechanical and electrocardiographic changes in TTS patients.
Methods
Study population
This is a single-centre, case-control, observational study in patients hospitalized with TTS. Our hospital is part of the GEIST registry [NCT04361994] and shares enrolment requirements and protocols with other collaborating institutions.18 For the present study, we enrolled consecutive patients who underwent a CMR examination with available tissue mapping imaging during the index hospitalization at Vannini Hospital, Rome, Italy. Tissue mapping sequences with standardized acquisition protocols at our hospital were available starting from October 2019, with last patient enrolled in December 2021. During this period, n = 42 patients were admitted for TTS at our hospital, of which n = 32 underwent timely CMR with tissue mapping during hospitalization and were included in the analysis of the present study. The diagnosis of TTS followed established criteria, as previously reported.18 Coronary angiography was performed in all patients to exclude any culprit coronary artery disease. Demographic and clinical characteristics, symptoms at onset, and stressful triggers were recorded at admission by the accepting physician. Ballooning patterns were identified by means of echocardiography and/or left ventriculography and classified as apical (typical), mid-ventricular, basal, or focal.19 In-hospital complications and outcome were recorded as previously described.20 Recovery of left ventricular ejection fraction (LVEF) was documented 1–6 months after the acute event in all patients. Follow-up after the acute event was performed as previously reported,21,22 including clinical and ECG evaluation plus echocardiography until LVEF recovery. Long-term outcome was verified by outpatient visits, medical records, or phone interviews. Control population was recruited from individuals who underwent a clinically indicated CMR examination at our institution in the past year whose age (±3 years), sex, and cardiovascular risk factor distribution matched our TTS cohort. The indications to perform CMR in this cohort were ECG abnormalities (n = 15) and suspected cardiomyopathy (n = 8); those who exhibited abnormal CMR findings and/or positive anamnesis of myocardial infarction, cardiomyopathy, or significant heart valve disease were excluded. All patients were managed in accordance with the Declaration of Helsinki and signed an informed consent for the processing of personal data for scientific and research purposes.
Electrocardiography
Twelve-lead surface electrocardiography was performed using a standard protocol (10 mm/mv, 25 mm/sec), with the patient in resting supine position. For the present study, we included in the analysis ECG recorded within 6 h of the CMR examination. T-wave inversion maximum voltage, sum of the amplitude of negative T waves, and number of leads displaying inverted T waves were calculated as described in the literature,15 thus excluding leads V1, aVR, and D3.23 The QT interval was measured from the onset of the QRS complex to the end of the T wave, or, when needed, to the intersection of the baseline (isoelectric) with a tangent line of the T-wave terminal limb.24 The obtained value was corrected using the Bazett’s formula to derive the QTc. QRS voltage of aVR was measured and considered as a proxy of limb leads voltages, since this was demonstrated to be a reliable approach in several clinical conditions.25 Patients without a timely available ECG (n = 2), as well as those displaying any bundle branch block (n = 2), were excluded from the ECG-related analysis. All patients were in sinus rhythm at the time of ECG recording and CMR examination.
Cardiac magnetic resonance imaging
A comprehensive description of the CMR sequences and protocol applied in the present study is reported within the Supplementary Appendix. All participants underwent a standard CMR using a 1.5 T scanner (Aera, Siemens Healthineers, Erlangen, Germany) for the acquisition of cardiac volumes and mass, myocardial T1 and T2 mapping, T2-STIR, and scar imaging. Analysis of cardiac volumes, function, mass, global longitudinal strain (GLS), and global circumferential strain (GCS) was performed using a dedicated software with semi-automated contour detection (MEDIS®, Leiden, the Netherlands). Pre- and post-contrast T1 mapping and T2 mapping values were assessed directly on the scanner through the vendor platform; areas of late gadolinium enhancement (LGE) were excluded from regions of interest. ECV quantification was performed from native T1 and post-contrast T1 mapping, with correction for haematocrit value.26,27 T1 and T2 mapping images were analysed qualitatively to assess for the presence of oedema (Figure 1); parametric evaluation was performed by drawing a conservative region of interest (ROI) within the septal region from the mid-short-axis slice, as indicated by expert consensus documents (Figure 2).26,27 Further analysis of regional and global mapping values was performed at basal, mid-, and apical level, respectively, by drawing a ROI including all myocardial segments within the slice. The apicobasal T2 gradient was calculated as the apical-ROI T2 minus the basal-ROI T2 values. LGE imaging was performed 15 min after gadolinium-based contrast agent administration. All observers were board-certified cardiologists or radiologists, holding established experience and accreditation of CMR competencies.
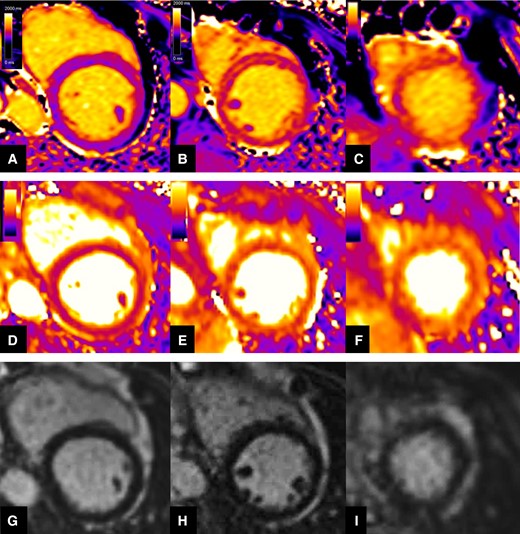
Representation of native T1 (top row), T2 mapping (mid row), and LGE (bottom row) qualitative assessment in a patient with acute TTS. Native T1 and T2 mapping displayed progressive increase of signal intensity from base (Panels A and D) to mid (Panels B and E), and apical (Panels C and F) LV wall level, consistent with wide myocardial oedema more extensively affecting the apical segments and presenting a non-coronary distribution. Negative LGE imaging (Panels G, H, and I).
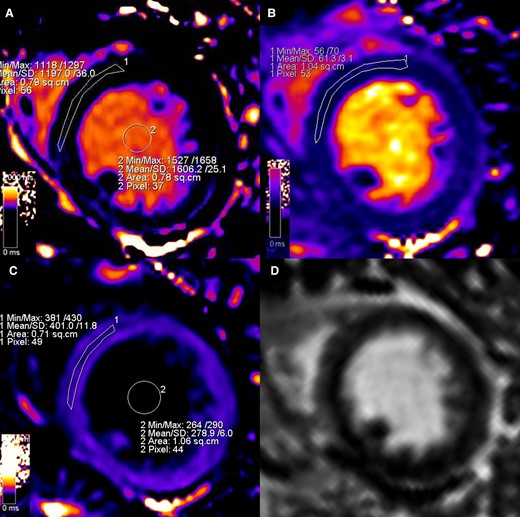
Representation of parametric assessment of tissue mapping features. Strong windowing was used to reduce the bias linked to colour visualization.26 A ROI conservatively drawn in the septum from the mid-short-axis slice was used to assess myocardial native T1 (Panel A, 1197 msec), T2 (Panel B, 61.3 msec), and post-contrast T1 (Panel C, 401 msec). Native (Panel A, 1606 msec) and post-contrast (Panel C, 278.9 msec) blood T1 was measured placing a ROIs within the LV lumen and then used, along with haematocrit level, to calculate the ECV (32% in this case) according to the formula described in the literature.26 LGE imaging (Panel D) was performed and used as a guidance for avoidance of scar, not present in this case, when positioning the ROIs during mapping assessment.
Statistical analysis
By review of CMR examinations of the previous year, we found n = 23 controls that met the pre-specified criteria. A formal power calculation was used by using data available in the literature10 finding that n = 32 patients and n = 23 controls would be highly sufficient to reach a statistical power of at least 90% with alpha 0.01 regarding tissue mapping parameters differences between groups. Normality was assessed by visual inspection of the distribution. Categorical variables were compared using a chi-square analysis or Fisher’s exact test as appropriate. Continuous variables were presented as mean ± standard deviation or as median with interquartile range. The Student’s t-test for independent samples or Mann–Whitney U test was used to compare continuous variables between patients and controls. Analysis of relationships within the TTS cohort was performed by using bivariate correlation and providing corresponding Pearson’s or Spearman correlation coefficients as appropriate. After using Bonferroni correction due to multiple testing, P value for significance was set at 0.01. All data were analysed with SPSS software version 25.0 (SPSS Inc., Chicago, Illinois).
Results
Clinical characteristics
Baseline demographic and clinical characteristics of the study population are summarized in Table 1. Mean age of patients was 72 ± 12 years old (controls 68 ± 12 years old, P = 0.223). Patients and controls displayed similar distribution of cardiovascular risk factors (all P > 0.05). TTS patients were predominantly of female sex (94%), an identifiable trigger preceding the onset was detected in 94% of the study patients (59% emotional, 34% physical). Mean LVEF on admission was 41 ± 8%, most patients displayed the classic apical ballooning (81%), and no cases of basal contraction pattern were detected. All patients had the left ventricular (LV) mid-septal region involved on admission, as defined by the presence of wall motion abnormalities in the area. In-hospital complications occurred in three (9%) patients, including two cases of pulmonary oedema and one of atrial fibrillation requiring cardioversion. Follow-up was available at a median of 248 days (interquartile range 132, 391 days) from admission; we observed one out-of-hospital death from non-cardiovascular cause at 98 days from the acute TTS event.
Baseline characteristics of TTS patients and controls
| Variable | TTS (n = 32) | Controls (n = 23) | P |
|---|---|---|---|
| Age (years) | 72 ± 12 | 68 ± 12 | 0.223 |
| Male (%) | 2 (6) | 2 (8) | 0.602 |
| Comorbidities | |||
| Hypertension (%) | 24 (75) | 13 (57) | 0.150 |
| Diabetes mellitus (%) | 3 (9) | 2 (9) | >0.99 |
| Dyslipidaemia (%) | 12 (37) | 5 (22) | 0.212 |
| Current smoker (%) | 4 (12) | 1 (4) | 0.387 |
| Clinical presentation | |||
| Chest pain (%) | 19 (59) | — | — |
| Dyspnoea (%) | 4 (12) | — | — |
| Stressful trigger (%) | 30 (94) | — | — |
| − Emotional (%) | 19 (59) | — | — |
| − Physical (%) | 11 (34) | — | — |
| Admission electrocardiographic findings | |||
| ST elevation (%) | 16 (50) | — | — |
| T-wave inversion (%) | 14 (44) | — | — |
| Admission echocardiographic findings | |||
| Apical ballooning (%) | 26 (81) | — | — |
| Mid-ventricular ballooning (%) | 4 (12) | — | — |
| Basal ballooning (%) | 0 (0) | — | — |
| Focal (%) | 2 (6) | — | — |
| LVEF (%) | 41 ± 8 | — | — |
| In-hospital course | |||
| In-hospital complications | 3 (9) | — | — |
| − Pulmonary oedema (%) | 2 (6) | — | — |
| − Arrhythmias (%) | 1 (3) | — | — |
Data are presented as no. (%), mean ± standard deviation, median (interquartile range). Left ventricular ejection fraction (LVEF).
Cardiac magnetic resonance
Cardiac magnetic resonance examination in TTS patients was performed at a median of 4 days (interquartile range 2, 6 days) after hospital admission. Cardiac magnetic resonance findings in patients and controls are displayed within Table 2. Takotsubo syndrome patients presented larger LV indexed end-systolic volume (39 ± 15 mL/m2 vs. 29 ± 8 mL/m2, P = 0.007), lower LVEF (49 ± 12% vs. 61 ± 5%, P < 0.001), and increased indexed LV mass (55 ± 11 g/m2 vs. 46 ± 8 g/m2, P < 0.001) as compared with controls. No LGE areas were detected in TTS and controls. Deformation analysis (Figure 3, Panel A) showed significantly reduced GLS and GCS in TTS patients (−17 ± 4% vs. −24 ± 4% and −16 ± 4% vs. −22 ± 3% respectively, both P < 0.001); however, circumferential strain at basal LV level was similar between groups (−23 ± 3% vs. −24 ± 3%, P = 0.351). Tissue mapping (Figure 3, Panel B) showed increased native T1 (septal: 1116 ± 73 msec vs. 970 ± 23 msec, P < 0.001), T2 (septal: 56 ± 5 msec vs. 46 ± 2 msec, P < 0.001), and ECV (septal: 32 ± 5% vs. 24 ± 1%, P < 0.001) in TTS as compared with controls in all segments investigated, including basal LV wall (native T1: 1044 ± 38 msec vs. 989 ± 22 msec, P < 0.001; T2: 51 ± 4 msec vs. 48 ± 2 msec, P = 0.001; ECV 30 ± 3% vs. 25 ± 2%, P < 0.001). A significantly higher apicobasal gradient of T2 mapping values was observed in TTS compared to controls (12 ± 6 msec vs. 2 ± 2 msec, P < 0.001).
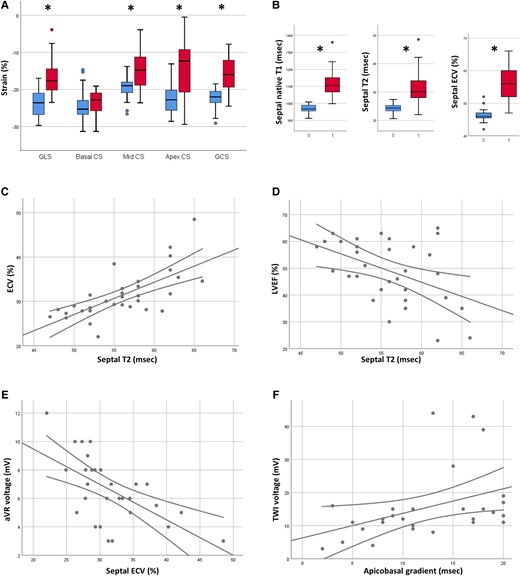
In Panel A, boxplots representing feature tracking results in patients (red boxes) and controls (blue boxes). Panel B: boxplots representing the values of native T1 (left), T2 (mid), and ECV (right) in patients (labelled by 1) and controls (labelled by 0). Panel C: scatter plot depicting the relationship between T2 and ECV. Panel D: scatter plot depicting the relationship between T2 and LVEF. Panel E: scatter plot depicting the relationship between ECV and QRS voltage of aVR. Panel F: scatter plot depicting the relationship between T2 apicobasal gradient and sum of the voltages of negative T waves. * indicates P < 0.01.
CMR characteristics of TTS and controls, the imaging test was performed at a median of 4 days after admission
| Variable | TTS (n = 32) | Controls (n = 23) | P |
|---|---|---|---|
| Symptom onset to CMR (days) | 4 (3, 7) | — | — |
| Admission to CMR (days) | 4 (2, 6) | — | — |
| Cardiac volumes and function | |||
| LVEDV index (mL/m2) | 76 ± 18 | 74 ± 13 | 0.645 |
| LVESV index (mL/m2) | 39 ± 15 | 29 ± 8 | 0.008 |
| LVEF (%) | 49 ± 12 | 61 ± 5 | <0.001 |
| LV mass index (g/m2) | 55 ± 11 | 46 ± 8 | <0.001 |
| RVEDV index (mL/m2) | 62 ± 14 | 72 ± 14 | 0.007 |
| RVESV index (mL/m2) | 28 ± 8 | 31 ± 10 | 0.193 |
| RVEF (%) | 55 ± 8 | 58 ± 7 | 0.114 |
| Myocardial deformation | |||
| LV GLS (%) | 17 ± 4 | 24 ± 4 | <0.001 |
| LV basal CS (%) | 23 ± 3 | 24 ± 4 | 0.351 |
| LV mid CS (%) | 15 ± 5 | 19 ± 3 | <0.001 |
| LV apical CS (%) | 15 ± 7 | 22 ± 4 | <0.001 |
| LV GCS (%) | 16 ± 4 | 22 ± 3 | <0.001 |
| Tissue mapping | |||
| Septal native T1 (msec) | 1116 ± 73 | 970 ± 23 | <0.001 |
| Basal native T1 (msec) | 1044 ± 38 | 989 ± 22 | <0.001 |
| Mid native T1 (msec) | 1118 ± 66 | 983 ± 27 | <0.001 |
| Apical native T1 (msec) | 1136 ± 95 | 995 ± 36 | <0.001 |
| Global native T1 (msec) | 1094 ± 51 | 988 ± 23 | <0.001 |
| Septal T2 (msec) | 56 ± 5 | 46 ± 2 | <0.001 |
| Basal T2 (msec) | 51 ± 4 | 48 ± 2 | 0.004 |
| Mid T2 (msec) | 58 ± 5 | 48 ± 2 | <0.001 |
| Apical T2 (msec) | 62 ± 6 | 49 ± 3 | <0.001 |
| Global T2 (msec) | 56 ± 4 | 48 ± 2 | <0.001 |
| T2 apicobasal gradient (msec) | 12 ± 6 | 2 ± 2 | <0.001 |
| Septal ECV (%) | 32 ± 5 | 24 ± 1 | <0.001 |
| Basal ECV (%) | 30 ± 3 | 25 ± 2 | <0.001 |
| Mid ECV (%) | 31 ± 5 | 25 ± 2 | <0.001 |
| Apical ECV (%) | 34 ± 6 | 27 ± 2 | <0.001 |
| Global ECV (%) | 31 ± 4 | 25 ± 2 | <0.001 |
Takotsubo syndrome (TTS), Left ventricle (LV), LV end-diastolic volume (LVEDV), LV end-systolic volume (LVESV), LV ejection fraction (LVEF), right ventricle (RV), RV end-diastolic volume (RVEDV), RV end-systolic volume (RVESV), RV ejection fraction (RVEF), global longitudinal strain (GLS), circumferential strain (CS), global circumferential strain (GCS), extracellular volume (ECV).
Analysis of relationships
Results from the correlations analysis in TTS patients are reported in the Supplementary data online, Table S1, and summarized within Table 3 with focus on tissue mapping measurements. Parameters of LV function were related to tissue mapping measurements. Specifically, higher native T1 and T2 related to worse LV systolic function as indicated by lower LVEF (r = 0.640, P < 0.001 and r = 0.459, P = 0.008, respectively) and more impaired GCS (r = 0.547, P = 0.001 and r = 0.366, P = 0.039, respectively). Global tissue mapping values yielded similar results vs. the conservative assessment of a ROI drawn within the septum on mid-cavity short axis (see Supplementary data online, Table S1).
Correlation analysis in the TTS cohort
| Variable | Septal native T1 | Septal T2 | T2 apicobasal gradient | Septal ECV |
|---|---|---|---|---|
| At hospital admission | ||||
| Age | −0.006 | −0.002 | −0.012 | −0.137 |
| Emotional trigger | 0.055 | −0.082 | 0.021 | −0.089 |
| Physical trigger | −0.083 | 0.003 | 0.186 | 0.239 |
| Angina | 0.110 | 0.276 | 0.002 | 0.258 |
| ST elevation (admission ECG) | 0.336 | 0.111 | 0.150 | 0.122 |
| T-wave inversion (admission ECG) | −0.178 | −0.276 | −0.118 | −0.191 |
| acute LVEF (echocardiography) | −0.403 | −0.333 | −0.392 | −0.157 |
| At CMR examination | ||||
| LVEF | −0.640a | −0.459a | −0.377 | −0.248 |
| RVEF | −0.241 | −0.188 | −0.182 | 0.097 |
| LV GLS | 0.484a | 0.245 | 0.421 | 0.088 |
| LV GCS | 0.547a | 0.366 | 0.309 | 0.167 |
| Septal native T1 | NA | 0.609a | 0.318 | 0.481a |
| Septal T2 | 0.609a | NA | 0.463a | 0.689a |
| T2 (apicobasal gradient) | 0.318 | 0.463a | NA | 0.416 |
| Septal ECV | 0.481a | 0.689a | 0.416 | NA |
| aVR (voltage) | −0.481a | −0.478a | −0.147 | −0.605a |
| T-wave inversion (voltage) | −0.102 | −0.044 | 0.499a | 0.125 |
| T-wave inversion (number of leads) | −0.225 | −0.111 | 0.426 | −0.083 |
| QTc length (msec) | 0.078 | −0.039 | 0.372 | 0.171 |
Takotsubo syndrome (TTS), left ventricle (LV), left ventricular ejection fraction (LVEF), right ventricular ejection fraction (RVEF), global longitudinal strain (GLS), global circumferential strain (GCS), extracellular volume (ECV), not applicable (NA).
denotes P < 0.01.
Regarding ECG parameters, the voltage of aVR had a significant, negative, correlation with septal native T1 (r = −0.481, P = 0.008), T2 (r = −0.478, P = 0.009), and ECV (r = −0.605, P = 0.001), but not with the apicobasal T2 mapping gradient. Numbers of leads with T-wave inversion, sum of voltages of negative T waves, and QTc length had significant, positive, correlation with apicobasal T2 mapping gradient, but not other tissue mapping measurements (r = 0.426 with P = 0.024, r = 0.499 with P = 0.007, and r = 0.372 with P = 0.047, respectively).
Discussion
We report CMR findings with T1 and T2 tissue mapping in patients hospitalized with TTS, describing systolic dysfunction, increased LV mass index, and presence of oedema—extending even beyond areas of abnormal wall motion—as compared with controls. Septal T2 mapping values, proxy of overall oedema burden, positively correlated with ECV as marker of interstitial expansion and inversely correlated with LV systolic function. Variable relationships were found between oedema and electrocardiographic changes: low QRS voltages in aVR associated with overall oedema burden, whereas repolarization abnormalities correlated with larger oedema gradient between the apex and the base of the LV, but not with other tissue mapping measurements.
Tissue characteristics
Endomyocardial biopsy (EMB) in acute TTS revealed a wide remodelling of the extracellular matrix (ECM), with increased amounts of fibronectin and collagen, that regresses after approximately 2 weeks.28 A further CMR study could not find a relationship between the extent of ECM remodelling and myocardial oedema: of note, this latter was assessed by using less recent T2-STIR sequences,29 with inherent limitations.8 The present study provides further evidence of the central role of myocardial oedema in TTS. Specifically, and in accordance with previous literature,9,10,13,30 we observed the marked rise of the water-specific imaging biomarker T2 mapping, along with the less specific but still water-sensitive native T1.31 In addition, ECV was increased as compared with controls that, when paired with the correlation observed between T2 and ECV in TTS patients (Figure 3, Panel C), indicates that myocardial oedema contributes to the interstitial volume expansion, as similarly described in acute myocarditis.32 Hence, ECV should not be considered as a water-independent measure in this context, its increase likely being influenced by concomitant extensive oedema in addition to the remodelling of the ECM. Finally, we found higher LV mass in TTS patients as compared with controls. A similar result has been recently described and attributed to a much higher amount of myocardial water content in acute TTS,33 that is, in keeping with the reduction of LV mass at follow-up described in the literature17,34 and observed in our population as well (Figure 4). On a larger scale, this phenomenon may resemble that of patients with end-stage renal disease undergoing replacement therapy, where dialysis leads to a reduction of myocardial water content associated with fluid removal35 with subsequent slight decrease in LV mass.36
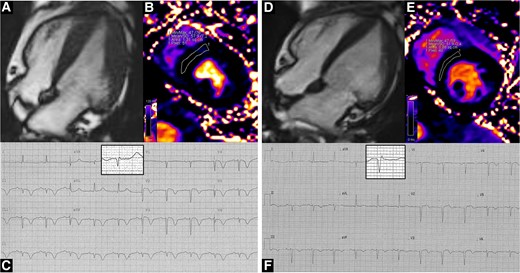
Representative case of a TTS patient in our cohort, who underwent serial CMR scans in the acute phase (left panels) and then at a 1-month follow-up (right panels). In the acute phase, concentric left ventricular hypertrophy is found (Panel A, end-diastolic frame from four-chamber cine images), accompanied by myocardial oedema (Panel B, 57.9 msec); the ECG shows diffuse T-wave inversion; aVR QRS complex has been magnified in the highlighted box (Panel C). At follow-up, left ventricular hypertrophy partly regresses (Panel D, end-diastolic frame from four-chamber cine images) and myocardial oedema ameliorates (Panel E, 51.9 msec); the ECG shows improvement of repolarization abnormalities (Panel F); aVR QRS voltage has increased (magnified in the highlighted box). Clips from cine images are available as supplementary material.
Left ventricular function
We reported a significant inverse correlation between oedema and systolic function. However, we cannot infer any cause–effect relationship between these two events. A single case report, with timely and serial CMR examinations, described oedema as not a primary phenomenon in TTS, since it developed only after LV wall motion abnormalities had been detected.37 On the other hand, it cannot be excluded that the wide myocardial oedema and interstitial expansion can directly contribute to LV stiffness and dysfunction,38 even after LVEF should recover. Overall, and irrespective of the underlying mechanisms, our data strengthen the potential role of myocardial oedema quantification in TTS as a marker of disease severity, delayed recovery, and prolonged clinical course.9
Tissue mapping, performed on septal values derived from the mid-short-axis slice (Figure 2), retained a similar association with parameters of LV function as compared with global assessment (see Supplementary data online, Table S1), indicating that this approach could be considered of choice when estimating the oedema burden in TTS. Indeed, the septal region is a key area in TTS, involved in the apical and mid-ballooning and in most of the less common focal variants which display an antero-septal pattern.39 The measurement of tissue mapping within the septal region on mid-short-axis slice grants higher reproducibility, and it is recommended by SCMR consensus documents.26,27 Notwithstanding, regional evaluation might provide some additional information. Interestingly, basal segments had preserved wall motion and circumferential strain, albeit higher T2 values as compared with controls. This finding is consistent with a myocardial involvement extending even beyond areas of wall motion abnormalities.13
Electrocardiographic changes
In patients with TTS electrocardiographic changes are highly prevalent on admission, then regressing during the clinical course at a variable rate with abnormalities detected beyond 1 year after the acute event in some cases.40 Though pathogenic mechanisms underlying these findings are not fully clarified, some studies postulated a role played by myocardial oedema in driving electrical abnormalities.15,16 We found a negative correlation between burden of oedema and voltage of aVR in our TTS population. This represents a mechanistic insight of a previously described association between acute TTS with low-QRS voltage at the surface ECG.16 QRS voltage depends on electrical properties of the myocardium as a whole, including the interstitium.41 In patients without clinical confounders affecting the ECG evaluation, a CMR study found negative correlation between ECV and QRS voltage, independently from left ventricular hypertrophy,42 that was explained with the influence of increased diffuse fibrosis on myocardial depolarization in individuals without acute illness. Based on these data, we hypothesize that in TTS the oedema-driven reversible interstitial expansion, on top of the ECM remodelling, conditions a transient attenuation of QRS voltages in a similar fashion.
In our sample, we did not find any relevant association between oedema burden (septal T2) and repolarization abnormalities on ECG. On the other hand, a larger difference in T2 values between the apex and the base of the LV, signifying a higher oedema dispersion and gradient, associated with more pronounced T-wave inversion and longer QTc interval. These results replicate those described in TTS by using CMR T2-STIR sequences,15 supporting the role of the apicobasal gradient of myocardial oedema in driving changes of ECG repolarization. Overall, the association of CMR with ECG findings strengthens the efficacy of the latter, significantly cheaper and easier to perform, as a tool for the long-term longitudinal monitoring of patients with TTS in which, despite recovery of LVEF, morphological and functional abnormalities can persist.
Limitations
Though providing a comprehensive diagnostic evaluation, the present study is limited by a relatively small sample size. Consistently with our previously reported data,20,21 this centre population is characterized by low-risk features, such as higher preponderance of emotional triggers and low rate of in-hospital complications, that might limit the generalizability of our findings; given the low number of in-hospital events and mortality at follow-up, larger studies are needed to properly assess the prognostic relevance of CMR tissue mapping assessment in TTS. The use of mapping techniques informs on the underlying pathologic processes at tissue level, however, the need for standardized setup for imaging and development of normal values,43 as well as methodological variations between centres, may limit the immediate transferability and generalizability of the quantitative values here reported. A longitudinal evaluation of ECG and CMR during hospitalization and follow-up could further support the existence of a causative link between myocardial tissue changes and electric abnormalities; however, such an assessment was beyond the scope of the present study.
Conclusions
Myocardial oedema is largely represented in the acute phase of TTS and contributes to interstitial expansion. CMR T1 and T2 mapping techniques are sensible tools that can identify and quantify myocardial oedema even outside areas of abnormal wall motion. The association of myocardial oedema with mechanical abnormalities and electrocardiographic changes makes it a potential prognostic marker and therapeutic target in TTS.
Supplementary data
Supplementary data is available at European Heart Journal—Cardiovascular Imaging online.
Funding
None.
Data availability
The data underlying this article will be shared on reasonable request to the corresponding author.
References
Author notes
Conflict of interest: None declared
