


Abstract
Heart disease is associated with an increased risk for ischaemic stroke. However, the predictive value of reduced left ventricular ejection fraction (LVEF) for stroke is controversial and only observed in patients with severe reduction. LV global longitudinal strain (LV GLS) can detect subclinical LV systolic impairment when LVEF is normal. We investigated the prognostic role of LV GLS for incident stroke in a predominantly elderly cohort.
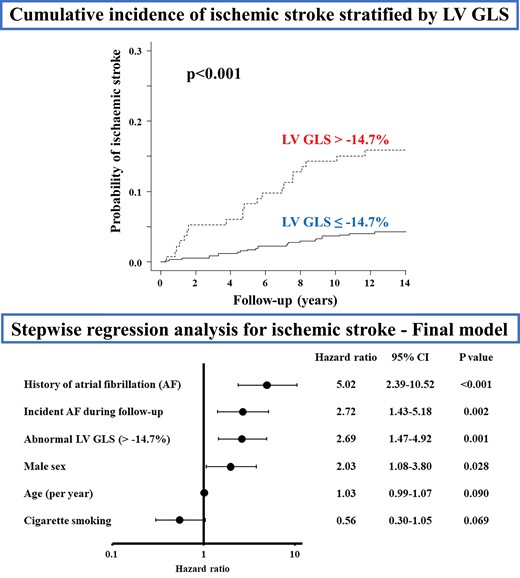
Two-dimensional echocardiography with speckle tracking was performed in the Cardiac Abnormalities and Brain Lesions (CABL) study. Among 708 stroke-free participants (mean age 71.4 ± 9.4 years, 60.9% women), abnormal LV GLS (>−14.7%: 95% percentile of the subgroup without risk factors) was detected in 133 (18.8%). During a mean follow-up of 10.8 ± 3.9 years, 47 participants (6.6%) experienced an ischaemic stroke (26 cardioembolic or cryptogenic, 21 other subtypes). The cumulative incidence of ischaemic stroke was significantly higher in participants with abnormal LV GLS than with normal LV GLS (P < 0.001). In multivariate stepwise logistic regression analysis, abnormal LV GLS was associated with ischaemic stroke independently of cardiovascular risk factors including LVEF, LV mass, left atrial volume, subclinical cerebrovascular disease at baseline, and incident atrial fibrillation [hazard ratio (HR): 2.69, 95% confidence interval (CI): 1.47–4.92; P = 0.001]. Abnormal LV GLS independently predicted cardioembolic or cryptogenic stroke (adjusted HR: 3.57, 95% CI: 1.51–8.43; P = 0.004) but not other subtypes.
LV GLS was a strong independent predictor of ischaemic stroke in a predominantly elderly stroke-free cohort. Our findings provide insights into the brain–heart interaction and may help improve stroke primary prevention strategies.
Introduction
Stroke is a global health issue with a prevalence exceeding 100 million people worldwide; approximately one in four adults will experience a stroke during their lifetime.1,2 Although substantial progress has been made in the treatment of the acute phase, stroke frequently causes long-term disability2 and increases the risk of dementia,3 both conditions that demand considerable healthcare resources. Hence, an area of particular interest has been the identification of individuals at high risk of stroke at an early stage, as this might allow the implementation of early preventive strategies. Stroke, especially the more common ischaemic type, has been shown to be closely associated with cardiac disease. Atrial fibrillation (AF), advanced heart failure (HF), and certain valve diseases (for example, valve vegetations or mitral stenosis) or intracardiac masses (tumours; thrombus) have been recognized as important sources of cerebral embolism.4–8 Other cardiac conditions, such as left ventricular (LV) hypertrophy and abnormal geometry,9,10 have been shown to be strong indicators for stroke risk even without possessing obvious embolic potential; this may be secondary to their being manifestations of the effect of risk factors and pathophysiological mechanisms that affect both the brain and heart.5 LV ejection fraction (LVEF) is the most extensively studied indicator of LV systolic function; however, the association between reduced LVEF and ischaemic stroke remains controversial,6,7,11 as it has been observed in patients with severe LVEF reduction,6,7 but not for mild or moderate reduction. Furthermore, only 10–24% of participants who develop stroke have reduced LVEF.5,12 LV global longitudinal strain (LV GLS) assessed by speckle-tracking echocardiography has emerged as a novel tool to detect subtle myocardial systolic abnormalities with excellent feasibility and reproducibility, even when LVEF is within the normal range.13,14 LV GLS is correlated with interstitial myocardial fibrosis15 and can predict adverse outcomes, independently of LVEF, in patients with HF,13,16 myocardial infarction,17 and valvular diseases.14 In the TOPCAT (Treatment of Preserved Cardiac Function Heart Failure With an Aldosterone Antagonist) trial, LV GLS was an independent predictor of cardiovascular death and HF hospitalization.13 In addition, several population-based studies have reported on the predictive value of LV GLS for cardiac events;18,19 however, limited data are available regarding a possible independent association between LV GLS and incident stroke, as studies that have explored this possibility included stroke in a combined vascular outcome20,21 rather than focusing on it as a separate outcome. We previously demonstrated that LV GLS reduction was associated with the presence of subclinical brain infarcts (SBIs), which are frequent on neurovascular imaging in the elderly and are an established risk factor for future symptomatic stroke, suggesting that LV GLS might be an early indicator of cerebrovascular disease.22 We thus hypothesized that subclinical LV dysfunction assessed by LV GLS might predict the long-term risk of ischaemic stroke. The present study aimed to investigate the prognostic value for an incident stroke of subclinical LV dysfunction in a predominantly elderly community-based cohort without a history of stroke.
Methods
Study population
The Cardiovascular Abnormalities and Brain Lesions (CABL) study is a community-based epidemiological study conducted to investigate the cardiovascular predictors of subclinical cerebrovascular disease in the community. CABL based its recruitment on the Northern Manhattan Study (NOMAS), a prospective population-based cohort that enrolled from the residents of northern Manhattan between 1993 and 2001. The study design and recruitment details of NOMAS have been described previously.23 In brief, individuals who were ≥50 years old, had no previous diagnosis of stroke, and had no contraindications to magnetic resonance imaging (MRI) were invited to participate in a brain MRI sub-study from 2003. Baseline demographics and clinical risk factors were assessed at the time of study enrolment. From September 2005 to July 2010, NOMAS MRI participants who voluntarily agreed to undergo a more extensive cardiovascular evaluation including transthoracic echocardiography were included in the CABL study. Of 1004 participants who were initially enrolled in CABL, 854 participants had digitally acquired echocardiographic data available and underwent speckle-tracking analysis. The time of performance of the echocardiographic study, which in most cases corresponded to the time of brain MRI (median interval: 4 days), was the baseline time for all analyses. Participants having either history of stroke or myocardial infarction prior to the initiation of the CABL study (N = 21), or suboptimal echocardiographic image quality or missing images for LV GLS determination (N = 125) were excluded. Hence, the final study population consisted of 708 stroke-free participants (Figure 1). Written informed consent was obtained from all study participants. The study was approved by the Institutional Review Boards of Columbia University Medical Center and of the University of Miami.
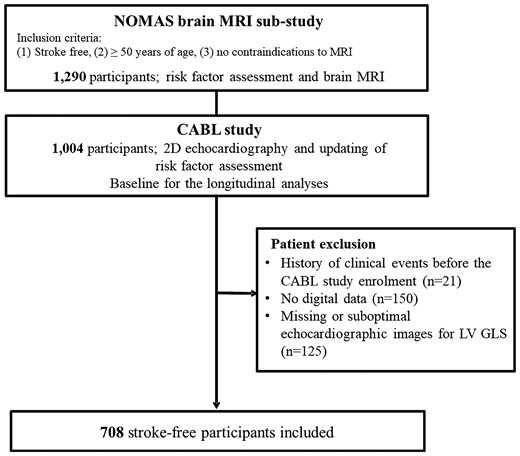
Study flow chart.
Risk factor assessment
Cardiovascular risk factors were ascertained through direct examination and interviews conducted by trained research assistants. Hypertension was defined as systolic BP ≥140 mmHg or diastolic BP (DBP) ≥90 mmHg or use of anti-hypertensive medication.2 Diabetes mellitus was defined as a fasting glucose ≥126 mg/dL or the use of antidiabetic drugs.2 Hypercholesterolaemia was defined as total serum cholesterol >240 mg/dL or use of lipid-lowering medications.2 Smoking status was defined as a history of cigarette smoking at any time in the past or present. Coronary artery disease was defined as a history of myocardial infarction, coronary artery bypass grafting, or percutaneous coronary intervention. AF was ascertained by way of an electrocardiogram performed at the time of echocardiography or from self-reported history. The race–ethnicity classification was based on self-identification and categorized as Hispanic, non-Hispanic Black, non-Hispanic white, or other.
Echocardiographic examination
Standard 2D echocardiography
Transthoracic echocardiograms were acquired using a commercially available system (iE 33, Philips, Andover, MA, USA) by an experienced cardiac sonographer blinded to the participant’s clinical information, following a standardized protocol. The dimensions of the cardiac chambers were measured according to the recommendations of the American Society of Echocardiography.24 LVEF was calculated using the modified biplane Simpson’s rule. LV mass was calculated with a validated method and indexed for body surface area.25 Peak early velocities and mitral annular velocities were obtained and adopted as LV diastolic function indexes according to the current guideline.26 Left atrial (LA) volume was measured by 3D echocardiography as previously described.27 LA minimum and maximum volumes were measured and indexed for body surface area. Mitral E/e′ ratio was measured as another index of LV diastolic function.
Speckle-tracking echocardiography
Speckle-tracking analysis was performed offline using commercially available software (Philips QLAB Advanced Quantification Software version 8.1) as previously described.22 Briefly, analysis of LV myocardial deformation over the longitudinal axis was performed from 2D grey-scale loops by automatic tracking of myocardial speckles after manual selection of landmark points. LV GLS was calculated by averaging the negative peak of longitudinal strain from the apical four- and two-chamber views. At least two cardiac cycles were recorded at a frame rate ≥45 fps and were averaged for strain analysis. Aortic valve opening and closing times were measured from the LV outflow Doppler profile and were incorporated in the speckle-tracking strain profile to exclude post-systolic components. According to the definition of strain, negative strain denotes systolic shortening of the LV, therefore smaller absolute strain values of GLS (i.e. less negative values) correspond to worse cardiac function. Abnormal LV GLS was defined as a GLS lower than the 95th percentile of the GLS distribution in a healthy subgroup of CABL participants free of hypertension, diabetes mellitus, coronary artery disease, arrhythmias, and with body mass index ≤25 kg/m2, corresponding to a GLS >−14.7%.20 Interobserver reproducibility of GLS measurement was assessed in a random sample of 20 study participants. The intraclass correlation coefficient for GLS was 0.85. The mean difference between measurements was 0.08 ± 2.4%, and the coefficient of variation (SD/mean) was 0.09.
Brain MRI
A detailed description of the assessment of subclinical cerebrovascular lesions has been published previously.28 Brain imaging was performed on a 1.5 T MRI system (Philips Medical Systems). SBIs were rated by two neurologists and defined as either cavitation on the fluid-attenuated inversion recovery sequence of at least 3 mm in size, distinct from a vessel (owing to the lack of signal void on T2 sequence), and of equal intensity to cerebrospinal fluid in the case of lacunar infarction, or as a wedge-shaped cortical or cerebellar area of encephalomalacia with surrounding gliosis consistent with infarction attributable to distal arterial branch occlusion. Interobserver agreement for SBI detection was 93.3%.28 White matter hyperintensity (WMH) analysis was based on a fluid-attenuated inversion recovery image and performed by using the Quantum 6.2 package on a Sun Microsystems Ultra 5 workstation. WMH volume (WMHV) was expressed as a proportion of total cranial volume to correct for differences in head size. All measurements were performed blinded to participant identification and clinical information.
Outcomes
Follow-up of participants was conducted by annual telephone interviews. Any vascular event or acknowledgement of neurological or cardiac symptoms during the standardized interview triggered an in-person assessment. In addition, active hospital surveillance of admission and discharge ICD-9 codes was performed. Stroke was defined by the first symptomatic occurrence of ischaemic stroke defined by the TOAST (Trial of ORG 10172 in Acute Stroke Treatment) criteria.29 Two neurologists diagnosed stroke independently and disagreements were adjudicated by the NOMAS principal investigators. New-onset AF was ascertained through a questionnaire by trained research assistants, then confirmed by analysis of electrocardiograms or available medical records and hospital admissions.
Statistical analysis
Categorical variables are presented as numbers and percentages and were compared using χ2 tests. Continuous variables are expressed as mean ± standard deviation or median (interquartile range) and were compared using the t-test or Wilcoxon rank-sum test as appropriate. Cause-specific competing risk models were used to assess the association of GLS with ischaemic stroke and cause-specific hazard ratios (HRs) and 95% confidence intervals (CIs) were calculated. Death was treated as a competing risk. Stepwise logistic regression analysis was performed to assess independent predictors of stroke. Parameters included in the stepwise variable selection were those with a P-value of <0.2 in univariate analysis and P-value for entry and stay was set to be 0.2. Cumulative incidence plots were used to evaluate cumulative stroke incidence in different LV GLS groups with death from any causes other than stroke as a competing event. A P-value of <0.05 was considered statistically significant. All statistical analyses were performed using SAS software version 9.4 (SAS Institute Inc., Cary, NC, USA).
Results
Study population
Baseline demographics and clinical characteristics of the study population are summarized in Table 1. The mean age was 71.4 ± 9.4 years; 60.9% were women. Participants with abnormal LV GLS were older and had a higher prevalence of hypertension, diabetes, and hypercholesterolaemia. Echocardiographic parameters are shown in Table 2. Only eight participants (1.1%) had LVEF <40%, and no LV thrombus was detected in any participants.
Clinical characteristics of the study population
| All (N = 708) | Normal LV GLS (N = 575) | Abnormal LV GLS (N = 133) | P-value | |
|---|---|---|---|---|
| Age, years | 71.4 ± 9.4 | 70.8 ± 9.4 | 73.7 ± 9.3 | 0.002 |
| Male sex, n (%) | 277 (39.1) | 218 (37.9) | 59 (44.4) | 0.170 |
| Race–ethnicity | 0.053 | |||
| ȃWhite, n (%) | 99 (14.0) | 81 (14.1) | 18 (13.5) | |
| ȃBlack, n (%) | 119 (16.8) | 86 (15.0) | 33 (24.8) | |
| ȃHispanic, n (%) | 476 (67.2) | 396 (68.9) | 80 (60.2) | |
| ȃOther, n (%) | 14 (2.0) | 12 (2.1) | 2 (1.5) | |
| Body mass index, kg/m2 | 27.8 ± 4.6 | 27.6 ± 4.7 | 28.4 ± 4.4 | 0.067 |
| Systolic blood pressure, mmHg | 135.2 ± 16.7 | 134.2 ± 16.7 | 139.6 ± 16.3 | <0.001 |
| Diastolic blood pressure, mmHg | 78.2 ± 9.4 | 77.6 ± 9.1 | 80.8 ± 10.2 | <0.001 |
| Hypertension, n (%) | 548 (77.4) | 428 (74.4) | 120 (90.2) | <0.001 |
| Anti-hypertensive treatment, n (%) | 495 (69.9) | 387 (67.3) | 108 (81.2) | 0.002 |
| Diabetes mellitus, n (%) | 198 (28.0) | 143 (24.9) | 55 (41.4) | <0.001 |
| Hypercholesterolaemia, n (%) | 463 (65.4) | 366 (63.7) | 97 (72.9) | 0.043 |
| Statin use, n (%) | 343 (48.5) | 273 (47.5%) | 70 (52.6%) | 0.284 |
| Cigarette smoking history, n (%) | 374 (52.8) | 308 (53.6) | 66 (49.6) | 0.412 |
| Heart rate, beats/min | 69.7 ± 11.3 | 69.0 ± 10.8 | 72.5 ± 12.7 | 0.004 |
| Coronary artery disease, n (%) | 35 (4.9) | 26 (4.5) | 9 (6.8) | 0.282 |
| History of atrial fibrillation, n (%) | 41 (5.8) | 24 (4.2) | 17 (12.8) | <0.001 |
| Aspirin use, n (%) | 442 (62.4) | 357 (62.1) | 85 (63.9) | 0.696 |
| Brain MRI | ||||
| ȃSBI, n (%) | 89 (13.3) | 59 (10.8) | 30 (24.0) | <0.001 |
| ȃWMHV/total cranial volume, % | 0.34 (0.20–0.69) | 0.31 (0.18–0.62) | 0.57 (0.30–1.10) | <0.001 |
Values are mean ± standard deviation, n (percentage), or median (25th–75th percentile).
MRI, magnetic resonance imaging; SBI, subclinical brain infarct; WMHV, white matter hyperintensity volume.
Echocardiographic parameters of the study population
| All (N = 708) | Normal LV GLS (N = 575) | Abnormal LV GLS (N = 133) | P-value | |
|---|---|---|---|---|
| LV septal thickness, mm | 11.3 ± 1.7 | 11.2 ± 1.7 | 12.2 ± 1.7 | <0.001 |
| LV end-diastolic diameter index, mm/m2 | 25.6 ± 3.0 | 25.5 ± 2.9 | 25.6 ± 3.5 | 0.814 |
| LV posterior wall thickness, mm | 11.1 ± 1.5 | 10.9 ± 1.5 | 11.8 ± 1.6 | <0.001 |
| LV mass index, g/m2 | 102.7 ± 25.3 | 99.9 ± 23.9 | 114.5 ± 27.6 | <0.001 |
| LVEF, % | 63.1 ± 7.4 | 63.9 ± 5.7 | 59.4 ± 11.7 | <0.001 |
| LV GLS, % | −17.1 ± 3.2 | −18.1 ± 2.3 | −12.5 ± 2.1 | <0.001 |
| LA maximum volume index, mL/m2 | 24.6 ± 7.9 | 24.4 ± 7.6 | 25.5 ± 9.2 | 0.267 |
| LA minimum volume index, mL/m2 | 13.9 ± 6.8 | 13.2 ± 5.9 | 17.1 ± 9.5 | <0.001 |
| E/e′ | 10.2 ± 3.3 | 10.0 ± 3.1 | 11.1 ± 3.7 | 0.001 |
Values are mean ± standard deviation or n (percentage).
E, early diastolic transmitral flow velocity; e′, early diastolic mitral annular velocity; EF, ejection fraction; GLS, global longitudinal strain; LA, left atrium; LV, left ventricle.
Association with ischaemic stroke
During a mean follow-up of 10.8 ± 3.9 years, 47 participants (6.6%) experienced a first ischaemic stroke, of which 18 were cardioembolic, 8 cryptogenic, 5 atherosclerotic, 8 lacunar, and 8 were other stroke mechanisms. During the follow-up period, 83 participants (11.7%) developed new-onset AF. Table 3 shows the univariate Cox proportional hazards regression analyses for incident stroke associated with demographics, cardiovascular risk factors, and imaging variables. Age, Hispanic ethnicity, history of AF, incident AF during follow-up, lower LVEF, worse LV GLS, greater LV mass index, and larger LA minimum volume index were associated with stroke risk (all P < 0.05). Figure 2 displays the cumulative stroke incidence curves by the LV GLS group. The cumulative incidence of stroke was significantly higher in participants with abnormal LV GLS than in those with normal LV GLS (P < 0.001). To evaluate the independent association of LV GLS with ischaemic stroke accounting for potential covariates, we performed a stepwise logistic regression analysis. Abnormal LV GLS was significantly associated with ischaemic stroke independent of traditional stroke risk factors, LA and LV morphology, subclinical cerebrovascular disease at baseline and even incident sustained AF (HR: 2.69, 95% CI: 1.47–4.92; P = 0.001; Figure 3).
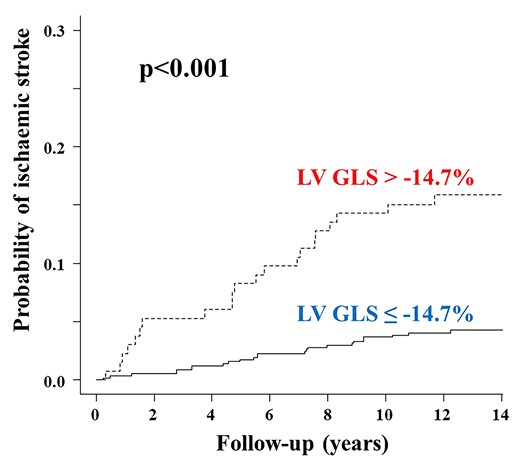
Cumulative ischaemic stroke incidence in participants with normal and abnormal LV GLS. Death from any causes other than stroke was considered as a competing event. GLS, global longitudinal strain; LV, left ventricular.
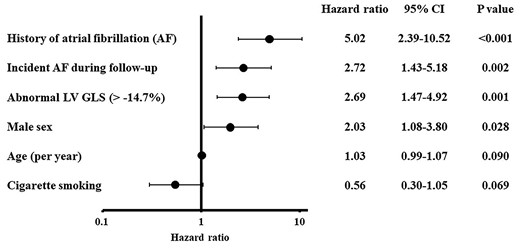
Stroke predictors by stepwise regression analysis—final model. Parameters included in the stepwise variable selection were those with P-value <0.2 in univariate analysis, and P-value for entry and stay was set to be 0.2. GLS, global longitudinal strain; LV, left ventricle.
Unadjusted hazard ratios for incident ischaemic stroke of demographics, stroke risk factors, and echocardiographic parameters
| Hazard ratio (95% CI) | P-value | |
|---|---|---|
| Age, years | 1.05 (1.02–1.09) | 0.001 |
| Male sex | 1.74 (0.98–3.08) | 0.058 |
| Race–ethnicitya | ||
| ȃWhite | Reference | |
| ȃBlack | 0.81 (0.34–1.91) | 0.627 |
| ȃHispanic | 0.44 (0.22–0.90) | 0.024 |
| Body mass index, kg/m2 | 1.00 (0.94–1.06) | 0.919 |
| Systolic BP, mmHg | 1.01 (0.99–1.03) | 0.149 |
| Diastolic BP, mmHg | 0.99 (0.96–1.02) | 0.408 |
| Hypertension | 1.54 (0.72–3.29) | 0.270 |
| Anti-hypertensive treatment | 1.96 (0.95–4.06) | 0.069 |
| Diabetes mellitus | 0.84 (0.43–1.64) | 0.605 |
| Hypercholesterolaemia | 1.53 (0.79–2.94) | 0.206 |
| Statin use | 1.47 (0.83–2.62) | 0.191 |
| Cigarette smoking history | 0.67 (0.38–1.20) | 0.176 |
| Heart rate, beats/min | 0.99 (0.96–1.01) | 0.346 |
| Coronary artery disease | 0.97 (0.23–3.98) | 0.961 |
| History of AF | 8.38 (4.23–16.57) | <0.001 |
| Incident AF during follow-up | 4.85 (2.65–8.89) | <0.001 |
| Aspirin use | 1.36 (0.75–2.51) | 0.326 |
| LVEDD index, mm/m2 | 0.95 (0.86–1.06) | 0.371 |
| LV mass index, g/m2 | 1.02 (1.01–1.03) | 0.003 |
| LVEF, % | 0.95 (0.93–0.98) | <0.001 |
| GLS, % | 1.19 (1.09–1.30) | <0.001 |
| LA maximum volume index, mL/m2 | 1.03 (0.99–1.07) | 0.092 |
| LA minimum volume index, mL/m2 | 1.06 (1.03–1.10) | <0.001 |
| E/e′ | 1.02 (0.94–1.12) | 0.608 |
| SBI | 1.51 (0.70–3.23) | 0.290 |
| WMHV4b | 1.73 (0.94–3.20) | 0.081 |
AF, atrial fibrillation; BP, blood pressure; E, early diastolic transmitral flow velocity; e′, early diastolic mitral annular velocity; EDD, end-diastolic dimension; EF, ejection fraction; GLS, global longitudinal strain; LA, left atrial; LV, left ventricle; SBI, subclinical brain infarct; WMHV4, upper quartile of white matter hyperintensity volume.
Participants of race–ethnicity other than white, black, and Hispanic were too few to allow a separate analysis.
Versus the other three quartiles combined.
In an additional exploratory analysis, we looked at whether the association between LV GLS and ischaemic stroke was stronger in subtypes with potential cardioembolic origin (cardioembolic plus cryptogenic subtypes; N = 26) than in other subtypes (atherosclerotic, lacunar, or other mechanisms; N = 21). In stepwise logistic regression analysis adjusted for demographics, stroke risk factors, including history of AF, echocardiographic variables, and incident of AF, LV GLS reduction was independently associated with cardioembolic/cryptogenic stroke (HR: 3.57, 95% CI: 1.51–8.43; P = 0.004). No association was seen between reduced LV GLS and other stroke subtypes combined (HR: 1.61, 95% CI: 0.59–4.40; P = 0.354).
Discussion
In this study, we evaluated the predictive value for the incident first ischaemic stroke of subclinical LV systolic dysfunction, detected by speckle-tracking echocardiography, during a follow-up of over 10 years. Abnormal LV GLS was a strong predictor of ischaemic stroke in this predominantly elderly cohort, and the association was independent of established stroke risk factors and pertinent echocardiographic variables such as LA volume and LVEF. Furthermore, the presence of abnormal LV GLS significantly increased the risk of stroke even after adjustments for incident AF and was observed only in stroke subtypes of more likely cardioembolic aetiology.
LV dysfunction and stroke
Several studies have shown an association between cardiac dysfunction and stroke. In patients with HF, the risk of ischaemic stroke is ∼2–3 times higher than in patients without HF; once HF and stroke coexist, the prognosis is worse than that of either condition alone.4,5 LVEF is the most commonly used indicator of LV systolic function in clinical practice and has been shown to be inversely related to incident ischaemic stroke in patients with advanced HF.6,7 However, the association was observed only for severely reduced LVEF (<15%).6,7 A possible explanation might be that severely reduced LVEF has a strong potential for LV thrombus formation and consequent cerebral embolism, while milder LVEF reductions may not share this purported stroke mechanism and therefore be a weaker indicator for future stroke risk. Speckle-tracking echocardiography is emerging as an important technique to detect subclinical LV dysfunction at a time when LVEF may still be normal. LV GLS represents the contraction of the longitudinal myofibres of the ventricle, which are predominantly located in the subendocardial region and are therefore more susceptible to pressure overload and myocardial ischaemia. LV GLS diagnostic and prognostic values are superior to those of LVEF in multiple cardiac diseases.14,16 In a study involving 4172 patients with acute HF, LV GLS was an independent predictor of 5-year mortality, whereas LVEF was not, and its prognostic value remained significant even in patients with mid-range or preserved LVEF.16 Extrapolation from these prior studies suggests that LV GLS might act as an indicator of risk rather than a direct cause of unfavourable outcomes in individuals with preserved LVEF. Recent population-based studies also explored the prognostic role of LV GLS; however, most of these studies focused on cardiac diseases such as HF and myocardial infarction as an outcome, while the risk of stroke received less attention.19,21 Kuznetsova et al.21 showed that impaired LV GLS predicted cardiovascular events including stroke during a median follow-up of 7.9 years, but the stroke was prespecified only as one component of the composite endpoint. In the present report, we demonstrate that subclinical LV dysfunction by GLS is a strong independent predictor of incident stroke in the general population. It is noteworthy that the association between LV GLS and ischaemic stroke persisted even after adjustment for indicators of LV and LA structural remodelling; also, it was independent of incident AF. AF is a significant risk factor for stroke,4,8 however, paroxysmal AF is often asymptomatic and remains difficult to diagnose before the development of stroke.8 LV hypertrophy is also an independent stroke risk factor;10 our study suggests that GLS may allow detection of individuals at increased risk of stroke at an early stage, before LV morphological changes or sustained AF are apparent.
The mechanism underlying the association between abnormal LV GLS and stroke is unclear. One possible explanation is that impaired LV GLS might be a marker of the overall effect of multiple vascular risk factors, which may also contribute to cerebrovascular atherosclerosis.30,31 This hypothesis is supported by recent literature showing a clear association of impaired LV GLS with increased carotid intima-media thickness, an established marker of atherosclerosis and a predictor of cerebrovascular events,32 and also an association between impaired GLS and decreased cerebral blood flow in the elderly.33 Indeed, participants with abnormal LV GLS had higher frequencies of traditional cardiovascular risk factors than those with normal LV GLS in our population. Although hypertension plays an important role in the pathophysiology of stroke, both office BP and diagnosis of hypertension were not associated with stroke incidence in our cohort, a finding that is consistent with the results of the SPRINT (Systolic Blood Pressure Intervention Trial) study showing that intensive BP control did not reduce the stroke incidence.34 This may be partially explained by the fact that, in older adults in whom multiple cardiovascular risks often coexist and interact, a single vascular risk factor may no longer separately contribute to the risk prediction. Another possibility is that reduced LV GLS might represent a time-integrated indicator of exposure to hypertension. A subclinical reduction in cerebral blood flow might represent another potential mechanism for LV GLS-related stroke risk. Alternatively, LV GLS might be an indicator of the presence of LA myopathy, which may be related to endothelial dysfunction and hypercoagulability and has been considered a potential source of cardioembolic strokes regardless of AF presence.35,36 We previously showed that LV longitudinal function modulated LA function through the downward motion of the LV base in systole, and that reduced LV GLS was significantly associated with worse LA function.27 In addition, we previously reported on the independent association between impaired LV GLS and AF development over time;18 although in the present study, the predictive power for the stroke of an impaired LV GLS was independent of incident AF, the possibility that undetected episodes of paroxysmal AF may play a role in the relationship between impaired LV GLS and increased stroke risk cannot be excluded. In fact, abnormal LV GLS has been shown to be associated with impaired LA reservoir function,37,38 which is in turn associated with paroxysmal AF.39 Finally, an imbalance in the autonomic nervous system may also be implicated in the pathogenesis of both subclinical LV dysfunction and increased stroke risk.40,41
Although normal values of LV GLS have been shown to range from −15.9 to −22.1%,42 most prior studies included significantly younger cohorts than ours. LV GLS has been reported to decline with age.43,44 Therefore, we used an internally obtained cut-off value (−14.7%), which is similar to that reported in a cohort of similar age. In the Framingham study, the 97.5th percentile of GLS in a normal healthy population was −14.4% in people >75 years, and −15.3% in women and −14.7% in men among 65–74 years old; those values were consistent with our cut-off, which has also been reported on before.44 Further studies may be warranted to establish the normal values of LV GLS in the elderly to distinguish more accurately changes secondary to aging from those related to the disease.
Subclinical cerebrovascular disease is frequently detected as an incidental finding on brain imaging in the elderly and is associated with an increased risk for future stroke.45 We previously reported that impaired LV GLS was independently associated with the subclinical cerebrovascular disease;22 the present study extends the observation to the clinical domain, also showing an increased stroke risk associated with impaired LV GLS independent of the presence of subclinical cerebrovascular disease at baseline; this observation suggests that LV GLS may indeed be a unique early predictor of stroke risk regardless of the presence of subclinical cerebrovascular disease.
Clinical implication
Despite advances in stroke prevention strategies in past decades, the lifetime risk of stroke remains high, requiring a novel approach for identifying high-risk individuals at an early stage. Our study highlights the clinical importance of evaluating LV GLS at an asymptomatic stage to identify high-risk individuals. LV GLS can currently be measured by fully automated image analysis,46 which offers the advantage to reduce intra- and interobserver variability and facilitates its clinical use. Speckle-tracking echocardiography, therefore, appears to be a promising tool for characterizing the risk of stroke at a population level and may improve primary prevention strategies, allowing to focus on subjects who may benefit from earlier risk factor modification strategies. Future studies are needed to determine the incremental value of LV GLS for stroke prediction when added to current risk prediction tools.
Strengths and limitations
The strengths of the present study are a relatively large population-based multiethnic cohort with long-term follow-up, evaluated with multimodality imaging including speckle-tracking echocardiography, and the inclusion in the analyses of the most pertinent potential confounders including cardiac morphology and incident AF. However, our study has several limitations. First, it included mostly older individuals, making the possibility of extending the results to younger adults questionable. However, the incidence of stroke increases with age, and therefore our study population represents an ideal setting for these analyses. Second, our study cohort had a large representation of Hispanics, which might limit the generalizability of the results to populations with different race–ethnic compositions. Third, although we controlled for pertinent covariates, other unmeasured factors may have played a role in the observed associations. Finally, the possibility that undiagnosed, possibly asymptomatic episodes of paroxysmal AF may be involved in the association between abnormal LV GLS and stroke cannot be excluded, given the absence of prolonged monitoring of the cardiac rhythm; however, the results of the study are not aimed at establishing a reduced LV GLS as a source of stroke, but rather at evaluating its role as an independent early predictor of stroke risk regardless of the actual stroke mechanism involved, which may well include a role for undiagnosed AF.
Conclusion
Subclinical LV systolic dysfunction by LV GLS is a strong predictor of incident ischaemic stroke in the elderly. This association is independent of established vascular risk factors, LA and LV morphology, and even incident sustained AF and subclinical cerebrovascular disease. An assessment of LV GLS may allow an early identification of individuals at a high risk of stroke who may benefit from primary prevention. Further studies exploring the potential incremental value of the inclusion of LV GLS into current stroke risk prediction tools in broadly representative populations are warranted.
Authors’ contributions
Y.Y. and M.R.D.T. contributed to the conception or design of the work. Z.J., C.R., S.H., M.S.V.E., T.R., M.Y., C.D., C.B.W., and R.L.S. contributed to the acquisition, analysis, or interpretation of data for the work. Y.Y. drafted the manuscript. Z.J., C.R., S.H., K.N., K.I., C.M., M.S.V.E., T.R., M.Y., C.D., C.B.W., R.L.S., and M.R.D.T. critically revised the manuscript. All authors gave final approval and agreed to be accountable for all aspects of the work, thus ensuring integrity and accuracy.
Acknowledgements
The authors wish to thank Janet De Rosa, MPH, Project Manager, and Rui Liu, MD, Clinical Research Coordinator, for their work of collecting the data.
Funding
This work was supported by grants from the National Institute of Neurological Disorders and Stroke (grants R01 NS36286 to M.R.D.T. and R37 NS29993 to R.L.S. and M.S.V.E.).
Data availability
The data underlying this article will be shared on reasonable request to the corresponding author.
References
Author notes
Conflict of interest: None declared.
