


Abstract
To evaluate whether cardiac magnetic resonance (CMR)-based parametric mapping and strain analysis can improve the risk-stratification for ventricular arrhythmias (VA) and sudden death (SD) in non-ischaemic cardiomyopathy (NICM).
Secondary analysis of a prospective single-centre-registry (NCT02326324), including 703 consecutive NICM patients, 618 with extracellular volume (ECV) available. The combined primary endpoint included appropriate implantable cardioverter defibrillator therapies, sustained ventricular tachycardia, resuscitated cardiac arrest and SD. During a median follow-up of 21 months, 14 patients (2%) experienced the primary endpoint. Native T1 was not associated with the primary endpoint. Left ventricular global longitudinal strain lost its significant association after adjustment for left ventricular ejection fraction (LVEF). Among patients with ECV available, 11 (2%) reached the primary endpoint. Mean ECV was significantly associated with the primary endpoint and the best cut-off was 30%. ECV ≥ 30% was the strongest independent predictor of the primary endpoint (hazard ratio 14.1, P = 0.01) after adjustment for late gadolinium enhancement (LGE) and LVEF. ECV ≥ 30% discriminated the arrhythmic risk among LGE+ cases and among those with LVEF ≤ 35%. A simple clinical risk-stratification model, based on LGE, LVEF ≤ 35% and ECV ≥ 30%, achieved an excellent predictive ability (Harrell’s C 0.82) and reclassified the risk of 32% of the study population as compared to LVEF ≤ 35% alone.
Comprehensive CMR evaluation in NICM showed that ECV was the only parameter with an independent and strong predictive value for VA/SD, on top of LGE and LVEF. A risk-stratification model based on LGE, LVEF ≤ 35% and ECV ≥ 30% achieved an excellent predictive ability for VA/SD.
UHSM CMR study (NCT02326324) https://clinicaltrials.gov/ct2/show/NCT02326324.
Introduction
Risk-stratification for ventricular arrhythmias (VA) and sudden death (SD) in non-ischaemic cardiomyopathy (NICM) poses significant challenges. The inability to select a true high-risk sub-group translates into the negative results of primary prevention implantable cardioverter defibrillator (ICD) trials.1
A large body of evidence supports the role of late gadolinium enhancement (LGE) as an independent and strong predictor of VA and SD in NICM, and risk-stratification algorithms including LGE have shown superior predictive ability than the currently used criterion of left ventricular ejection fraction (LVEF) ≤35%.2,3
Several reports suggested that cardiac magnetic resonance (CMR) based parametric mapping4–7 and strain analysis8 may provide important prognostic information in NICM. However, those studies usually focused on combined endpoints where VA and SD, if included, were pooled together with other heart failure (HF) outcomes.
In order to improve risk stratification for VA/SD and patient selection for primary prevention ICD, it is useful to evaluate VA/SD and HF events separately, with the aim of finding specific predictors of each outcome category.
The main objective of the current study was to assess if native T1, extracellular volume (ECV) fraction and CMR-based global left ventricular longitudinal strain (LV-GLS) provided additional (over and above LGE and LVEF) and specific prognostic value for risk-stratification of VA/SD in NICM.
Methods
The study is a non-prespecified secondary analysis of NICM patients included in the prospective longitudinal single centre UHSM-CMR registry (https://clinicaltrials.gov/ct2/show/NCT02326324); this prospective registry includes any adult patient undergoing clinically indicated CMR scanning at the University Hospital of South Manchester, it started in January 2015 and plans to follow-up patients for up to 10 years after the CMR. The study was approved by the ethics committee of the North West Health Board. The data underlying this article will be shared on reasonable request to the corresponding author.
Study population
Consecutive patients with NICM were evaluated by CMR between 01/2015 and 06/2018 at the University Hospital of South Manchester (United Kingdom). All patients provided written informed consent. The diagnosis of NICM was based on the presence of left ventricular systolic dysfunction in the absence of abnormal loading conditions or significant coronary artery disease (defined as >70% luminal stenosis in a major coronary artery or >50% in the left main coronary artery). We considered as systolic dysfunction the presence of reduced LVEF, as compared to published age- and sex-specific reference values,9 after correction for the exclusion of papillary muscles from the LV volume, as previously described.3 Exclusion criteria encompassed valvular heart disease due to moderate or severe primary valvular dysfunction, previous myocardial infarction or sub-endocardial LGE, infiltrative myocardial disease, sarcoidosis, hypertrophic cardiomyopathy, congenital heart disease and probable or definite arrhythmogenic right ventricular cardiomyopathy. Specifically, infiltrative diseases and sarcoidosis were excluded based on clinical presentation, ECG, laboratory and echocardiographic parameters, specific CMR findings10,11 and, when considered appropriate, results of additional imaging modalities such as positron emission tomography or nuclear scintigraphy. Very few patients (11, 1.6% of the whole study population) with transmural LGE but no coronary artery disease or prior myocardial infarction were included if the imaging phenotype including LGE distribution was not compatible with an ischaemic insult in a specific coronary artery territory, using the standardized coronary arterial territories as a reference;12 we included only those patients whose transmural LGE distribution deviated so much from the standardized coronary arterial territories that it could not be attributed to individual variability.
CMR protocol
Patients were scanned on either a 1.5 T Avanto or 3 T Skyra scanner (Siemens, Erlangen, Germany) equipped with either a 16- or 32-element phased array coil by experienced cardiac trained radiographers in line with protocols of the Society of Cardiac Magnetic Resonance and as published previously.13 In brief, steady state free precession cine sequences were obtained in long (4 chamber, 2 chamber, 3 chamber, left and right ventricular outflow tracts views) and short axis, followed by short axis pre-contrast T1 maps. Typical temporal resolution of cine images was <45 ms. Gadolinium contrast (0.2 mmol/kg gadoterate meglumine, Dotarem, Guerbet) was then given with late gadolinium images (both magnitude and phase sensitive inversion recovery) and short axis post contrast T1 maps acquired at 10 and 15–20-min post contrast, respectively. The T1 maps were acquired using modified look-locker inversion recovery (MOLLI) pulse sequences with built in motion correction and a 5b(3b)3b acquisition protocol with a 35-degree flip angle. The post contrast MOLLI sequence was: 4b(1b)3b(1b)2b.
CMR analysis
Scans were analysed in accordance with published guidelines14 using Medis Suite MR (Medis, Leiden, Netherlands) post processing software. Left and right ventricular volumes were calculated from the short axis cine stack as described in detail previously.15 Presence of LGE was determined qualitatively and the pattern and number of segments affected were recorded, according to the standard segmentation of the left ventricle into 17 segments.12 The endocardial and epicardial borders of the pre- and post- contrast T1 maps were traced avoiding any blood pool contamination. An additional region of interest was drawn in the blood pool avoiding papillary muscles and trabeculation (see Figure 1). Pre and post-constrast T1 were analyzed in the mid-ventricular short axis slice. ECV was calculated in patients who had haematocrit assessment on the day of the CMR with the following formula: ECV = λ × (1-haematocrit), where the partition coefficient, λ = ΔR1 (myocardium)/ΔR1(Blood). ΔR1 is proportional to contrast agent concentration. ΔR1 = R1(post-contrast)-R1(pre-contrast). Mean and median native T1 and global ECV for mid left ventricular segments were recorded.
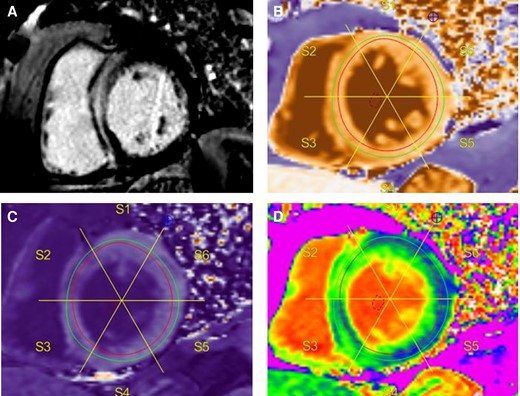
Example of LGE imaging and T1 mapping. Typical septal mid-wall hyperenhancement on LGE imaging (A). Native (pre-contrast) T1 map with blood pool region of interest (ROI) (B). Endocardial and epicardial contours drawn within the myocardium to avoid blood pool signal contamination, and segmentation. Corresponding post contrast T1 map with blood pool ROI and copied segmentation scheme (C). ECV map with corresponding segmentation (D).
As normal native T1 values differ depending on the field strength of the CMR scanner, native T1 values were additionally standardized by expressing them as the difference between the observed mean mid T1 value and reported normal values (see Supplementary data online, Table S1).16 At Wilcoxon rank-sum test no significant difference was found in the standardized values between patients scanned at 1.5 T and 3 T (P = 0.19).
Endocardial left ventricular contours in all 3 left ventricular long axis cine views to derive LV-GLS were drawn by a single operator using Q-strain (Medis Medical Imaging systems, Leiden, the Netherlands). These contours were then reviewed and manually adjusted at end-diastole and end-systole if necessary, and an average was computed to reflect the LV-GLS (see Supplementary data online, Figure S1).
Patients were considered as LGE+ if LGE was visually detected in the left ventricle. Patients with LGE only at the right ventricular insertion points were considered as LGE-.
All CMR data were analysed by one operator who is a European Society of Cardiology level 3 certified CMR reporting cardiologist.
Follow-up and outcomes
Patients were followed up at our hospital or at their respective referring centre. The frequency of follow-up was according to the clinical need of each patient. Patients with implantable cardiac devices were also regularly followed up in our device clinic every 6–12 months, depending on the availability of remote monitoring and the clinical status of each patient. The duration of the follow-up was calculated starting from the first diagnosis of NICM. Outcome data were obtained from hospital electronic patient records and general practitioners records (of note, we had access to follow-up data at every referring centre). Mortality data were also checked in the National Health System digital. ICD therapies were considered as appropriate or inappropriate after careful evaluation by a trained cardiac physiologist and a specialized consultant cardiologist.
The primary endpoint was a combined arrhythmic endpoint comprising sustained ventricular tachycardia, appropriate ICD therapies (either anti-tachycardia pacing or shock), resuscitated cardiac arrest (rCA) or SD.
The secondary outcome was a combined HF endpoint, including death due to end-stage HF, heart transplant, left ventricular assist device implant or HF hospitalization.
The combined arrhythmic endpoint was analysed excluding patients who had experienced an episode of sustained VA or rCA as the first manifestation of NICM.
Statistical analysis
Statistical analysis was undertaken using the STATA RELEASE 12 software (StataCorp LP, College Station, Texas, USA). Categorical data is expressed as percentages and quantitative data is expressed as median plus interquartile range. Linear trend was evaluated with the Mantel-Haenszel test.
The Cox proportional hazards method was used to evaluate predictors of outcomes. The validity of the assumption of proportionality was verified by analysis of interaction with time (see Supplementary data online, Table S2).
The multivariate regression models were created as follows: starting with all variables showing a significant association with the effect at univariate analysis, a best subset regression procedure was used to identify the most suitable and parsimonious multivariate model, i.e. the one with the lowest value of Akaike information criterion. For continuous variables, ROC curves were used to identify the best cut- off (highest Youden index) to predict a certain outcome: dichotomized variable were then used for risk-prediction models, given their higher value for translation into clinical practice. The comparison between risk stratification models was performed by comparing the Area under the receiver operating characteristic (ROC) curve (AUC) using De Long’s algorithm.
For the primary endpoint, Fine and Gray competing risk regression was also employed, using death and heart transplant as competing events.
The internal validation of the chosen risk-stratification model was performed through bootstrapping using 200 samples. The shrinkage or degree of optimism was evaluated by subtracting the mean value of Harrell’s C statistic obtained in the 200 bootstrap samples from Harrell’s C statistic of the model in the overall population.
Differences were considered statistically significant at a 2-sided P < 0.05 level.
Results
Baseline characteristics
After exclusion of 3 patients lost to follow-up, 703 NICM patients with available native T1 values and GLS were included in the study. 618 patients had pre- and post-contrast T1 maps and same day haematocrit available allowing for ECV assessment. Baseline characteristics are described in Table 1.
Baseline characteristics of the population of the study
| Overall cohort (N = 703) | Patients with ECV (N = 618) | ECV < 30% (N = 423) | ECV ≥ 30% (N = 195) | P | |
|---|---|---|---|---|---|
| Gender (male) | 465 (66%) | 410 (66%) | 293 (69%) | 117 (60%) | 0.02 |
| Age (years) | 59 (49–68) | 59 (50–68) | 58 (49–67) | 59 (51–70) | 0.1 |
| History of atrial fibrillation | 189 (27%) | 170 (28%) | 121 (29%) | 49 (25%) | 0.36 |
| Neuromuscular disease | 9 (1%) | 8 (1%) | 4 (1%) | 4 (2%) | 0.27 |
| Severe Alcohol excessa | 17 (2%) | 15 (2%) | 10 (2%) | 5 (3%) | 0.88 |
| Previous chemotherapy | 35 (5%) | 32 (5%) | 16 (4%) | 16 (8%) | 0.02 |
| Prior miocarditisb | 33 (5%) | 30 (5%) | 20 (5%) | 10 (5%) | 0.83 |
| NYHA Class | 0.07 | ||||
| I | 322 (46%) | 286 (46%) | 210 (50%) | 76 (38%) | |
| II | 206 (30%) | 178 (29%) | 118 (28%) | 60 (31%) | |
| III | 138 (20%) | 119 (19%) | 74 (18%) | 45 (23%) | |
| IV | 37 (5%) | 35 (6%) | 21 (5%) | 14 (7%) | |
| NYHA > II | 175 (25%) | 154 (25%) | 95 (23%) | 59 (30%) | 0.04 |
| Wide QRS (>120 ms) | 231 (33%) | 201 (33%) | 132 (31%) | 69 (35%) | 0.3 |
| LBBB | 204 (29%) | 182 (29%) | 121 (29%) | 61 (31%) | 0.5 |
| Betablockers | 515 (73%) | 458 (74%) | 309 (73%) | 149 (76%) | 0.38 |
| ACE inhibitors/ARB | 546 (78%) | 485 (78%) | 318 (75%) | 167 (86%) | 0.003 |
| MRA | 266 (38%) | 238 (39%) | 142 (34%) | 96 (49%) | <0.001 |
| Loop diuretics | 237 (34%) | 211 (34%) | 134 (32%) | 77 (39%) | 0.06 |
| ICD | 95 (14%) | 80 (13%) | 36 (9%) | 44 (23%) | <0.001 |
| CRT | 60 (9%) | 54 (9%) | 25 (6%) | 29 (15%) | <0.001 |
| Follow-up (months) | 21 (15–34) | 21 (15–33) | 22 (15–34) | 21 (14–32) | 0.52 |
| CMR parameters | |||||
| LVEF (%) | 42 (32–48) | 42 (32–48) | 44 (36–49) | 38 (27–45) | <0.001 |
| iLVEDV (mL/m2) | 111 (91–134) | 111 (95–137) | 108 (92–129) | 125 (99–159) | <0.001 |
| iLVESV (mL/m2) | 64 (51–89) | 64 (51–88) | 61 (49–81) | 75 (56–107) | <0.001 |
| LV-GLS (%) | −12 (−15; −9) | −12 (−15;−9) | −13 (−16; −10) | −11 (−14; −8) | <0.001 |
| LGE | 292 (42%) | 254 (41%) | 146 (35%) | 108 (55%) | <0.001 |
| Mean T1 mid segments standardized (1.5 T and 3 T), ms | 55 (26–89) | 54 (26–87) | 46 (19–74) | 79 (46–120) | <0.001 |
| Mean ECV mid segments | 27 (25–30) | 27 (25–30) | 26 (24–27) | 32 (30–34) | <0.001 |
| RVEF (%) | 55 (47–61) | 55 (48–61) | 55 (49–62) | 54 (44–60) | 0.03 |
iLVEDV, left ventricular end diastolic volume indexed for body surface area; iLVESV, left ventricular end systolic volume indexed for body surface area; RVEF, right ventricular ejection fraction; ACE, angiotensin converting enzyme; ARB, angiotensin receptor blockers; MRA, mineralcorticoid receptor antagonists; CRT, any cardiac resynchronization therapy, including both pacemakers and defibrillators. P is for comparison between patients with ECV < 30% and patients with ECV ≥ 30%.
>4 drinks/day or >14 drinks/week, according to the definition of the national Institute for Alcohol and Alcoholism.
Prior myocarditis was defined in the presence of an histologically proven prior episode of acute myocarditis.
LGE was observed in 292 patients (42%). LGE+ cases had higher volume indices, lower LVEF, lower GLS, higher T1 and higher ECV (see Supplementary data online, Table S3).
Predictors of the primary endpoint: all patients
The combined arrhythmic endpoint was evaluated among the 691 patients without VA or rCA as the first manifestation of the disease. During a median follow-up of 21 months, 14 patients (2%) met this endpoint: 7 appropriate ICD therapies, 4 sustained monomorphic ventricular tachycardia, one rCA with shockable rhythm and two SD.
As shown in Table 2, mean native T1 was not associated with the primary endpoint (HR 1.1, P = 0.2). LV-GLS had a significant association with the primary endpoint at univariate analysis but this association was lost after adjustment for LVEF (see Supplementary data online, Table S4). The best cut-off for LVEF to predict the primary outcome was 35% (Youden index of 0.43). As shown in Table 2, the best multivariate model to predict the primary endpoint included LVEF ≤ 35% (HR 3.6, P = 0.03) and LGE (HR 13.8, P = 0.01). Similar results were obtained at competing-risk regression (see Supplementary data online, Table S5).
Cox regression for the combined arrhythmic endpoint
| Univariate | All patients | Patients with ECV available | ||
|---|---|---|---|---|
| HR (95% CI) | P | HR (95% CI) | P | |
| Age (every 10 years) | 1.2 (0.78–1.7) | 0.47 | 1.1 (0.7–1.6) | 0.76 |
| Sex | 2.9 (0.65–13.1) | 0.16 | 2.1 (0.46–9.8) | 0.34 |
| History of atrial fibrillation | 0.72 (0.2–2.6) | 0.62 | 0.99 (0.26–3.7) | 0.99 |
| NYHA > II | 0.46 (0.1–2.1) | 0.31 | 0.64 (0.14–3) | 0.57 |
| QRS > 120 ms | 1.2 (0.4–3.6) | 0.75 | 1.2 (0.34–4) | 0.8 |
| LBBB | 1 (0.32–3.3) | 0.96 | 0.89 (0.24–3.4) | 0.87 |
| Primary prevention ICD | 5.1 (1.75–14.7) | 0.003 | 5.9 (1.8–9.5) | 0.003 |
| LVEF | 0.93 (0.89–0.97) | 0.002 | 0.92 (0.87–0.97) | 0.002 |
| LVEF ≤ 35% | 5.3 (1.7–17) | 0.005 | 6 (1.6–22.7) | 0.008 |
| iLVEDV (every 10 mL/m2) | 1.1 (0.97–1.2) | 0.14 | 1.1 (1–1.3) | 0.045 |
| iLVESV (every 10 mL/m2) | 1.1 (1.02–1.3) | 0.02 | 1.2 (1.04–1.3) | 0.008 |
| LV-GLS | 1.2 (1.05–1.4) | 0.006 | 1.2 (1.1–1.4) | 0.007 |
| RVEF | 0.98 (0.94–1.02) | 0.23 | 0.98 (0.93–1.03) | 0.37 |
| LGE | 17.8 (2.3–135.9) | 0.006 | 14.3 (1.8–112.2) | 0.01 |
| Mean native T1 mid segments standardized (every 10 ms) | 1.1 (0.98–1.2) | 0.12 | 1.1 (0.98–1.2) | 0.11 |
| Mean ECV mid segments | 1.3 (1.1–1.4) | <0.001 | ||
| ECV ≥ 30% | 22.9 (2.9–179.2) | 0.003 | ||
| Best multivariate models | Harrell’s C = 0.82 | Harrell’s C = 0.885 | ||
| LVEF ≤ 35% | 3.6 (1.1–11.7) | 0.02 | 3.2 (0.85–12.3) | 0.09 |
| LGE | 13.4 (1.7–104) | 0.01 | 7.9 (1.01–62.6) | 0.049 |
| Mean ECV ≥ 30% | 14.1 (1.8–111.2) | 0.01 | ||
LBBB, left bundle branch block; iLVEDV, left ventricular end diastolic volume indexed for body surface area; iLVESV, left ventricular end systolic volume indexed for body surface area; RVEF, right ventricular ejection fraction.
Predictors of the primary endpoint: patients with ECV available
Among the 609 patients with ECV available and no prior VA, the primary endpoint occurred in 11 (2%). Mean native T1 was not associated with outcome; the significant univariate association of primary prevention ICD, LV-GLS and left ventricular volumes was lost after adjustment for LVEF and, in the case of LV volumes, also after separate adjustment for LGE (see Supplementary data online, Table S6).
By contrast, mean ECV was a significant predictor of the primary endpoint both at univariate analysis and after adjustment for LVEF or LGE, as shown in Table 2 and see Supplementary data online, Table S6. The best cut-off of mean ECV to predict the primary endpoint was ≥30% (Youden index 0.6). The best multivariate model included LGE (HR 7.9, P = 0.049), ECV ≥ 30% (HR 14.1, P = 0.01) and LVEF ≤ 35% (HR 3, P = 0.09). This predictive model achieved an excellent goodness of fit, with a Harrell’s C statistic of 0.885.
Mean ECV ≥ 30% and the primary outcome.
As shown in Table 1, patients with mean ECV ≥ 30%, as compared to those with mean ECV < 30%, had worse functional class, higher left ventricular volumes, worse left and right ventricular function, higher prevalence of LGE and higher values of native T1. However, as shown in see Supplementary data online, Table S7, ECV ≥ 30% remained significantly associated with the primary outcome after adjustment for all variables which had shown significant differences between patients with ECV < 30% and those with ECV ≥ 30%.
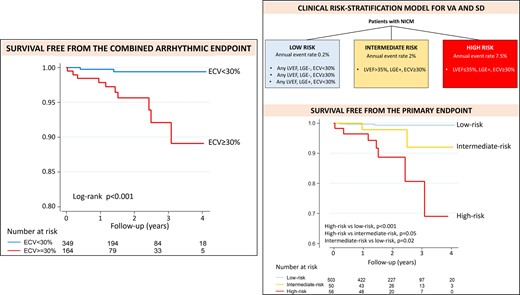
With respect to the occurrence of the primary endpoint, mean ECV ≥ 30% had a sensitivity of 91%, specificity of 70%, negative predictive value of 99.8% and a positive predictive value of 5% (the latter a consequence of the low cumulative incidence of the primary endpoint in this cohort). The cumulative incidence of the primary endpoint was significantly higher in patients with ECV ≥ 30% than in those with ECV < 30% (5.2% vs. 0.2%, P < 0.001, see also the Kaplan–Meier curves of Figure 2). Of note, all but one patient who achieved the primary endpoint had an ECV ≥ 30%.

Survival free from the primary endpoint according to ECV with 30% cut-off. Kaplan–Meier curves for survival free from the primary endpoint, stratified by ECV with the 30% cut-off. P obtained with the log-rank test.
ECV ≥ 30% as a standalone parameter achieved the highest AUC for the prediction of the primary endpoint (AUC 0.8), numerically higher than LVEF ≤ 35% (AUC 0.71, P = 0.14) and also than LGE (AUC 0.76, P = 0.49).
The addition of ECV ≥ 30% improved considerably the predictive ability of a model including only LGE and LVEF ≤ 35%, increasing the Harrell’s C from 0.81 to 0.885.
Three patients had confirmed episodes of ventricular fibrillation (VF): 2/3 were LGE+ and all the three had ECV ≥ 30%.
ECV ≥ 30% discriminated the risk of the primary endpoint among LGE+ patients: the cumulative incidence of the combined arrhythmic endpoint was 8.5% in those with ECV ≥ 30% and 0.7% in those with ECV < 30% (P = 0.002). Among LGE- cases, such analysis was futile, given the low risk of these patients (cumulative incidence of 0.25%).
ECV ≥ 30% also significantly improved the discrimination of the arrhythmic risk among patients with LVEF ≤ 35%: the cumulative incidence of the primary endpoint was 9.2% in those with ECV ≥ 30% and 0% in those with ECV < 30% (P = 0.002).
Clinical risk prediction model for the primary endpoint
A clinical risk-prediction model was derived from the best multivariable Cox model obtained among patients with ECV available, which included LGE, ECV ≥ 30% and LVEF ≤ 35%. In the Cox multivariable model LVEF ≤ 35% had a non-significant trend towards an association with the primary outcome, probably due to the low statistical power related to the low number of events. Of note, LVEF ≤ 35% did not provide any additional discrimination among patients without LGE or with ECV < 30%: these patients had low arrhythmic risk (cumulative incidence <1%) independently of their LVEF. However, LVEF did improve the risk stratification among LGE+ patients with ECV ≥ 30% (cumulative incidence of the primary endpoint 4% in those with LVEF > 35% vs. 12.5% in those with LVEF ≤ 35%, P = 0.12). In addition, the multivariable model including the three aforementioned variables performed better than one including only LGE and ECV ≥ 30% (Akaike information criterion 107 vs. 109, Harrell’s C 0.885 vs. 0.86). For all these reasons LVEF ≤ 35% was included in the clinical risk-prediction model, together with LGE and ECV ≥ 30%.
As shown in Figure 3, three groups of patients were identified: 1) The low-risk cases (mean annual event rate of 0.2%) encompassed the 503 patients (83% of the cohort) who were LGE- and/or had ECV < 30% independently of their LVEF. 2) The intermediate-risk group (mean annual event rate of 2%) included the 57 patients (9% of the study cohort) who were LGE+, had ECV ≥ 30% but LVEF > 35%. 3) The high-risk group (mean annual event rate of 7.5%) was that of LGE+ patients with ECV ≥ 30% and LVEF ≤ 35% (49 patients, 8% of the study cohort).
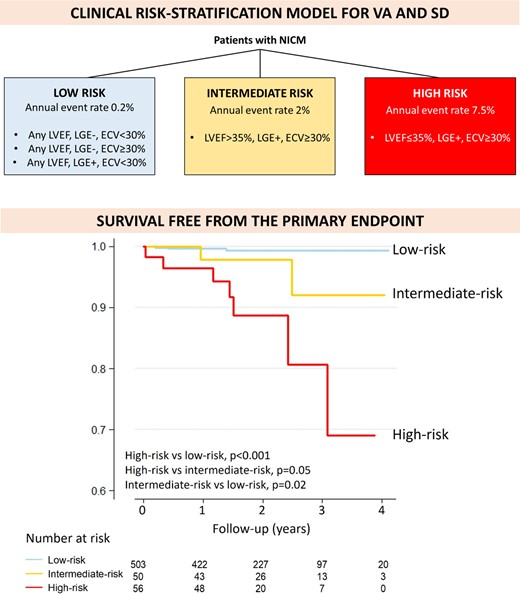
Clinical risk-stratification model. Schematic representation of the clinical risk-stratification model (upper panel). Kaplan–Meier curves for survival free from the combined arrhythmic endpoint, according to the clinical risk-stratification model (lower panel). P obtained with the log-rank test.
There was a significant linear trend for increasing risk of the primary outcome across the three categories of risk identified (P < 0.001).
This clinical risk-stratification model achieved an excellent predictive ability (Harrell’s C 0.82, AUC 0.85), numerically better than LVEF ≤ 35% alone (Harrell’s C of 0.72, AUC 0.71, P = 0.08 for AUC comparison).
At ROC analysis, the best cut-off to predict the risk of the primary endpoint was risk ≥ intermediate, with 82% sensitivity, 84% specificity, 99.6% negative predictive value and an AUC of 0.83.
As compared to a strategy based only on LVEF ≤ 35%, the clinical risk-stratification model allowed to reclassify the arrhythmic risk of 32% of the patients in this cohort. Among patients with LVEF ≤ 35%, currently considered as high-risk, 134 (71%) were reclassified as low-risk. Among patients with LVEF > 35%, currently considered as low-risk, 50 (12%) were reclassified into intermediate risk.
At internal validation, the mean value of Harrell’s C statistic obtained in the 200 bootstrap samples was 0.82, a value identical to the Harrell’s C statistic of the model in the population of the study. These results indicate a minimal degree of optimism of the Harrell’s C statistic obtained from our cohort and suggest an excellent capability of the model to be applied with other samples.
Predictors of the secondary endpoint
31 patients (4%) reached the combined HF endpoint, the majority of these (n = 24) being HF hospitalizations. NYHA class > II and all CMR parameters with the exception of LGE were significantly associated with the combined HF endpoint on univariate analysis (see Supplementary data online, Table S8). However, all these CMR parameters became non-significant after adjustment for LVEF (see Supplementary data online, Table S9).
The best cut-off of LVEF for the HF endpoint was ≤30%. On multivariate analysis only LVEF ≤ 30% (HR 4.3, P < 0.001) and NYHA class > II (HR 5.3, P < 0.001) remained significantly associated with the HF endpoint.
Discussion
This is, to our knowledge, the first report assessing the prognostic role of CMR-based parametric mapping (including both native T1 and ECV) and GLS in NICM, with a specific focus on VA and SD.
The main findings of this work are the following: 1) Native T1 was not associated with the arrhythmic endpoint and LV-GLS lost its significant association after adjustment for LVEF: by consequence, it seems that these two parameters can add little to a modern risk-stratification based on LVEF and LGE. 2) ECV was the strongest independent predictor of VA and SD and offered incremental prognostic value on top of LGE and LVEF. 3) The ECV cut-off of 30% offered the highest discrimination for the arrhythmic endpoint and 4) A risk-model based on LVEF ≤35%, LGE presence/absence and ECV ≥ 30% achieved an excellent predictive ability and reclassified the risk of 32% of patients, as compared to the criterion of LVEF ≤ 35% used alone.
ECV and the arrhythmic endpoint
LGE has been recognized as an independent, strong and specific predictor of VA and SD.2,3 However, some limitations of LGE need to be acknowledged: it relies on differences in imaging contrast of neighboring segments highly affected by contrast kinetics and as such does neither lend itself to quantification nor does it take account of diffuse fibrosis. As a prognostic marker, LGE has a very high negative predictive value for VA/SD, so that LGE- cases are at very low arrhythmic risk independently of their LVEF (at least for LVEF > 20%).3 By contrast, further risk-stratification is needed among LGE+, especially among those with LVEF > 35%. Lastly, LGE has been shown to be a very specific predictor for sustained monomorphic ventricular tachycardia but to have lower predictive value for VF.17
For all these reasons, the present findings about the incremental prognostic value of ECV on top of LGE and LVEF are of high clinical relevance.
ECV also has an important advantage as compared to native T1: it is less influenced by vendors and field strength, and it is therefore more reproducible. ECV allows for quantification of diffuse fibrosis.13 While localized myocardial scar is recognized as a major substrate for VA, especially monomorphic ventricular tachycardia, diffuse fibrosis may also play an important role in arrhythmogenesis, causing heterogeneous conduction slowing which might favour VA, including VF. Recently, among LGE- patients with NICM, diffuse fibrosis assessed by post-contrast T1 mapping was shown to correlate with voltage abnormalities identified at electroanatomical mapping.18 Thus, the information provided by ECV could be complementary to that of LGE.
Our findings are in line with these hypotheses: ECV was an independent predictor of the primary endpoint and improved the predictive ability of a model already containing LGE and LVEF. ECV ≥ 30% was actually the strongest predictor of the primary outcome, being associated with a 14 times higher risk as compared to ECV < 30%. Such strong association, if confirmed by further studies, might be highly relevant for clinical practice. The high negative predictive value of ECV < 30% (99.8%) should also be underscored.
In addition, ECV with the 30% cut-off was able to further discriminate the arrhythmic risk both in LGE+ patients and in those with LVEF ≤ 35%. Therefore, ECV could help identifying which LGE+ patients have the highest risk and may benefit the most from preventive ICD and which, by contrast, are unlikely to benefit from such intervention; ECV could also improve the recognition of low-risk patients among those with LVEF ≤ 35%.
The low number of VF episodes observed in our cohort prevented us from analyzing specific predictors of such event. Larger studies are needed to evaluate if ECV can be a more specific predictor of VF as compared to LGE. At least, it is reassuring that all patients with a VF episode had an ECV ≥ 30%.
ECV ≥ 30% was also a specific predictor of VA/SD, with a much weaker association with the HF endpoint.
Our findings may also be relevant for future research: future studies aimed at improving risk stratification for VA/SD in NICM should include not only LGE but also ECV among the covariates evaluated.
Clinical risk-stratification model
We have provided a simple risk-stratification scheme which identified three categories of risk (low, intermediate and high-risk) achieving an excellent predictive ability.
This model allowed identifying a large group of patients (83% of the entire study population) with a very low arrhythmic risk. Of note, 71% of patients with LVEF ≤ 35%, who are currently considered to have class I indication for preventive ICD implant,19 was reclassified as low-risk patients. Our data clearly question the potential benefit of primary prevention ICD in such cases. According to this model, the arrhythmic risk is essentially concentrated among patients with both LGE and ECV ≥ 30%; in such cases LVEF is helpful to further improve the risk stratification. The sub-group of patients with intermediate risk should be the focus of further research to identify those at higher risk who may benefit from preventive ICD.
HF endpoint
In this cohort, all variables derived from CMR-based parametric mapping as well as GLS lost statistical significance for the HF endpoint after adjustment for LVEF.
Other reports have previously found an independent association of native T1, ECV or GLS with mortality and morbidity in NICM.4,6,8 Several factors may contribute to these discrepancies, including slightly distinct outcomes analyzed and disparities in the populations included or the medical treatment prescribed to patients. For example, in the study by Romano et al.8 LGE was present in only 28% of DCM patients (as compared to the 42% of our cohort); as another example, Puntmann et al.4 included patients from 2011 to 2014, with much lower proportion of beta-blockers and renin-angiotensin system inhibitors usage (29% and 58% respectively vs. 74% and 79%, respectively, in our cohort).
Limitations
This is an observational study therefore association does not equate to causality. The medium-term follow-up and the low rate of events in such a contemporary cohort of NICM patients with overall moderate phenotype and on optimal medical therapy provided us with relatively low number of events. This may have provided insufficient statistical power to identify significant predictors of the HF outcome on top of LVEF and NYHA class and may also have influenced that some of the analysis for the primary outcome reached borderline statistical significance. In addition, the relatively low number of events prevented us from performing a sub-analysis about the additional prognostic value of LGE location/distribution and of the number of segments with LGE. However, this limitation did not prevent to detect a strong and independent association between ECV and the arrhythmic outcome.
No quantitative LGE assessment was performed, based on the fact that there is no gold standard method for LGE quantification and that it is not clear the additional prognostic value of LGE quantification on top of LGE presence/absence or LGE patterns in patients with NICM. However, we recognize that this may be a limitation of the study since LGE quantification could have provided further insights.
Another limitation of the current study (shared by all other studies referenced here) is the lack of comprehensive genetic assessment.
The fact that LVEF ≤ 35% resulted as the best cut-off for the primary endpoint (which included appropriate ICD therapies) may be influenced by current criteria for ICD implant. However, LVEF ≤ 35% retained its significant association with the primary outcome also after adjustment for primary prevention ICD (adjusted HR 4.4, P = 0.02).
Conclusions
In a large cohort of NICM patients with CMR-based parametric mapping and LV-GLS analysis, ECV was the only parameter which demonstrated an independent and strong predictive value for VA and SD, on top of LGE and LVEF. The best cut-off of ECV to predict the arrhythmic outcome was 30%. ECV ≥ 30% improved the risk-stratification among LGE+ patients and among those with LVEF ≤ 35%. A risk-stratification model based on LGE status, LVEF ≤ 35% and ECV ≥ 30% achieved an excellent predictive ability for VA and SD, reclassifying the risk of 32% of patients as compared to LVEF ≤ 35% alone.
Supplementary data
Supplementary data are available at European Heart Journal - Cardiovascular Imaging online.
Funding
Dr Brown was in receipt of a joint Alliance Medical and UHSM Fellowship Salary support grant. Drs Miller and Schmitt received a restricted grant by Guerbet in support of the UHSM CMR study (NCT02326324). Beyond this there is no financial support to declare. All other authors report no relevant financial conflict of interest.
Data availability
Access to data could be provided under reasonable request.
References
Author notes
A.D.M. and P.F.B. contributed equally to this work.
