


Abstract
Type of funding sources: Private grant(s) and/or Sponsorship. Main funding source(s): Dr Hughes is supported by the British Heart Foundation (grant number FS/17/82/33222).
The imaging criteria for diagnosis of apical hypertrophic cardiomyopathy (ApHCM) is a maximum wall thickness (MWT) ≥15mm. CMR enables detection of subtle phenotypic features (e.g. loss of apical tapering, cavity obliteration) and coupled with characteristic electrocardiogram changes, ApHCM can be diagnosed without overt hypertrophy. However, these patients are not captured by current diagnostic criteria.
We sought to use a machine learning tool to quantify wall thickness and identify patients with ‘relative’ ApHCM that do not reach current diagnostic thresholds.
CMR images from 4118 healthy participants from the UK Biobank were segmented automatically with a clinically validated machine learning algorithm and wall thickness measured at all point in the myocardium by solving a solution to Laplace’s equation. MWT were pooled into 16 AHA segments and indexed to body surface area (BSA). The non-indexed and indexed segmental upper limit of normal was calculated as the mean + 3 standard deviations (the equivalent of 95% confidence interval after correcting for multiple [16] comparisons using the Bonferroni method).
73 overt ApHCM subjects (MWT>15mm) and 31 relative ApHCM subjects underwent CMR scanning. In healthy controls, the non-indexed (and indexed) upper limits were calculated for the apical-anterior 10.2mm (5.2 mm/m2), apical-septal 11.1mm (5.6 mm/m2), apical-inferior 10.5mm (5.3 mm/m2) and apical-lateral 10.1mm (5.2 mm/m2) segments. With a non-indexed cut-off, all (73 of 73) overt ApHCM and 84% (26 of 31) relative ApHCM were classified as having an abnormally thick apex. 3% (127 of 4118) of the healthy UK Biobank cohort were classified as abnormal, as expected. Using an indexed cut-off, all overt ApHCM and 87% (27/31) relative ApHCM were classified as abnormal, and 3% (123 of 4118) of the healthy UK Biobank cohort were misclassified.
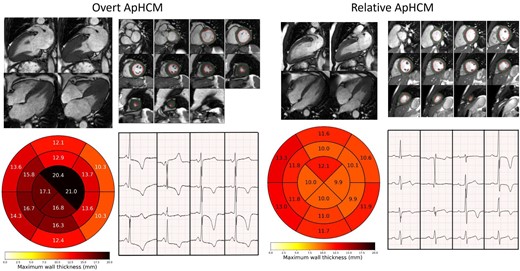
Overt and relative apical HCM examples
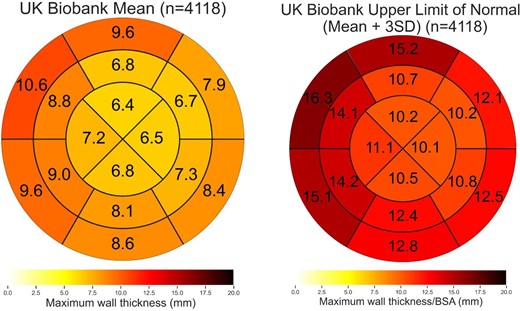
Healthy controls AHA maps (non-indexed)
