


Abstract
Aortic valve area (AVA) used for echocardiographic assessment of aortic stenosis (AS) has been traditionally interpreted independently of sex, age and race. As differences in normal values might impact clinical decision-making, we aimed to establish sex-, age- and race-specific normative values for AVA and Doppler parameters using data from the World Alliance Societies of Echocardiography (WASE) Study.
Two-dimensional transthoracic echocardiographic studies were obtained from 1903 healthy adult subjects (48% women). Measurements of the left ventricular outflow tract (LVOT) diameter and Doppler parameters, including AV and LVOT velocity time integrals (VTIs), AV mean pressure gradient, peak velocity, were obtained according to ASE/EACVI guidelines. AVA was calculated using the continuity equation. Compared with men, women had smaller LVOT diameters and AVA values, and higher AV peak velocities and mean gradients (all P < 0.05). LVOT and AV VTI were significantly higher in women (P < 0.05), and both parameters increased with age in both sexes. AVA differences persisted after indexing to body surface area. According to the current diagnostic criteria, 13.5% of women would have been considered to have mild AS and 1.4% moderate AS. LVOT diameter and AVA were lower in older subjects, both men and women, and were lower in Asians, compared with whites and blacks.
WASE data provide clinically relevant information about significant differences in normal AVA and Doppler parameters according to sex, age, and race. The implementation of this information into clinical practice should involve development of specific normative values for each ethnic group using standardized methodology.
See the editorial comment for this article ‘The importance of big databases in understanding valvular heart disease’, by X. Galloo and J.J. Bax, https://doi.org/10.1093/ehjci/jeac244.
Introduction
Aortic stenosis (AS) is the most common primary valve lesion requiring intervention in Europe and North America,1 with a prevalence that is rapidly increasing in high-income countries.2 In this context, accurate evaluation of the aortic valve (AV) is vital for disease diagnosis, grading of severity and decision-making. Transthoracic echocardiography (TTE) is the method of choice for the evaluation of patients with AS due to its wide availability and its ability to simultaneously provide information on valve morphology and haemodynamics and on the effect of AV disease on cardiac chambers and great vessels.3,4
AV and left ventricular outflow tract (LVOT) velocity time integrals (VTIs), AV mean pressure gradient (PGmean) and AV peak velocity (AV Vmax) are the main TTE Doppler parameters used to determine the presence of AS.3,4 The LVOT diameter (LVOTd) needs to be measured to obtain the aortic valve area (AVA) using the continuity equation (CE).
Significant sex-, age-, and race-related differences in TTE normative values have been recently reported for several cardiac structures,5–9 cardiac output (CO), and stroke volume (SV).10 However, age-, sex-, and race-specific normative values for AV Doppler and AVA are lacking, and whether such patient characteristics should be considered is still unknown. As knowing and understanding these nuances might change daily clinical interpretation and decision-making, we aimed to extend the analysis of sex-, age-, and race-related differences to the normative TTE values for AVA and AV Doppler parameters, using data from the World Alliance Societies of Echocardiography (WASE) Normal Values Study.
Methods
The rationale and design of the WASE Normal Values Study has been described elsewhere.11 Briefly, this was a multicentre international, observational, prospective, cross-sectional study of healthy adult individuals. The American Society of Echocardiography invited representatives of member societies of the ASE International Alliance Partners to participate in this study by enrolling 100 healthy adult volunteers at each of the 19 participating sites. A ‘normal’ subject was defined as one without a history or clinical evidence of cardiac, lung, or kidney disease. Subjects with evidence of bicuspid aortic valve anatomy on 2D echocardiogram were excluded. Individuals with body mass index > 30 kg/m2, pregnant women and competitive athletes were excluded. Only in the age group of >65 years were participants allowed to have a history of hypertension or hyperlipidaemia, and only if blood pressure and lipids were well controlled with no more than two medications, and there was no evidence of LV hypertrophy on TTE. Individuals were evenly distributed among three age subgroups (young: 18–40 years; middle-aged: 41–65 years; and elder adults: > 65 years) and both sexes.
A single encounter with each subject was required for the collection of basic demographic information and a comprehensive TTE examination. At the time of examination, all subjects were in sinus rhythm, and blood pressure measurements were recorded. The definitions of race were adapted from those proposed for the 2020 US census, the US Food and Drug Administration, and the 2011 United Kingdom census.12 The study was approved by local ethics committees, and subjects provided informed consent, as mandated by each of the enrolling centres’ institutional review boards or ethics committees.
Comprehensive TTE data sets were acquired following a study-specific standardized acquisition protocol created by the WASE core laboratories (MedStar Health Research Institute and the University of Chicago) based on recent ASE recommendations.13,14
A total of 2008 subjects constituted the final WASE study population. After the exclusion of 105 subjects who lacked adequate image quality to allow AV and LVOT measurements, a total of 1903 subjects (977 males, 926 females) formed the final population for the current study. Basic demographic data of this cohort are shown in Table 1. Men had larger BSA and were taller than women, and blood pressure mean values were slightly higher in men. Of note, 114 subjects (6% of the study population) had systolic blood pressure > 140 mmHg at the time the echocardiogram was performed.
Baseline demographic characteristics
| All subjects | Men | Women | |
|---|---|---|---|
| n | 1903 | 977 | 926 |
| Age (years) | 47 ± 17 | 48 ± 17 | 47 ± 18 |
| Height (cm) | 167 ± 10 | 173 ± 8 | 160 ± 7* |
| Weight (kg) | 68 ± 14 | 75 ± 13 | 61 ± 11* |
| BSA (m²) | 1.77 ± 0.22 | 1.89 ± 0.19 | 1.65 ± 0.16* |
| HR (bpm) | 68 ± 11 | 66 ± 10 | 69 ± 11* |
| Systolic BP (mmHg) | 120 ± 13 | 123 ± 12 | 118 ± 13* |
| Diastolic BP (mmHg) | 74 ± 9 | 75 ± 9 | 73 ± 9* |
BSA, body surface area, BP, blood pressure. * P<0.05 men vs. women
Image analysis
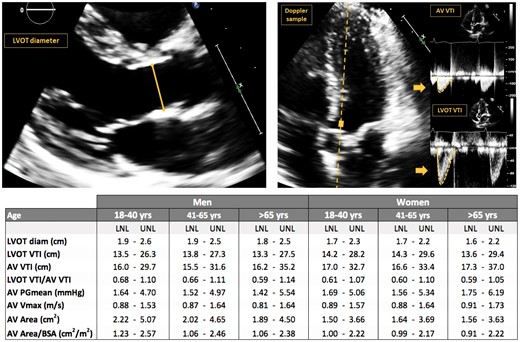
All measurements were performed according to the ASE/EACVI guidelines recommendations,15 as shown in Figure 1. The LVOTd was measured in the parasternal long-axis view, immediately proximal to the AV annulus in a zoomed mid-systolic frame, from inner edge to inner edge. LVOT VTI was measured using pulsed-wave (PW) Doppler in either apical three- or five-chamber views (100 mm/s speed) after proper cursor alignment. When a smooth velocity curve could be obtained at the AV annulus, this site was used for LVOT VTI measurement. When flow acceleration at the level of the AV annulus was detected, the sample volume was moved apically by 0.5–1.0 cm, until the VTI envelope was well visualized. The AV VTI was measured using continuous-wave (CW) Doppler in either apical three- or five-chamber views, depending on which view provided a higher peak velocity. PGmean and Vmax were obtained from the velocity curve tracings. AVA was calculated using the CE according to the formula: LVOT Area × LVOT VTI = AVA × AV VTI. Dimensionless index (DI) was calculated from the formula: DI = LVOT VTI/AV VTI. AVA measurements were indexed (AVAi) by body surface area (BSA), which was calculated using the DuBois formula, and also by height. The remaining parameters were not indexed.
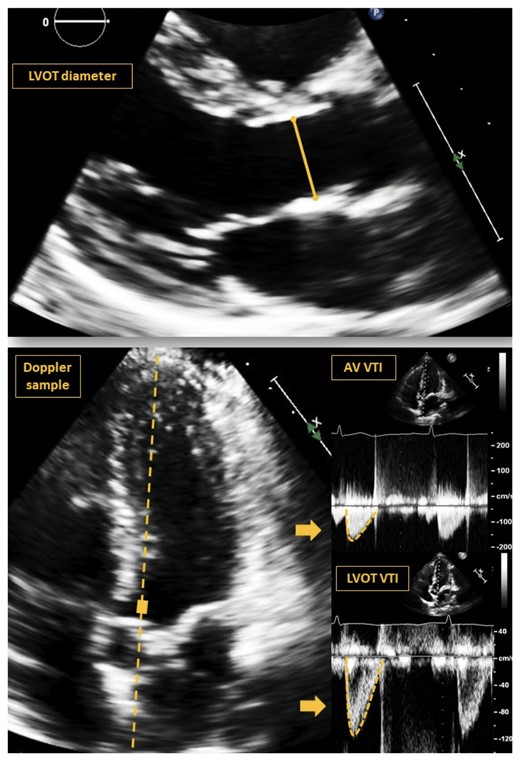
Example of images and measurements performed on a 35-year-old african American woman. LVOT, left ventricular outflow tract, VTI, velocity–time integer, AV, aortic valve.
In addition, parameters of LV function were measured, including ejection fraction (EF), SV, and global longitudinal strain (GLS) according to current guidelines13,14 using vendor-independent software (Image Arena version 4.6, TOMTEC). LV EF was calculated using biplane Simpson’s method of disks. SV was calculated using the Doppler method, as the product of the 2D LVOT cross-sectional area and pulsed-wave Doppler envelope recorded at the LVOT. Endocardial LV GLS was calculated from 2D images using a speckle-tracking technique, from the apical two-, four-, and three-chamber views.
Statistical analysis
All measurements are presented as mean ± SD. Group differences were evaluated using the unpaired two-tailed student’s t-tests. In cases of three-group comparisons, ANOVA was first used to identify significant differences. Statistical significance was defined as P < 0.05. The lower and upper limits of normal (LLN, ULN) for the measurements were calculated as the 2.5th and 97.5th percentiles, respectively, of the corresponding sex and age groups. Box–Cox Power Exponential distribution was used to graphically display the age dependency of the AV parameters. Reproducibility was assessed by repeated measurements in a random sample of 50 study subjects by a second, independent observer, blinded to the previous measurements. Measurement variability was quantified by intraclass correlation coefficients and mean absolute difference in percent of the mean of the repeated measurements.
Results
Comparison between sex groups
The results of the AV analysis according to sex are shown in Table 2. Significant differences were noted in all parameters between men and women (P < 0.05). Notably, women had significantly smaller LVOTd, DI, AVA, and AVAi values, as well as SV. Higher AV Vmax and AV PGmean, as well as LV EF and GLS magnitude values were noted in women. Of note, Tables 3 and 4 show the LLN and ULN for each parameter according to sex and age groups. Notably, the LLN for AVA in women was as low as 1.57 cm2, and AVAi was 0.98 cm2/m2. Moreover, 13.5% of women (125 subjects) showed AVA values <2.0 cm2. Interestingly, more than 50% of these subjects were Asian, who had a smaller mean BSA value (1.6 ± 0.2 m2) compared with the general female population. When this analysis was performed on men, only 2.6% (25 subjects) had AVA values < 2.0 cm2 and none had an AVA below 1.5 cm2.
Measurements of AVA and AV Doppler measurements in the entire study population and separately in men and women
| All subjects | Men | Women | |
|---|---|---|---|
| n | 1903 | 977 | 926 |
| LV EF (%) | 63 ± 3 | 63 ± 3 | 64 ± 3* |
| LV GLS (%) | −21.3 ± 2.1 | −20.7 ± 1.9 | −21.9 ± 2.1* |
| Stroke Volume (ml) | 69 ± 17 | 74 ± 17 | 62 ± 14* |
| Stroke Volume Index (ml/m2) | 39 ± 8 | 39 ± 8 | 38 ± 8 |
| LVOT diam. (cm) | 2.07 ± 0.21 | 2.18 ± 0.19 | 1.95 ± 0.15* |
| LVOT diam./BSA (cm/m2) | 1.18 ± 0.12 | 1.16 ± 0.12 | 1.19 ± 0.12* |
| LVOT diam./Height (cm/m) | 1.24 ± 0.10 | 1.26 ± 0.10 | 1.22 ± 0.09* |
| IVSd Thickness (mm) | 7.7 ± 1.6 | 8.2 ± 1.5 | 7.2 ± 1.5* |
| PVd Thickness (mm) | 8.2 ± 1.4 | 8.6 ± 1.3 | 7.7 ± 1.3* |
| AV Accel. Time (ms) | 93 ± 18 | 91 ± 18 | 95 ± 18* |
| LVOT VTI (cm) | 20.1 ± 3.6 | 19.8 ± 3.4 | 20.5 ± 3.8* |
| AV VTI (cm) | 23.8 ± 4.4 | 23.0 ± 4.2 | 24.6 ± 4.4* |
| LVOT VTI/AV VTI | 0.85 ± 0.12 | 0.87 ± 0.12 | 0.84 ± 0.12* |
| AV PGmean (mmHg) | 3.05 ± 0.98 | 2.95 ± 0.95 | 3.15 ± 1.00* |
| AV Vmax (m/s) | 1.21 ± 0.19 | 1.19 ± 0.19 | 1.22 ± 0.19* |
| AV area (cm2) | 2.91 ± 0.74 | 3.28 ± 0.72 | 2.53 ± 0.53* |
| AV area/BSA (cm2/m2) | 1.64 ± 0.35 | 1.74 ± 0.36 | 1.54 ± 0.32* |
| AV area/height (cm2/m) | 1.74 ± 0.39 | 1.89 ± 0.40 | 1.58 ± 0.32* |
LVOT, left ventricular outflow tract, VTI, velocity–time integer, AV: aortic valve, AV PGmean: aortic valve mean pressure gradient, AV Vmax: aortic valve maximum velocity, BSA: body surface area. *P < 0.05 men vs. women.
Normal ranges for AVA and AV Doppler parameters according for both men and women
| Men | Women | |
|---|---|---|
| LNL UNL | LNL UNL | |
| LVOT diam. (cm) | 1.82–2.55 | 1.67–2.26 |
| LVOT diam./BSA (cm/m2) | 0.95–1.42 | 0.97–1.44 |
| LVOT diam./height (cm/m) | 1.06–1.45 | 1.06–1.40 |
| LVOT VTI (cm) | 13.4–26.8 | 14.2–29.2 |
| AV VTI (cm) | 15.9–31.7 | 16.8–34.0 |
| LVOT VTI/AV VTI | 0.63–1.11 | 0.60–1.08 |
| AV PGmean (mmHg) | 1.55–4.90 | 1.58–5.50 |
| AV Vmax (m/s) | 0.86–1.59 | 0.88–1.65 |
| AV area (cm2) | 1.98–4.84 | 1.57–3.68 |
| AV area/BSA (cm2/m2) | 1.09–2.50 | 0.98–2.21 |
| AV area/height (cm2/m) | 1.13–2.63 | 0.99–2.23 |
LNL, lower normal limit, ULN, upper normal limit, LVOT, left ventricular outflow tract, VTI, velocity–time integer, AV, aortic valve, AV PGmean, aortic valve mean pressure gradient, AV Vmax, aortic valve maximum velocity, BSA, body surface area.
Normal ranges for AVA and AV Doppler parameters according to age groups for both men and women
| Age | Men | Women | ||||
|---|---|---|---|---|---|---|
| 18–40 yrs | 41–65 yrs | >65 yrs | 18–40 yrs | 41–65 yrs | >65 yrs | |
| LNL UNL | LNL UNL | LNL UNL | LNL UNL | LNL UNL | LNL UNL | |
| LVOT diam (cm) | 1.90–2.59 | 1.87–2.55 | 1.78–2.50 | 1.69–2.28 | 1.69–2.24 | 1.64–2.21 |
| LVOT diam./BSA (cm/m2) | 0.99–1.40 | 0.94–1.41 | 0.91–1.42 | 0.98–1.41 | 0.96–1.40 | 0.97–1.47 |
| LVOT diam./height (cm/m) | 1.09–1.46 | 1.08–1.45 | 1.04–1.45 | 1.06–1.38 | 1.04–1.40 | 1.05–1.42 |
| LVOT VTI (cm) | 13.5–26.3 | 13.8–27.3 | 13.3–27.5 | 14.2–28.2 | 14.3–29.6 | 13.6–29.4 |
| AV VTI (cm) | 16.0–29.7 | 15.5–31.6 | 16.2–35.2 | 17.0–32.7 | 16.6–33.4 | 17.3–37.0 |
| LVOT VTI/AV VTI | 0.68–1.10 | 0.66–1.11 | 0.59–1.14 | 0.61–1.07 | 0.60–1.10 | 0.59–1.05 |
| AV PGmean (mmHg) | 1.64–4.70 | 1.52–4.97 | 1.42–5.54 | 1.69–5.06 | 1.56–5.34 | 1.75–6.19 |
| AV Vmax (m/s) | 0.88–1.53 | 0.87–1.64 | 0.81–1.64 | 0.89–1.57 | 0.88–1.64 | 0.91–1.73 |
| AV area (cm2) | 2.22–5.07 | 2.02–4.65 | 1.89–4.50 | 1.50–3.66 | 1.64–3.69 | 1.56–3.63 |
| AV area/BSA (cm2/m2) | 1.23–2.57 | 1.06–2.46 | 1.06–2.38 | 1.00–2.22 | 0.99–2.17 | 0.91–2.22 |
| AV area/Height (cm2/m) | 1.23–2.78 | 1.10–2.57 | 1.10–2.52 | 0.98–2.22 | 1.01–2.23 | 0.95–2.31 |
LNL, lower normal limit, UNL, upper normal limit, LVOT, left ventricular outflow tract, VTI, velocity–time integer, AV, aortic valve, AV PGmean, aortic valve mean pressure gradient, AV Vmax, aortic valve maximum velocity, BSA, body surface area.
Comparison between age groups
Figure 2 shows Box–Cox plots of AV area, Vmax, and PGmean as a function of age for men and women. Table 5 summarizes the differences in the AV parameters according to age. There was a significant decrease in AVA with age, in both men and women. After AVA indexing, these differences persisted, although statistical significance was lost in women. AV and LVOT VTI, AV Vmax and AV PGmean were higher in older subjects. LVOTd and DI values remained relatively stable irrespective of age.
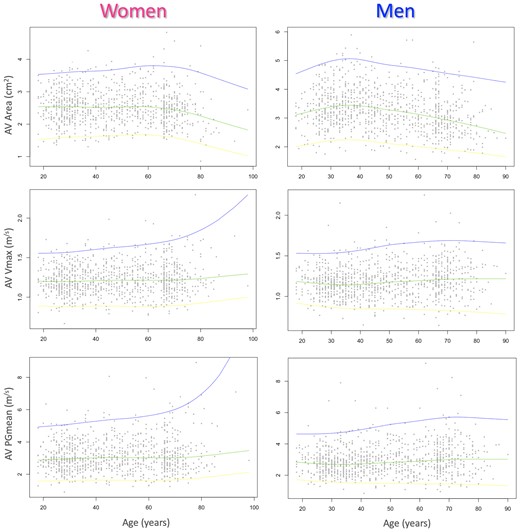
Box–Cox plots of AV area (top), vmax (middle), and pGmean (bottom) as a function of age for women (left) and men (right). Solid lines represent the 97.5th (top), 50th (middle), and 2.5th (bottom) percentiles.
Measurements of AVA and AV Doppler parameters across age groups for both men and women
| Age | Men | Women | ||||||
|---|---|---|---|---|---|---|---|---|
| 18–40 yrs | 41–65 yrs | >65 yrs | P | 18–40 yrs | 41–65 yrs | >65 yrs | P | |
| n | 398 | 333 | 246 | 396 | 291 | 239 | ||
| LVOT diam. (cm) | 2.23 ± 0.19 | 2.17 ± 0.18 | 2.12 ± 0.19 | ↟*^# | 1.95 ± 0.15 | 1.97 ± 0.15 | 1.94 ± 0.15 | ↟# |
| LVOT diam./BSA (cm/m2) | 1.18 ± 0.11 | 1.15 ± 0.13 | 1.16 ± 0.13 | ↟* | 1.20 ± 0.11 | 1.18 ± 0.11 | 1.20 ± 0.14 | ↟* |
| LVOT diam./height (cm/m) | 1.27 ± 0.09 | 1.26 ± 0.10 | 1.25 ± 0.11 | ↟^ | 1.21 ± 0.08 | 1.23 ± 0.09 | 1.23 ± 0.10 | ↟*^ |
| LVOT VTI (cm) | 19.3 ± 3.2 | 19.8 ± 3.4 | 20.4 ± 3.7 | ↟*^ | 20.1 ± 3.5 | 20.7 ± 3.8 | 20.7 ± 4.1 | ↟*^ |
| AV VTI (cm) | 22.1 ± 3.7 | 22.9 ± 4.1 | 24.5 ± 4.8 | ↟*^# | 23.9 ± 3.8 | 24.9 ± 4.6 | 25.4 ± 4.9 | ↟*^ |
| LVOT VTI/AV VTI | 0.88 ± 0.11 | 0.88 ± 0.12 | 0.84 ± 0.13 | ↟^# | 0.85 ± 0.11 | 0.84 ± 0.12 | 0.83 ± 0.12 | ↟^ |
| AV PGmean (mmHg) | 2.82 ± 0.82 | 2.96 ± 0.98 | 3.13 ± 1.07 | ↟*^ | 3.06 ± 0.87 | 3.19 ± 1.03 | 3.27 ± 1.16 | ↟^ |
| AV Vmax (m/s) | 1.16 ± 0.17 | 1.19 ± 0.20 | 1.22 ± 0.21 | ↟*^ | 1.21 ± 0.17 | 1.23 ± 0.20 | 1.25 ± 0.21 | ↟^ |
| AV area (cm2) | 3.46 ± 0.71 | 3.27 ± 0.70 | 2.99 ± 0.67 | ↟*^# | 2.55 ± 0.52 | 2.57 ± 0.53 | 2.45 ± 0.56 | ↟^# |
| AV area/BSA (cm2/m2) | 1.81 ± 0.34 | 1.73 ± 0.37 | 1.63 ± 0.35 | ↟*^# | 1.56 ± 0.30 | 1.54 ± 0.31 | 1.52 ± 0.36 | |
| AV area/height (cm2/m) | 1.97 ± 0.39 | 1.90 ± 0.39 | 1.75 ± 0.38 | ↟*^# | 1.58 ± 0.30 | 1.60 ± 0.32 | 1.56 ± 0.35 | |
LVOT, left ventricular outflow tract, VTI, velocity–time integer, AV, aortic valve, AV PGmean, aortic valve mean pressure gradient, AV Vmax, aortic valve maximum velocity, BSA, body surface area. P < 0.05 by ↟ ANOVA; t-test for: * 18–40 vs. 41–65, ^ 18–40 vs. > 65, # 41–65 vs. > 65
Comparison between races
Table 6 shows the differences in the measured parameters according to race. DI was the only parameter that did not show significant differences between races. LVOTd was significantly larger in white men and significantly smaller in Asian women when compared to individuals of other races from the same sex. AV VTI, LVOT VTI and AVA were significantly smaller in Asian subjects in both sexes. In men’s cohort, AVA was significantly larger in whites than in black and Asian individuals.
Measurements of AVA and AV Doppler parameters according to race for men and women
| Men | Women | |||||||
|---|---|---|---|---|---|---|---|---|
| Asian | Black | White | P | Asian | Black | White | P | |
| n | 413 | 94 | 411 | 395 | 87 | 387 | ||
| LVOT diam. (cm) | 2.15 ± 0.18 | 2.15 ± 0.19 | 2.23 ± 0.20 | ↟^# | 1.93 ± 0.15 | 1.97 ± 0.17 | 1.98 ± 0.14 | ↟*^ |
| LVOT diam./BSA (cm/m2) | 1.21 ± 0.12 | 1.11 ± 0.12 | 1.13 ± 0.10 | ↟*^ | 1.24 ± 0.12 | 1.13 ± 0.13 | 1.16 ± 0.10 | ↟*# |
| LVOT diam./height (cm/m) | 1.27 ± 0.10 | 1.23 ± 0.10 | 1.26 ± 0.10 | ↟*^# | 1.23 ± 0.09 | 1.21 ± 0.10 | 1.21 ± 0.09 | ↟^ |
| LVOT VTI/AV VTI | 0.87 ± 0.13 | 0.87 ± 0.12 | 0.87 ± 0.12 | 0.83 ± 0.12 | 0.85 ± 0.10 | 0.85 ± 0.12 | ||
| AV VTI (cm) | 22.0 ± 4.0 | 23.7 ± 4.3 | 23.6 ± 4.4 | ↟*^ | 24.0 ± 4.5 | 24.7 ± 4.3 | 25.0 ± 4.3 | ↟^ |
| LVOT VTI (cm) | 18.9 ± 3.2 | 20.5 ± 3.4 | 20.3 ± 3.5 | ↟*^ | 19.8 ± 3.9 | 20.9 ± 3.5 | 21.0 ± 3.7 | ↟*^ |
| AV PGmean (mmHg) | 2.79 ± 0.89 | 3.05 ± 1.01 | 3.07 ± 1.00 | ↟*^ | 3.11 ± 1.07 | 3.14 ± 1.02 | 3.20 ± 0.94 | |
| AV Vmax (m/s) | 1.15 ± 0.18 | 1.22 ± 0.21 | 1.21 ± 0.20 | ↟*^ | 1.21 ± 0.21 | 1.24 ± 0.21 | 1.23 ± 0.17 | |
| AV area (cm2) | 3.16 ± 0.68 | 3.21 ± 0.75 | 3.43 ± 0.74 | ↟^# | 2.44 ± 0.52 | 2.62 ± 0.54 | 2.61 ± 0.52 | ↟*^ |
| AV area/BSA (cm2/m2) | 1.77 ± 0.37 | 1.65 ± 0.38 | 1.73 ± 0.35 | ↟*# | 1.57 ± 0.33 | 1.49 ± 0.32 | 1.53 ± 0.30 | ↟* |
| AV area/height (cm2/m) | 1.87 ± 0.39 | 1.83 ± 0.41 | 1.94 ± 0.39 | ↟^# | 1.56 ± 0.32 | 1.61 ± 0.33 | 1.60 ± 0.31 | |
LVOT, left ventricular outflow tract, VTI, velocity–time integer, AV, aortic valve, AV PGmean, aortic valve mean pressure gradient, AV Vmax, aortic valve maximum velocity, BSA, body surface area. P < 0.05 by ↟ ANOVA; t-test for: * Asian vs. Black, ^ Asian vs. White, # Black vs. White
Table 7 shows summary of the results of the reproducibility analysis. Variability was <10% for all parameters except AV PGmean, which was slightly higher at 10.5%. Intraclass correlations were >0.80 for all parameters except AV Vmax, which was slightly lower at 0.74.
Measurements variability of AV Doppler parameters in a random sample of 50 study subjects (see text for details)
| % Variability | ICC | |
|---|---|---|
| LVOT diam | 2.9 ± 2.2 | 0.93 |
| LVOT VTI | 3.6 ± 4.7 | 0.96 |
| AV VTI | 5.1 ± 4.9 | 0.90 |
| LVOT VTI/AV VTI | 5.0 ± 4.6 | 0.81 |
| AV PGmean | 10.5 ± 9.9 | 0.84 |
| AV Vmax | 6.8 ± 7.5 | 0.74 |
| AV area | 7.6 ± 6.7 | 0.87 |
| % Variability | ICC | |
|---|---|---|
| LVOT diam | 2.9 ± 2.2 | 0.93 |
| LVOT VTI | 3.6 ± 4.7 | 0.96 |
| AV VTI | 5.1 ± 4.9 | 0.90 |
| LVOT VTI/AV VTI | 5.0 ± 4.6 | 0.81 |
| AV PGmean | 10.5 ± 9.9 | 0.84 |
| AV Vmax | 6.8 ± 7.5 | 0.74 |
| AV area | 7.6 ± 6.7 | 0.87 |
ICC, intraclass correlation coefficient.
Discussion
Back in 1950, invasive haemodynamic assessment was the main method for understanding and assessing the pathophysiology of cardiovascular conditions.16 Using the Torricelli model of non-turbulent flow through an orifice and based on catheterization data, Gorlin and Gorlin published their formula for AVA calculation in 1951.17 Notably, although two coefficients (orifice contraction and velocity loss) were necessary for this formula, the value of these has never been calculated, and instead, the authors based their calculations on empirical constants assigned to each valve (for the AVA, for example, they used a constant of 1).17 Subsequent research suggested that the AVA derived from the Gorlin equation was not constant but varied with flow conditions,18,19 such as under the effects of inotropic drugs20 or during exercise.21
In the late 60s, the advent of Doppler echocardiography provided new insights into cardiac physiology, becoming an attractive non-invasive approach for the assessment of cardiac haemodynamics.22 Based on the principle of conservation of mass and the information provided by TTE measurements, the CE became the preferred method to calculate AVA for diagnosis and grading of AS,3,4 supported by multiple studies that showed a good correlation between this equation and the Gorlin formula.17,23–25
While evidence of AV obstruction and mild AS are defined by an AV Vmax ≥ 2.5 m/s, echocardiographic criteria for severe AS require AV PGmean > 40 mm Hg, AV Vmax > 4 m/s, an AVA < 1.0 cm2, or a BSA indexed AVA (AVAi) < 0.6 cm2/m2.3,4 However, echocardiographic assessment of AS is not always so straightforward, as it includes sometimes technically challenging measurements and complex formulas, potentially leading to accumulated errors. Together with the technical and mathematical issues, these inconsistencies are aggravated by the lack of clear reference values, and by the assumption that ‘normality’ can be uniformly defined for all individuals. Our findings in a large population of international healthy adults refute this concept by showing differences in normative values of all AS-related parameters among men and women, age groups and races.
Differences in AVA
In the present study, statistically significant differences in AVA between men and women were noted in all age groups. Although one might suggest that these differences could be within measurement variability, our findings also demonstrate the clinical significance of these differences. Of note, 13.5% of women in our study had AVA values that were consistent with mild AS based on the guidelines, although their Doppler parameters were within the normal ranges established in this study. Interestingly, 53% of these women were Asian, in accordance with our observations on race-related measurements in AVA area. The unreliability of focusing excessively on AVA to grade AS has already been described by Baumgartner et al.26 Our findings are in agreement with Minners et al.27, who reported that small AVA values may overestimate AS and that AVA values below moderate and severe AS cut-offs might be present in patients without AV disease.
Differences in LVOT diameter
Another important source of error in the calculation of AVA by the CE is the effect of inaccurate measurements of the LVOTd and the assumption that LVOT shape is circular. While intra- and inter-observer variability of AV and LVOT VTI has been estimated at 3–4%, the variability for the LVOTd measurements ranges from 5 to 8%.28
Our study showed statistically significant sex-related differences in LVOTd, with LLN as small as 1.6 cm in older women, and ULN as large as 2.6 in young men. Similar to the Doppler Echocardiographic Measurements in Normal Chinese Adults study results,29 the LVOTd measurements did not show major differences between age groups in both men and women, suggesting that any changes in SV could be quantitated with changes in LVOT VTI alone without the need to measure SV with 2D TTE, which is time-consuming and subject to errors. Moreover, the quality of the information provided by our study relies on the fact that the measurements were performed in core laboratories and according to standardized protocols, addressing some of the previously expressed concerns.
Differences in DI
Although the DI is an additional parameter that does not require LVOT measurements and might be alternatively used to assess AS severity when disparities between measurements exist,3,4 Michelena et al.30 have noticed that the current AVA and DI severity cut-offs might be more consistent for patients with large LVOTd (≥23 mm) than for those with average or small ones (17–19 mm). We found significant differences for mean DI values between men and women, and although this parameter remained relatively stable over age groups, absolute differences between the older and the middle and young age groups were higher in men than in women. Interestingly, this was the only parameter with no significant differences between races for both men or women.
Differences in AVAi
Although guidelines proposed an AVAi cut-off value of 0.6 cm2/m23,4 to address the differences attributable to BSA, a new cut-off value of 0.5 cm2/m2 has also been proposed, as it corresponded to a peak velocity of 4 m/s31 and was able to identify a group of patients with increased cardiovascular mortality during a two-year follow-up.32
Our findings showed that the statistically significant differences in AVA between men and women, persisted after BSA indexing. However, the AVA decrease with aging groups was lost in women once adjusted to BSA (AVAi).
Differences in Doppler parameters
As PGmean and AV Vmax are flow dependent parameters, they tend to be underestimated or overestimated depending on the flow status. Although the indexed SV cut-point of 35 mL/m2 is used as a general surrogate of low-flow status, it has also been suggested that, in the setting of severe AS, these cut-off values should be different in men (<40 mL/m2) than in women (<32 mL/m2).32 Interestingly, in our cohort of normal subjects, 80% men and 58% women had indexed SV below these cut-offs, respectively. Recently reported normative values of CO and SV showed that BSA indexation of these parameters did not reduce the disparities on sex- and age-related differences, having potential implications in the interpretation and management of the low-flow AS spectrum.10 Similarly, our study showed statistically significant differences in LVOT VTI, AV VTI, AV Vmax, and AV meanPG according to sex, with higher values in women for all age groups. Interestingly, neither AV Vmax nor AV PGmean showed significant race-related differences in women. The ULN for AV Vmax was below 2 m/s for both sexes and all age groups, in accordance with the currently used cut-off value.3,4
Limitations
While the WASE study was designed to include multiple regions around the world, certain areas remained underrepresented in this study. Importantly, specific populations not explicitly represented in this study, such as exceptionally tall individuals, may have different normal values from those reported here.33 Moreover, there was a smaller number of individuals of black race analyzed, so conclusions regarding race-related differences should take this into consideration. It has been proposed that LVOTd measurement should be performed at the aortic annulus level instead of 0.5–1 cm into the LVOT, as the annulus varies less with the cardiac cycle, and is more accurate and reproducible.34 Although this might be seen as a limitation of the measurements performed in this study, we decided to follow current guidelines recommendations, understanding that each technique has its own strengths and limitations, focusing more on an integral multi-parameter and patient-centred approach. As velocities distal to a stenosis (V2) are much higher than that proximal to it (V1), it might seem inappropriate to use a simplified Bernoulli equation to measure the AV meanPG in the absence of a stenotic lesion, and the following equation should have been used instead: ΔP = (V22–V12). Moreover, we acknowledge that the LVOT area estimated by 2D echocardiography assumes that the LVOT has a rounded shape, which is inaccurate and could only be properly addressed by 3D measurements. 3D acquisition of the LVOT was not part of this study. Also, transvalvular aortic flow, and thus AVA, are known to be dependent on LV function and loading conditions (such as aortic pressure). While the potential impact of hypertension on our results is unclear, only a small percentage of the study subjects had systolic blood pressure >140 mmHg at the time of imaging. Finally, the extent to which upper septal hypertrophy, a common finding, could have affected our LVOT measurements is difficult to estimate; however, we do not believe that it significantly affected the reported normal ranges.
Conclusion
Our results from the WASE Study for Normative Values of AVA and AV Doppler measurements provide reference values for the most used echocardiographic parameters for AV assessment, showing the presence of relevant sex-, age-, and race-related differences, which persisted after BSA indexing. Guidelines and clinical practice should consider these findings because of the direct implications that they might have on AS diagnostic criteria. Specifically, the implementation of this information into clinical practice should involve development of specific normative values for each ethnic group using standardized methodology.
Additional WASE investigators
Argentina: A.D.P., Centro Privado de Cardiologia, Tucumán, Argentina; Eduardo Filipini, Universidad Nacional de la Plata, Buenos Aires, Argentina; Australia: Agatha Kwon and Samantha Hoschke-Edwards, Heart Care Partners, Queensland, Australia; Brazil: Tania Regina Afonso, Albert Einstein Hospital, Sao Paulo, Brazil; Canada: Babitha Thampinathan and Maala Sooriyakanthan, Toronto General Hospital, University of Toronto, Canada; China: M.Z., Y.W., and Yu Zhang, Qilu Hospital of Shandong University, Jinan, China; Tiangang Zhu and Zhilong Wang, Peking University People's Hospital, Beijing, China; Lixue Yin and Shuang Li, Sichuan Provincial People's Hospital, Sichuan, China; India: R. Alagesan, Madras Medical College, Chennai, India; S. Balasubramanian, Madurai Medical College, Madurai, India; R.V.A. Ananth, Jeyalakshmi Heart Centre, Madurai, India; Manish Bansal, Medanta Heart Institute, Medanta, Haryana, India; Iran: Azin Alizadehasl, Rajaie Cardiovascular Medical Center, IUMS, Tehran, Iran; Italy: Luigi Badano, University of Milano-Bicocca, and Istituto Auxologico Italiano, IRCCS, Milan, Italy; Eduardo Bossone, Davide Di Vece and Michele Bellino, University of Salerno, Salerno, Italy; Japan: Tomoko Nakao, Takayuki Kawata, Megumi Hirokawa, and Naoko Sawada, MD, The University of Tokyo, Tokyo, Japan; Yousuke Nabeshima, MD, University of Occupational and Environmental Health, Kitakyushu, Japan; Republic of Korea: Hye Rim Yun and Ji-won Hwang, Samsung Medical Center, Seoul, Republic of Korea.
Data availability
Data used in this study will not be publicly available.
References
Author notes
Conflict of interest: M.S., M.B. and N.H. are employees of TOMTEC Imaging Systems. No other direct conflicts of Interest related to this study have been reported by any of the authors.
