


Abstract
Echocardiographic studies suggest that strain is related to myocardial fibrosis (MF) and ventricular arrhythmias (VA) in hypertrophic cardiomyopathy (HCM) patients. Cardiac magnetic resonance feature tracking (CMR-FT) also allows strain analysis, but little is known whether it provides incremental value to late gadolinium enhancement imaging (LGE). This study aimed to explore the relationship between CMR-FT-derived strain parameters and histopathology MF and VA and its incremental value to LGE in obstructive HCM (HOCM) patients undergoing septal myectomy.
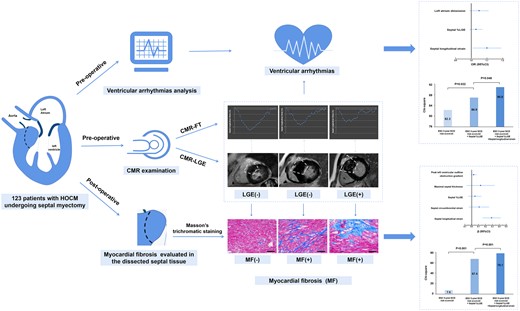
One hundred and twenty-three symptomatic HOCM patients underwent CMR examination, followed by septal myectomy. The abnormally increased histological MF was defined as higher than the mean + 2 standard deviation (SD) of nine control autopsy subjects who had no history of cardiovascular disease. Septal strain parameters and septal LGE were evaluated at the site of surgical myectomy. Among HOCM patients without LGE, septal circumferential (P = 0.003), longitudinal (P = 0.001), and radial (P = 0.02) strains were significantly impaired in patients with increased histological MF than those without. Histological MF was significantly associated with septal circumferential strain (r = 0.32, P < 0.001), septal longitudinal strain (r = 0.42, P < 0.001), and septal radial strain (r = −0.27, P = 0.003). On multivariate analysis, septal longitudinal strain was independently associated with histological MF [β, 0.19 (0.05–0.34); P = 0.01], and VA [odds ratio, 1.10 (1.01–1.19); P = 0.02]. Moreover, septal longitudinal strain was incremental to septal %LGE in detecting increased MF (P = 0.001) and VA (P = 0.048).
Septal longitudinal strain at CMR is independently related to histological MF and occurrence of VA in HOCM patients. Moreover, it provides incremental value over LGE in detecting increased MF and VA.
CMR-FT-derived septal longitudinal strain is independently and significantly associated with histological MF and VA in patients with HOCM and provides incremental value over LGE.
See the editorial comment for this article ‘Longitudinal strain: on its way to be included in the sudden cardiac death risk models of hypertrophic cardiomyopathy?’, by J. Abecasis and N. Cardim, https://doi.org/10.1093/ehjci/jeac052.
Introduction
Myocardial fibrosis (MF) is a pathological entity associated with extracellular matrix remodelling that can lead to left ventricular (LV) systolic and diastolic dysfunction,1 ventricular arrhythmias (VA), and sudden cardiac death (SCD) in patients with hypertrophic cardiomyopathy (HCM).2,3 Late gadolinium enhancement cardiac magnetic resonance (CMR-LGE) imaging has become the reference standard for non-invasive assessment of myocardial scarring.4 Previous studies also revealed that CMR-LGE can detect MF in most HCM patients and that it is associated with the occurrence of VA.5–7 However, nearly half of HCM patients do not have LGE at CMR,8,9 a substantial proportion of obstructive HCM (HOCM) patients showing significant fibrosis in their myectomy specimens had no visible septal-LGE, indicating the sub-optimal accuracy of such visual assessments.
The myocardial strain is a sensitive and early marker of contractile dysfunction10 and it is correlated with poor cardiac outcomes in patients with HCM.11 Several echocardiographic studies proved that myocardial strain is related with MF and VA in HOCM patients.12–15 Recently, CMR feature tracking (CMR-FT) has been available to evaluate LV myocardial deformation with excellent spatial resolution and boundary tracking.16 This technique identified global and regional sub-clinical myocardial dysfunction in patients with HCM despite normal LV ejection fraction (LVEF).17 However, available data regarding the relationship between CMR-FT-derived strain and histological MF and VA, and especially its incremental value to conventional CMR-LGE, are scarce.
The purpose of this study was to investigate whether the strain assessed by CMR-FT related to histological MF and VA in HOCM patients. The secondary objective was to examine whether CMR-FT provides incremental value to conventional CMR-LGE for indicating MF and VA. In present study, we enrolled a cohort of HOCM patients who underwent myectomy with dissected myocardial tissue available for histopathological examination.
Methods
Patients cohort
This study included patients with HCM having symptomatic LV outflow tract (LVOT) obstruction, preserved LVEF, and no coronary artery disease on angiography between January 2018 and May 2020. These patients underwent CMR examination (generally within 30 days) and Holter monitoring (generally within 7 days) prior to surgical myectomy. All patients were in sinus rhythm at the time of enrolment. The diagnosis for HCM followed established criteria with the definition of non-dilated and hypertrophied LV in the absence of other diseases that could result in a similar magnitude of hypertrophy.2 All patients with HCM met the criteria for septal reduction therapy, with resting LVOT gradients ≥30 or ≥50 mmHg during exercise, and New York Heart Association functional class ≥3 despite optimal medical treatment.2 Patients with LVEF < 55%, angiographic evidence of obstructive coronary artery disease (>30% occlusion in at least one epicardial coronary artery), severe valvular disease, history of myocardial infarction, or the presence of pacemakers, implantable cardioverter-defibrillators, or aneurysm clips precluding CMR were excluded from the study. Thirty age- and gender-matched healthy subjects were recruited as controls. In addition, to serve as baseline reference for quantitative histologic analyses and determination of increased MF, LV septal wall specimens were obtained from autopsy in nine subjects (six males, three females; mean age 45.4 ± 14.3 years) who died of non-cardiac causes and had no history of cardiovascular disease.
This study was approved by the Institutional Review Board of the Fuwai Hospital. Written informed consent was obtained from each patient.
CMR protocol
All CMR studies were performed using a 3.0 T MRI scanner (Ingenia, Philips, the Netherlands) with retrospective ECG gating and an 8-channel cardiac coil. MRI studies were transferred to an offline workstation with the commercial post-processing software Argus (version VA60C; Siemens) for blinded analysis. Dimensions of cardiac chambers (left atrial dimension and LV end-diastolic diameter), volumes of LV that are indexed to the body surface area (LV end-diastolic volume index and LV end-systolic volume index), LV mass index, and LVEF were measured using standard volumetric techniques and analysed with the above-mentioned commercially available software. The LV was assessed according to the standards of American Heart Association 16-segment model. To match the site of myectomy, we only evaluated the basal-anteroseptal and mid-anteroseptal segments.4 Maximal septal thickness was defined as the greater linear dimension at basal-anteroseptal and mid-anteroseptal segments. The presence of septal LGE as a categorical value was visually assessed at basal-anteroseptal and mid-anteroseptal segments independently by the radiologist blinded to the clinical data of patients. LGE quantification was performed using a commercially available software (CVI 42, Circle Cardiovascular Imaging Inc., Calgary, Canada). LGE was defined as areas with adjusted grey-scale threshold ≥5 standard deviation (SD) above the mean of normal myocardium after fine-tuning by operator to reduced false positivity. Septal %LGE was defined as LGE volume fraction (LGE volume/myocardial volume) at basal-anteroseptal and mid-anteroseptal segments.
Strain analysis
LV deformation parameters were analysed using a commercial semi-automated post-processing software (QStrain, Medis Suite 3.1, Leiden, the Netherlands). Endocardial and epicardial LV borders were manually drawn in the 2-, 3-, 4-chamber, and short-axis view of end-diastolic and the end-systole phase. The longitudinal strains were obtained by tracking the long horizontal axis cines whereas the circumferential and radial strains were derived from the short-axis cines on the standard CMR steady-state free precession sequence. Strain curves for each segment were generated. For comparison with histopathologic variables, the septal radial, circumferential, and longitudinal strains were defined as the mean of peak strain from the basal-anteroseptal and mid-anteroseptal segments.
Ventricular arrhythmias and risk scores
VA were registered prior to intervention and defined by at least one of the following criteria: (i) prior cardiac arrest with documented VA, (ii) documented VT (sustained or non-sustained) by 24–48 h Holter monitor defined as three or more consecutive ventricular beats at a rate of 120 beats/min,18 (iii) unexplained syncope (suspected arrhythmogenic syncope or syncope during exercise).13,14 The 5-year SCD risk score (%) was calculated according to the HCM guidelines by the 2014 European Society of Cardiology (ESC).3
Histopathology
All septal myocardial specimens were fixed in 10% of buffered formalin and then embedded in paraffin. MF was evaluated by Masson’s trichromatic staining.19 Four images of every section were acquired with a projection microscope (×200). Subsequently, the image analysis was performed using Image-Pro Plus 6.0 image analysis software (Media Cybernetics Inc., Buckinghamshire, UK). The extent of MF (%) was calculated using proportion of collagen specific staining in the total myocardial area of each myocardial sample. Sub-endocardial fibrosis was excluded from the analysis. For each patient, the amount of MF was considered abnormally increased (MF+) if the proportion of fibrosis component was higher than the mean + 2 SD of the nine subjects who died of non-cardiac causes and had no history of cardiovascular disease.20
Statistics analysis
All continuous variables were reported as means ± SDs, and categorical variables were represented as numbers and percentages. Comparisons of continuous variables between the two groups were performed using unpaired Student’s t-test or Mann–Whitney U test as appropriate. Comparison of three groups of continuous variables was done using the one-way analysis of variance (ANOVA) with post hoc LSD tests or Kruskal–Wallis test was applied as appropriate. Frequencies were compared using the χ2 test or Fisher’s exact test. Correlations between histological MF and septal strain parameters were assessed by Spearman correlation analysis. Univariate regression analyses were used to identify association between dependent variables and various potential detectors. Multivariable analyses were performed including variables with P values <0.05 from the univariate analyses. The Likelihood ratio test was used to evaluate the incremental value of CMR-FT strain parameters over the ESC 5-year SCD risk score3 and %LGE in detecting abnormal histological MF and VA. The ability of CMR-FT-derived strain parameters to differentiate between patients with abnormal histological MF and VA were assessed using the area under the curve (AUC) by receiver operating characteristic (ROC) analyses. Optimal sensitivity and specificity were defined as the value from the ROC curve that is closest to the upper left corner. Reproducibility was expressed by the intra-class correlation coefficient (ICC). Two-tailed P-values <0.05 were considered statistically significant. All statistical analyses were performed using SPSS Statistics, version 24.0 (IBM, SPSS Statistics) and MedCalc software (version 12.3.0.0, Mariakerke, Belgium).
Results
A total of 133 patients with HOCM were enrolled in the study. Ten of these patients (7.5%) were excluded because of poor CMR imaging quality. The final analysis was based on data from the remaining 123 patients.
Patient characteristics
The baseline characteristics of these 123 patients (54.5% men, 46.25 ± 14.17 years) and the 30 healthy controls (70% men, 44.63 ± 9.47 years), as well as the study group stratified by the presence of septal LGE and septal histological MF value, were illustrated in Table 1. According to the criteria mentioned above, septal LGE was detected in 60 patients (48.8%) and all these patients exhibited increased histological MF (11.54 ± 6.15%, LGE+MF+ group). The remaining 63 patients (51.2%) without septal LGE were divided into two groups: 36 (29.3%) patients without increased histological MF (3.82 ± 1.53%) group (LGE−MF− group) and 27 (22.0%) patients with increased histological MF (10.81 ± 4.47%) group (LGE−MF+ group, Figure 1).
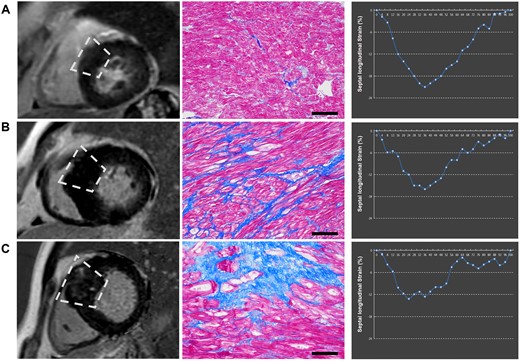
Examples of the presence of LGE, extent of histopathological MF, and septal longitudinal strain. Three cases displaying vary degree of histopathological fibrosis. (A) LGE(−)MF(−). The case showed the absence of LGE and the septal strain parameters at the normal range. (B) LGE(−)MF(+). The case showed the absence of LGE but the septal strain parameters impaired. (C) LGE(+)MF(+). The case showed the presence of LGE and the septal strain parameters impaired. LGE, late gadolinium enhancement; MF, myocardial fibrosis.
Baseline characteristics in control and HCM patients as well as their subgroups stratified by the presence of LGE and MF
| Control (n = 30) | All HCM (n = 123) | P value* | HCM/LGE(−) (n = 63) | HCM/LGE(+) (n = 60) | P-value# | ||
|---|---|---|---|---|---|---|---|
| MF(−) (n = 36) | MF(+) (n = 27) | MF(+) (n = 60) | |||||
| Age (years) | 44.63 ± 9.47 | 46.25 ± 14.17 | 0.45 | 45.53 ± 14.34 | 49.85 ± 13.42 | 45.07 ± 14.36 | 0.33 |
| Male gender | 21 (70.0%) | 67 (54.5%) | 0.12 | 25 (69.4%) | 10 (37.0%)a | 32 (53.3%) | 0.04 |
| Body surface area (m2) | 1.79 ± 0.18 | 1.78 ± 0.20 | 0.76 | 1.81 ± 0.18 | 1.74 ± 0.20a | 1.78 ± 0.20 | 0.35 |
| MF (%) | 9.12 ± 5.92 | 3.82 ± 1.53 | 10.81 ± 4.47a | 11.54 ± 6.15a | <0.001 | ||
| Peak LVOT gradient (mmHg) | 87.61 ± 24.58 | 82.95 ± 23.70 | 87.29 ± 21.91 | 90.55 ± 26.12 | 0.34 | ||
| ESC 2014, 5-year SCD risk score (%) | 4.54 ± 3.23 | 2.96 ± 1.24 | 4.64 ± 2.96a | 5.44 ± 3.79a | 0.001 | ||
| Family history of SCD (%) | 10 (8.1%) | 2 (5.6%) | 3 (11.1%) | 5 (8.3%) | 0.73 | ||
| NYHA Class III or IV (%) | 41 (33.3%) | 10 (27.8%) | 9 (33.3%) | 22 (36.7%) | 0.78 | ||
| Family history of HCM (%) | 15 (12.2%) | 3 (8.3%) | 2 (7.4%) | 10 (16.7%) | 0.34 | ||
| Smoker | 44 (35.8%) | 13 (36.1%) | 7 (25.9%) | 24 (40.0%) | 0.45 | ||
| Dyspnoea | 94 (76.4%) | 27 (75.0%) | 20 (74.1%) | 47 (78.3%) | 0.89 | ||
| Palpitations | 31 (25.2%) | 8 (22.2%) | 9 (33.3%) | 14 (23.3%) | 0.55 | ||
| Hypertension | 32 (26.0%) | 6 (16.7%) | 9 (33.3%) | 17 (28.3%) | 0.28 | ||
| Diabetes | 11 (8.9%) | 4 (11.1%) | 1 (3.7%) | 6 (10.0%) | 0.56 | ||
| Hyperlipidaemia | 41 (33.3%) | 11 (30.6%) | 10 (37.0%) | 20 (33.3%) | 0.87 | ||
| Atrial fibrillation | 18 (14.6%) | 4 (11.1%) | 1 (3.7%) | 13 (21.7%)b | 0.07 | ||
| Medication | |||||||
| Βeta-receptor antagonist | 100 (81.3%) | 26 (72.2%) | 24 (88.9%) | 50 (83.3%) | 0.21 | ||
| Calcium channel blocker | 24 (19.5%) | 7 (19.4%) | 6 (22.2%) | 11 (18.3%) | 0.92 | ||
| Amiodarone | 21 (17.1%) | 3 (8.3%) | 4 (14.8%) | 14 (23.3%) | 0.16 | ||
| ACE inhibitor/ARB | 7 (5.7%) | 2 (5.6%) | 1 (3.7%) | 4 (6.7%) | 0.86 | ||
ACEI/ARB, angiotensin-converting enzyme inhibitor or angiotensin receptor blocker; HCM, hypertrophic cardiomyopathy; LGE, late gadolinium enhancement; LVOT, left ventricular outflow obstruction; MF, myocardial fibrosis.
Comparison between HCM and control.
Comparison among LGE(−)MF(−), LGE(−)MF(+), and LGE(+)MF(+).
P < 0.05 when compared with LGE(−)MF(−).
P < 0.05 when compared with LGE(−)MF(+).
Compared with the healthy controls, patients with HOCM showed no significant differences with regard to age, gender, and body surface area (BSA). In the subgroup analysis, LGE−MF+ subjects predominantly were female and showed significantly lower BSA as compared with LGE−MF− subjects (P < 0.05). LGE−MF− subjects showed significantly lower ESC 5-year SCD risk score as compared with LGE−MF+ and LGE+MF+ subjects (P < 0.05). More patients had a history of atrial fibrillation among LGE+MF+ subjects than among the LGE−MF+ subjects (P < 0.05). No significant difference was observed in MF values between LGE−MF+ subjects and LGE+MF+ subjects. The prevalence of other clinical data was also not significantly different among all the groups.
Myocardial function analysis
The intra-observer and inter-observer ICC obtained for CMR-FT-derived septal strain parameters were as follows: septal radial strain, 0.81 and 0.75; septal circumferential strain, 0.92 and 0.89; septal longitudinal strain 0.90 and 0.86. Both septal circumferential strain and septal longitudinal strain showed good to excellent inter-observer and intra-observer agreement.
Table 2 shows conventional and septal strain parameters derived from CMR in HOCM and control groups and in the HOCM group stratified by the presence of septal LGE and septal histological MF. In the subgroup analysis of HOCM patients, LGE+MF+ subjects had significantly higher maximum septal thickness and left atrium dimension than LGE−MF− subjects (P < 0.001 and P = 0.01, respectively). No other conventional parameters showed significant difference among the three cohorts of HOCM patients (P > 0.05). While in the analysis of septal strain parameters, both LGE−MF+ and LGE+MF+ subjects had significantly lower septal circumferential strain (P = 0.003 and P < 0.001, respectively), septal longitudinal strain (P = 0.001 and P < 0.001, respectively) and septal radial strain (P = 0.02 and P < 0.001, respectively) compared with LGE−MF− subjects (Figure 2). Consistent with the comparable MF between LGE−MF+ and LGE+MF+ groups, the strains parameters between these two groups are also non-significant except for a slight difference in septal longitudinal strain (P = 0.037).
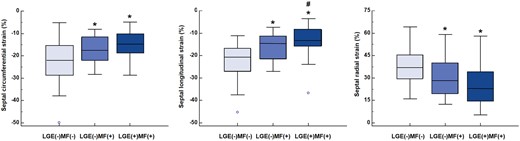
Comparisons of septal strain parameters among LGE(−)MF(−), LGE(−)MF(+), and LGE(+)MF(+). *P < 0.05 vs. LGE(−)MF(−), #P < 0.05 vs. LGE(−)MF(+). LGE, late gadolinium enhancement; MF, myocardial fibrosis.
CMR conventional and septal deformation parameters in control and HCM patients as well as their subgroups stratified by the presence of LGE and MF
| Control (n = 30) | All HCM (n = 123) | P-value* | HCM/LGE(−) (n = 63) | HCM/LGE(+) (n = 60) | P-value** | ||
|---|---|---|---|---|---|---|---|
| MF(−) (n = 36) | MF(+) (n = 27) | MF(+) (n = 60) | |||||
| LV mass index (g/m2) | 58.09 ± 10.44 | 90.50 ± 29.91 | <0.001 | 86.28 ± 30.35 | 89.99 ± 28.64 | 93.25 ± 30.37 | 0.54 |
| Maximum septal thickness (mm) | 9.84 ± 2.11 | 24.37 ± 5.25 | <0.001 | 21.64 ± 5.19 | 24.15 ± 5.14 | 26.12 ± 4.65a | <0.001 |
| Left atrium dimension (mm) | 30.33 ± 4.65 | 41.81 ± 8.83 | <0.001 | 39.16 ± 9.82 | 41.36 ± 9.77 | 43.60 ± 7.37a | 0.06 |
| LV end-diastolic diameter (mm) | 48.08 ± 4.19 | 45.21 ± 4.25 | 0.001 | 45.58 ± 3.86 | 45.52 ± 4.08 | 44.85 ± 4.58 | 0.66 |
| LV ejection fraction (%) | 61.37 ± 4.34 | 65.41 ± 8.21 | 0.01 | 65.61 ± 10.89 | 66.46 ± 6.59 | 64.82 ± 7.00 | 0.68 |
| LV end-diastolic volume index (mL/m2) | 71.43 ± 14.72 | 82.08 ± 18.98 | 0.005 | 80.02 ± 16.94 | 84.50 ± 25.25 | 82.23 ± 16.98 | 0.65 |
| LV end-systolic volume index (mL/m2) | 26.28 ± 7.52 | 30.53 ± 13.82 | 0.11 | 27.94 ± 10.72 | 31.38 ± 12.90 | 31.71 ± 15.74 | 0.41 |
| LV Feature Tracking | |||||||
| Septal circumferential strain (%) | −26.91 ± 6.68 | −17.60 ± 7.48 | <0.001 | −22.63 ± 9.09 | −16.93 ± 5.68a | −14.87 ± 5.41a | <0.001 |
| Septal longitudinal strain (%) | −26.49 ± 8.00 | −16.34 ± 7.39 | <0.001 | −22.16 ± 7.47 | −15.89 ± 5.67a | −13.04 ± 5.83ab | <0.001 |
| Septal radial strain (%) | 46.49 ± 11.44 | 29.91 ± 13.52 | <0.001 | 37.88 ± 12.02 | 30.33 ± 13.28a | 24.94 ± 12.28a | <0.001 |
HCM, hypertrophic cardiomyopathy; LGE, late gadolinium enhancement; LV, left ventricular; MF, myocardial fibrosis.
Comparison between HCM and control.
Comparison among LGE(−)MF(−), LGE(−)MF(+), and LGE(+)MF(+).
P < 0.05 when compared with LGE(−)MF(−).
P < 0.05 when compared with LGE(−)MF(+).
Indicators for histological myocardial fibrosis
We next attempt to investigate optimal strategies for identifying MF of patients with HOCM via conventional and emerging CMR parameters. Univariate regression analysis showed that maximum septal thickness, peak LVOT gradient, septal %LGE, and septal strain parameters were significantly associated with septal histological MF (Table 3). Moreover, septal histological MF was significantly correlated with septal circumferential strain (r = 0.32, P < 0.001), septal longitudinal strain (r = 0.42, P < 0.0001), and septal radial strain (r=−0.27, P = 0.003, Figure 3). According to the multivariable analysis, only septal longitudinal strain [β, 0.19 (0.05–0.34); P = 0.01] was independently associated with histological MF.
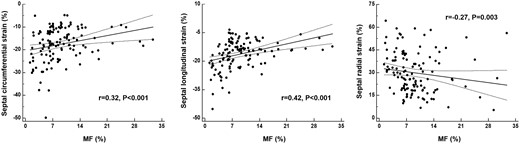
Correlation of septal strain parameters with histopathological myocardial fibrosis in all hypertrophic cardiomyopathy patients.
Regression analyses for indicators of histological MF in patients with obstructive HCM
| Univariate | Multivariate | |||
|---|---|---|---|---|
| β (95% CI) | P | β (95% CI) | P | |
| Age (years) | 0.01 (−0.07 to 0.09) | 0.80 | ||
| Sex | −1.29 (−3.40 to 0.83) | 0.23 | ||
| Atrial fibrillation | −0.83 (−0.83 to 2.16) | 0.58 | ||
| Family history of SCD | −0.84 (−4.72 to 3.04) | 0.67 | ||
| Peak LVOT gradient (mmHg) | 0.05 (0.002 to 0.09) | 0.04 | 0.03 (−0.01 to 0.07) | 0.11 |
| LV mass index (g/m2) | 0.003 (−0.03 to 0.04) | 0.88 | ||
| Maximal septal thickness (mm) | 0.28 (0.09 to 0.48) | 0.005 | 0.13 (−0.07 to 0.33) | 0.21 |
| Left atrium dimension (mm) | 0.01 (−0.11 to 0.13) | 0.85 | ||
| LV end-diastolic volume index (mL/m2) | 0.01 (−0.05 to 0.07) | 0.73 | ||
| LV end-systolic volume index (mL/m2) | 0.04 (−0.04 to 0.11) | 0.36 | ||
| Septal %LGE (%) | 0.13 (0.05 to 0.22) | 0.003 | 0.05 (−0.05 to 0.14) | 0.34 |
| Septal circumferential strain (%) | 0.20 (0.06 to 0.34) | 0.005 | 0.11 (−0.04 to 0.25) | 0.14 |
| Septal longitudinal strain (%) | 0.29 (0.16 to 0.42) | <0.001 | 0.19 (0.05 to 0.34) | 0.01 |
| Septal radial strain (%) | −0.07 (−0.14 to 0.01) | 0.09 | ||
HCM, hypertrophic cardiomyopathy; LV, left ventricular; LVOT, left ventricular outflow obstruction; MF, myocardial fibrosis; SCD, sudden cardiac death.
To evaluate the incremental value of septal longitudinal strain over the ESC 5-year SCD risk score and septal %LGE in detecting abnormal histological MF. Figure 4 showed when added to a model including the ESC 5-year SCD risk score (−2 log likelihood = 141.2, χ2 = 7.6), septal %LGE significantly increased the model detecting (−2 log likelihood = 81.4, χ2 = 67.4, P < 0.001), with further improvement when septal longitudinal strain (−2 log likelihood = 70.6, χ2 = 78.1, P = 0.001) was added to the model. The ROC analysis indicated that the septal longitudinal strain distinguishes HOCM patients with increased histological MF from normal histological MF individuals with the area under curve (AUC) of 0.82 at a cut-off of −15.8% and a sensitivity of 72% and a specificity of 86%.
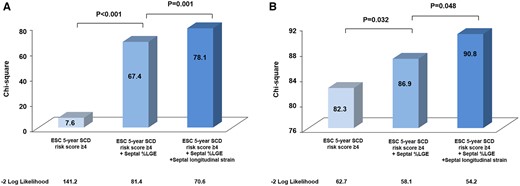
Incremental value in detecting abnormal histological MF and VA by stepwise inclusion of septal %LGE and septal longitudinal strain in addition to the ESC 5-year SCD risk score.
Indicators for ventricular arrhythmias
Among the HOCM patients, 34 of them (27.6%) experienced VA before surgical myectomy. Univariate logistic regression analysis showed that both septal %LGE and septal longitudinal strain were significantly associated with VA, while in the multivariate analysis, septal longitudinal strain was the only independent indicator of VA [odds ratio, 1.10 (1.01, 1.19); P = 0.02, Table 4]. Figure 4 shows incremental values in detecting the VA by stepwise inclusion of septal %LGE and septal longitudinal strain, in addition to the ESC 5-year SCD risk score. The addition of septal %LGE to the ESC 5-year SCD risk score model was identified as an incremental detector of VA (P = 0.032), with further enhancement when septal longitudinal strain was added to the model (P = 0.048). To further determine whether septal longitudinal strain could detect VA among HOCM patients, we performed ROC analysis. When the cut-off value was set to −15.4%, septal longitudinal strain could detect VA with a sensitivity and specificity of 79% and 56%, respectively (AUC = 0.70).
Regression analyses for indicators of ventricular arrhythmias in patients with obstructive HCM
| Univariate | Multivariate | |||
|---|---|---|---|---|
| OR (95% CI) | P | OR (95% CI) | P | |
| Age (years) | 1.02 (0.98–1.05) | 0.22 | ||
| Sex | 0.78 (0.35–1.72) | 0.54 | ||
| Atrial fibrillation | 1.08 (0.33–3.08) | 0.99 | ||
| Family history of SCD | 2.90 (0.78–10.73) | 0.11 | ||
| Peak LVOT gradient (mmHg) | 1.01 (0.99–1.03) | 0.10 | ||
| LV mass index (g/m2) | 1.01 (0.99–1.02) | 0.16 | ||
| Maximal septal thickness (mm) | 1.05 (0.98–1.14) | 0.18 | ||
| Left atrium dimension (mm) | 1.06 (1.01–1.12) | 0.02 | 1.05 (0.99–1.11) | 0.07 |
| LV end-diastolic volume index (mL/m2) | 1.01 (0.99–1.03) | 0.27 | ||
| LV end-systolic volume index (mL/m2) | 1.01 (0.99–1.04) | 0.33 | ||
| Septal %LGE (%) | 1.06 (1.02–1.09) | 0.002 | 1.03 (0.99–1.07) | 0.08 |
| Septal circumferential strain (%) | 1.06 (0.99–1.13) | 0.06 | ||
| Septal longitudinal strain (%) | 1.13 (1.05–1.22) | 0.001 | 1.10 (1.01–1.19) | 0.02 |
| Septal radial strain (%) | 0.98 (0.95–1.01) | 0.21 | ||
HCM, hypertrophic cardiomyopathy; LV, left ventricular; LVOT, left ventricular outflow obstruction; MF, myocardial fibrosis; OR, odds ratio; SCD, sudden cardiac death.
Discussion
In this study, we enrolled a large cohort of HOCM patients with histopathology and head-to-head compare the pathology–strain–LGE in the same study. We provided several important insights into myocardial function in patients with HOCM: (i) The myocardial strain was significantly impaired in HOCM patients with increased histological MF, despite the absence of LGE, (ii) septal longitudinal strain was independently associated with histological MF and VA, and (iii) septal longitudinal strain was incremental to septal %LGE in detecting abnormal histological MF and VA.
Our results showed myocardial LGE was demonstrated in approximately half of the patients with HOCM, but more patients had abnormally increased histological MF in their myectomy specimens, indicating that LGE-CMR cannot visualize histological MF in all subjects. Several previous echocardiographic speckle-tracking (EST) studies have demonstrated that strain is a useful surrogate marker of MF.11–15 Although CMR-tagging-derived strain is considered to be the gold standard for evaluating myocardial mechanics,21 dedicated imaging acquisition and time-consuming image post-processing hamper its widespread application compared with EST. CMR-FT is a recently developed technique based on routine cine CMR images without the need of acquiring additional sequences and enables the measurement of global and regional longitudinal, circumferential, and radial strain.22 Besides, several previous studies have validated the accuracy of this technique against CMR tagging or EST.23,24
We have shown that the septal circumferential strain, septal longitudinal strain, and septal radial strain were all significantly impaired despite the absence of LGE in HOCM patients. Consistent with previous studies using EST,13,14 the present study also demonstrated that the CMR-FT-derived septal longitudinal strain was independently associated with histological MF. These may be due to the fact that the endocardium is composed of longitudinal fibers and is most vulnerable to ischaemia, and hence, early LV dysfunction can be detected by measuring longitudinal strain.25 In HCM, worse longitudinal strain may not be explained by the presence of fibrosis alone. Myocyte hypertrophy, disarray, and small intramural coronary arteriole dysplasia, all of which may contribute to abnormal longitudinal strain. In the current study, myocardial strain derived from CMR-FT was significantly impaired in patients with increased histological MF than those without. It is suggested that the fibrosis is at least one important factor in strain decrease. As a simple and practical method, longitudinal strain acquired from CMR-FT may be a promising technique in assessing MF.
In general, patients with HOCM have an increased level of fibrosis at the time of myectomy.26 The presence of MF is considered as a risk factor for VA occurrence, which can lead to SCD in HCM patients.27 The relationship between MF and major cardiac events is primarily due to MF promoting re-entrant VA and contributing to increased ventricular stiffness.28 In the present study, the septal longitudinal strain was demonstrated as a sensitive marker of histological MF. Thus, it seems reasonable that impaired longitudinal strain would also be associated with cardiac events. Previous studies suggested that global longitudinal strain is more useful than conventional parameters in terms of predicting major cardiac events in patients with HCM.29 Several studies also revealed that the sensitivity of longitudinal myocardial strain in early detection of LV dysfunction was better than radial and circumferential strains.30 These indicate that impaired longitudinal function may play a specific role in major cardiac events. In agreement with this data, we did observe that septal longitudinal strain was independently associated with VA.
Our study further demonstrated that septal longitudinal strain was incremental to septal %LGE in detecting abnormal histological MF and VA. The likely reason for this might be an additive role of various histopathologic abnormalities (such as myocyte disarray and myocyte hypertrophy) in impaired regional myocardial mechanics. On the other hand, CMR-LGE was the most accurate method to measure myocardial replacement fibrosis, but it was limited for the assessment of the diffuse interstitial fibrosis, which was commonly found in HCM patients and appears to be more closely related to arrhythmias.13,14,31 Recent technological advances in CMR, such as T1 mapping and CMR-FT, are emerging as potential tools for early detection of subtle abnormalities in various cardiac conditions.18 The T1 mapping technique has been widely used as an imaging method to quantify interstitial fibrosis.32 And it is associated with adverse clinical outcomes.33 However, to our knowledge, the relationship between CMR-FT-derived strain and MF has not been studied in an adequately size cohort with histopathology examination verification. Previous studies have validated CMR strain analysis against T1 mapping, including the segment-based analysis.34 And it was demonstrated that the abnormalities of the ECV in the anteroseptal wall are the most significant indicators for adverse events.35 In the current study, we found that septal longitudinal strain, assessed at anteroseptal segments, was independently associated with VA. Consequently, the CMR-FT-derived myocardial strain might provide additional information of MF and VA in particular when CMR-LGE is not available or contraindicated.
Limitations
Our study had several limitations. Firstly, we acknowledge the difficulty of transposing the exact dimensions of the myectomy sample onto a specific segment of strain. However, both the precise dimensions of the sample and the weight in gram were known at the time of contouring. Secondly, about 30% of the patients with HCM have no obstruction36 and our results may not be representative of the general population of patients with HCM. Thirdly, the number of patients in the study was relatively small. Despite the fact that the incidence of VA (27.6%) in this study was similar to the reported incidence in other HCM populations,13,14,26 more clinical studies need to be performed in larger patient populations to confirm the effectiveness of the longitudinal strain as an indicator of major cardiac events. Fourth, we did not perform T1 mapping acquisition in the study population. Future studies with T1 mapping are required to validate and expand the findings of this study.
Conclusion
CMR-FT-derived septal longitudinal strain is independently and significantly associated with histological MF and VA in patients with HOCM and provides incremental value over LGE. Myocardial strain could be used as a non-invasive imaging marker for the detection of septal MF without the use of any contrast media, and may serve as an additional risk stratification tool while evaluating arrhythmic risk in patients with HOCM.
Funding
This study was supported by National Natural Science Foundation of China (81930044, 81620108015, and 82100377), National Key Research and Development Program (2021YFF0501404, 2021YFF0501400) and Beijing Nova Program (Z211100002121046).
Conflict of interest: None declared.
Data availability
The data underlying this article cannot be shared publicly due to the privacy of individuals that participated in the study. The data will be shared on reasonable request to the corresponding author.
References
Author notes
Yanyan Song, Xuanye Bi and Liang Chen are co-first authors.
Likun Ma, Shubin Qiao and Shihua Zhao contributed equally to this work and should be considered co-corresponding authors.
