


Abstract
We determined the feasibility and diagnostic performance of segmental 18F-flurpiridaz myocardial blood flow (MBF) measurement by positron emission tomography (PET) compared with the standard territory method, and assessed whether flow metrics provide incremental diagnostic value beyond relative perfusion quantitation (PQ).
All evaluable pharmacological stress patients from the Phase III trial of 18F-flurpiridaz were included (n = 245) and blinded flow metrics obtained. For each coronary territory, the segmental flow metric was defined as the lowest 17-segment stress MBF (SMBF), myocardial flow reserve (MFR), or relative flow reserve (RFR) value. Diagnostic performances of segmental and territory MBF metrics were compared by receiver operating characteristic (ROC) areas under the curve (AUC). A multiple logistic model was used to evaluate whether flow metrics provided incremental diagnostic value beyond PQ alone. The diagnostic performances of segmental flow metrics were higher than their territory counterparts; SMBF AUC = 0.761 vs. 0.737; MFR AUC = 0.699 vs. 0.676; and RFR AUC = 0.716 vs. 0.635, respectively (P < 0.001 for all). Similar results were obtained for per-vessel coronary artery disease (CAD) ≥70% stenosis categorization and per-patient analyses. Combinatorial analyses revealed that only SMBF significantly improved the diagnostic performance of PQ in CAD ≥50% stenoses, with PQ AUC = 0.730, PQ + segmental SMBF AUC = 0.782 (P < 0.01), and PQ + territory SMBF AUC = 0.771 (P < 0.05). No flow metric improved diagnostic performance when combined with PQ in CAD ≥70% stenoses.
Assessment of segmental MBF metrics with 18F-flurpiridaz is feasible and improves flow-based epicardial CAD detection. When combined with PQ, only SMBF provides additive diagnostic performance in moderate CAD.
Introduction
The superiority of positron emission tomography (PET) over single photon emission computed tomography (SPECT) myocardial perfusion imaging (MPI) for coronary perfusion assessment has been documented.1,2 Moreover, PET MPI has been extensively studied for myocardial blood flow (MBF) determination, an integrated measure of epicardial and microvascular coronary physiology.3 Notwithstanding a significant body of work, flow metrics have not entered widespread clinical practice, primarily due to inconsistent application of quality control measures, and lack of prospective clinical trials demonstrating influence on patient management.4,518F-flurpiridaz is an investigational PET MPI radiopharmaceutical that has undergone Phases I–III clinical evaluation6–10 and exhibits a very high extraction fraction that is largely unaffected by flow, absence of early metabolite appearance, high myocardial-to-background ratio, low positron range, high image and defect resolution, and favourable half-life of 109 min allowing delivery as unit doses and permitting routine exercise stress in addition to pharmacological stress.3
We previously performed the first-in-human analysis of absolute MBF with 18F-flurpiridaz using a 1-compartment model.11 Moody et al.12 subsequently investigated a two-compartment model of 18F-flurpiridaz in humans which overall yielded MBF values in a similar range to our method per coronary territory. Although visual reads and quantitative assessments of relative myocardial perfusion are conducted in a segmental manner,13 absolute MBF is usually reported on a global or coronary territory level. In the present study, we hypothesized that the diagnostic yield of flow metrics diminishes when combining segments with significant coronary artery disease (CAD) and those without significant disease,14 as is presently the norm to report coronary territory flow values. To maximize the yield of flow metrics, we built an approach based on 18F-flurpiridaz segmental flow values using the American Heart Association (AHA) 17-segment left ventricle (LV) myocardial model,15 compared the diagnostic performance of the lowest segmental flow metric with its territory counterpart,14 and determined whether the addition of flow metrics to automated PQ improved overall diagnostic performance.
Methods
Patient population
All n = 557 pharmacological stress patients from the Phase III 18F-flurpiridaz PET trial9 (ClinicalTrials.gov identifier: NCT01347710) were evaluated (Figure 1). All data are incorporated into the article and its Supplementary data online. The study was compliant with the Declaration of Helsinki, approved by local institutional review boards, and all patients provided written informed consent. Briefly, eligible patients either had (i) MPI prior to invasive coronary angiography (ICA) or (ii) ICA without intervention followed by MPI within 60 days. Significant exclusion criteria included percutaneous coronary intervention within 6 months, coronary artery bypass grafting, New York Heart Association class III/IV heart failure, non-ischaemic cardiomyopathy, orthotopic heart transplantation, symptomatic valvular disease, significant congenital heart disease, or transient ischaemic attack/cerebrovascular accident within 3 months.
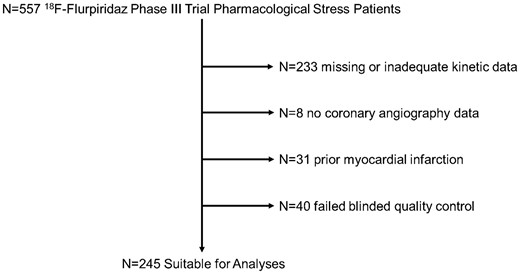
Study flowchart. Stepwise process leading to the final n = 245 retained studies. Studies with a poor fit of the calculated flow curves to the measured flow curves (defined as χ2 > 12) failed blinded quality control and were excluded (see Supplementary data online, Methods).
Additional information on the study protocol and quality control steps is detailed in Supplementary data online.
Myocardial PQ and blood flow metrics
Myocardial perfusion deficits at stress were quantified in an automated and blinded manner (relative perfusion quantitation: PQ), as previously described.13 MBF metrics were also derived in a blinded manner and reported as mL min−1 × g−1 of LV myocardium. Myocardial flow reserve (MFR) was defined as stress rest MBF. Territory relative flow reserve (RFR) was defined as stress MBF in a given coronary territory stress MBF in the coronary territory with the highest flow. Territory flow was derived in a left anterior descending (LAD), left circumflex (LCx), or right coronary artery (RCA) territory. Segmental flow was derived from the 17-segment AHA model of the LV myocardium.15 For each coronary territory, the lowest segmental value for either rest MBF, stress MBF, or MFR, was defined as the segmental flow metric in that territory. Segmental RFR was defined as the lowest segmental stress MBF value in a given coronary territory divided by the highest segmental stress MBF in the coronary territory with the highest territory stress MBF. For the LAD, the basal anteroseptum was excluded due to a paucity of myocardium. Thus, segmental flow in the LAD territory was derived from any of the remaining six LAD segments. Similarly, for the RCA, the basal inferoseptum was excluded due to a paucity of myocardium. Thus, segmental flow in the RCA territory was derived from any of the remaining four RCA segments. For the LCx, all five segments were retained for segmental flow analyses due to absence of membranous tissue.
Statistical analyses
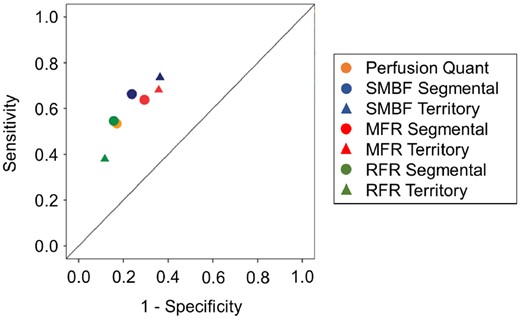
Quantitative variables were expressed as mean ± standard deviation, and categorical variables as percentages. Precision of flow metrics was determined by calculating the variance defined as (standard deviation)2 and assessed by Levene’s test. Flow metrics for stenosis groups were tested using analysis of variance with Sidak multiple comparison adjustment. Summaries of the receiver operating characteristic (ROC) areas under the curve (AUC), standard errors, confidence intervals, as well as a χ2 test to assess differences between curves were computed. Each ROC curve was analysed for the optimum threshold point (i.e. maximal sensitivity + specificity). Next the sensitivity and 1-specificity for the optimum threshold point was plotted on a summary ROC graphic. A multiple logistic model using flow metrics and PQ was used to generate probabilities for the combinatorial ROC analyses.16 Statistical analyses were conducted using Stata v15 (StataCorp., TX, USA) and Prism v6 (GraphPad, CA, USA), and graphs of the ROC curves were processed using SPSS v24 (IBM, NY, USA). A P-value <0.05 was considered significant.
Results
Study patients had a mean age of 63 years, were 67% male, and had prevalent CAD risk factors (Table 1).
Patient characteristics
| N | 245 |
|---|---|
| Age (years) | 63 ± 10 |
| Gender, male | 165 (67%) |
| Hypertension | 206 (84%) |
| Dyslipidaemia | 213 (87%) |
| Diabetes mellitus | 88 (36%) |
| Tobacco use history | 147 (60%) |
| Family history of CAD | 132 (54%) |
| BMI (kg/m2) | 32 ± 70 |
| LVEF (%) | 58 ± 11 |
| CAD ≥50% | 108 (44%) |
| CAD ≥70% | 66 (27%) |
Values are presented as mean ± standard deviation or n (%). CAD defined as patients with at least one coronary territory with ≥50% or ≥70% stenosis.
BMI, body mass index; CAD, coronary artery disease; LVEF, left ventricular ejection fraction.
In normals, the precision of territory and segmental flow metrics was similar, with overall rest variances = 0.02–0.06 (Figure 2A and C) and stress variances = 0.26–0.51 (Figure 2B and D, all P-values non-significant).
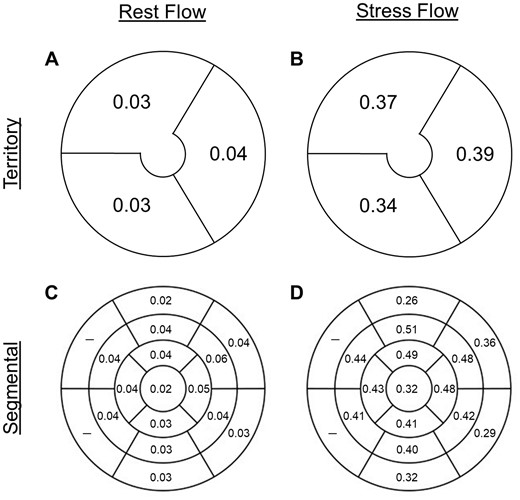
Precision of flow metrics. The precision of rest and stress flow, depicted as variances, is similar between territories (A and B) and the 17-segment LV model (C and D) in normal patients. LV, left ventricle.
We determined the ability of segmental flow metrics to detect graded increases in CAD stenosis (i.e. normals, 0–29%, 30–49%, 50–69%, and 70–100%), in both pooled and individual coronary territories (see Supplementary data online, Figures S1–S4). Whereas segmental rest MBF had minimal correlation with % CAD stenosis (see Supplementary data online, Figure S1), segmental stress MBF (SMBF) had a significant ability to detect increasing levels of % CAD stenosis (see Supplementary data online, Figure S2). Segmental MFR (see Supplementary data online, Figure S3) and segmental RFR (see Supplementary data online, Figure S4) also distinguished varying levels of CAD stenosis.
Scrutiny of the per-vessel diagnostic performance of PQ, segmental, and territory flow metrics in pooled coronary territories for CAD ≥50% categorization demonstrated that other than territory RFR which performed significantly worse, PQ (AUC = 0.730) had a similar diagnostic performance with segmental and territory flow metrics (Figure 3A, see Supplementary data online, Figure S5A). However, the diagnostic performances of segmental flow metrics (SMBF AUC = 0.761, MFR AUC = 0.699, and RFR AUC = 0.716) were greater than their territory counterparts (SMBF AUC = 0.737, MFR AUC = 0.676, and RFR AUC = 0.635, P < 0.001 for all, Figure 3A, see Supplementary data online, Figure S5A). When analysed individually, the improvement provided by segmental SMBF was driven mainly by the LAD and RCA territories (see Supplementary data online, Figure S5B), whereas the improvement provided by segmental MFR was primarily driven by the RCA territory (see Supplementary data online, Figure S5C). Finally, the diagnostic performance of segmental SMBF was greater than segmental MFR and RFR, as was the diagnostic performance of territory SMBF compared with territory MFR and RFR (Figure 3A, see Supplementary data online, Figure S5A).
![Summary of ROC curves depicting the per-vessel diagnostic performance of perfusion quantitation, segmental, and territory flow metrics for CAD ≥50% (A) and CAD ≥70% (B) categorization. (A) For CAD ≥50% categorization of pooled coronary territories (n = 735), the diagnostic performance of perfusion quantitation [AUC = 0.730 (0.686–0.775)] was similar to MBF metrics [segmental SMBF AUC = 0.761 (0.720–0.802), territory SMBF AUC = 0.737 (0.695–0.779), segmental MFR AUC = 0.699 (0.651–0.748), territory MFR AUC = 0.676 (0.627–0.725), segmental RFR AUC = 0.716 (0.666–0.765)] and was only superior to territory RFR AUC = 0.635 (0.582–0.688). The diagnostic performances of segmental SMBF, MFR, and RFR were significantly greater than territory SMBF, MFR, and RFR, respectively. (B) For CAD ≥70% categorization, the diagnostic performance of perfusion quantitation [AUC = 0.853 (0.809–0.897)] was significantly greater than MBF metrics [segmental SMBF AUC = 0.795 (0.746–0.844), territory SMBF AUC = 0.764 (0.712–0.816), segmental MFR AUC = 0.777 (0.723–0.831), territory MFR AUC = 0.743 (0.687–0.799), territory RFR = 0.714 (0.643–0.785)], other than the segmental RFR AUC = 0.802 (0.741–0.863). The diagnostic performances of segmental SMBF, MFR, and RFR were significantly greater than territory SMBF, MFR, and RFR, respectively. AUC, area under the curve; CAD, coronary artery disease; MFR, myocardial flow reserve; RFR, relative flow reserve; SMBF, stress myocardial blood flow.](https://oup.silverchair-cdn.com/oup/backfile/Content_public/Journal/ehjcimaging/23/12/10.1093_ehjci_jeab267/1/m_jeab267f3.jpeg?Expires=1750053431&Signature=c0iwrTNx-9q-cGLPDTjY8icRzu8QAroJdguHOdGWgRWMbWr0FZ~qUj36CPxx2O1oT7E3WHADbCLNnMVF~JOmycjI7N16hEfoncfKz-shmLV1FBRUlm04eZbolD6Lv~fULcqMld0gnqnge0KU~PVvcqjBaCQWSWAG1FBXsJj6KO~KuAhJ2sZZgTWnm5CMY6lHSKfLYoowDjc7UKmc3WXzrpmOdzX8zdLgxdTRtkqiwiAM3nzzTjJ7-aRlAYOPUBBG-rEkZoH0bSNVYplq7EAttWAimDHz7R-xMCWUizJsC6rnf2aHzSi1EcBKxD9FdaM7Z4-wQu~wi1MUmzxoRvVPlA__&Key-Pair-Id=APKAIE5G5CRDK6RD3PGA)
Summary of ROC curves depicting the per-vessel diagnostic performance of perfusion quantitation, segmental, and territory flow metrics for CAD ≥50% (A) and CAD ≥70% (B) categorization. (A) For CAD ≥50% categorization of pooled coronary territories (n = 735), the diagnostic performance of perfusion quantitation [AUC = 0.730 (0.686–0.775)] was similar to MBF metrics [segmental SMBF AUC = 0.761 (0.720–0.802), territory SMBF AUC = 0.737 (0.695–0.779), segmental MFR AUC = 0.699 (0.651–0.748), territory MFR AUC = 0.676 (0.627–0.725), segmental RFR AUC = 0.716 (0.666–0.765)] and was only superior to territory RFR AUC = 0.635 (0.582–0.688). The diagnostic performances of segmental SMBF, MFR, and RFR were significantly greater than territory SMBF, MFR, and RFR, respectively. (B) For CAD ≥70% categorization, the diagnostic performance of perfusion quantitation [AUC = 0.853 (0.809–0.897)] was significantly greater than MBF metrics [segmental SMBF AUC = 0.795 (0.746–0.844), territory SMBF AUC = 0.764 (0.712–0.816), segmental MFR AUC = 0.777 (0.723–0.831), territory MFR AUC = 0.743 (0.687–0.799), territory RFR = 0.714 (0.643–0.785)], other than the segmental RFR AUC = 0.802 (0.741–0.863). The diagnostic performances of segmental SMBF, MFR, and RFR were significantly greater than territory SMBF, MFR, and RFR, respectively. AUC, area under the curve; CAD, coronary artery disease; MFR, myocardial flow reserve; RFR, relative flow reserve; SMBF, stress myocardial blood flow.
On the other hand, comparison of the per-vessel diagnostic performance of PQ, segmental, and territory flow metrics in pooled coronary territories for CAD ≥70% categorization demonstrated that other than segmental RFR which performed similarly, PQ (AUC = 0.853) had a greater diagnostic performance than segmental and territory flow metrics (Figure 3B, see Supplementary data online, Figure S6A). The diagnostic performances of all segmental flow metrics (SMBF AUC = 0.795, MFR AUC = 0.777, and RFR AUC = 0.802) however were again greater than their territory flow counterparts (SMBF AUC = 0.764, MFR AUC = 0.743, and RFR AUC = 0.714, P < 0.001 for all, Figure 3B, see Supplementary data online, Figure S6A). For both segmental vs. territory SMBF (see Supplementary data online, Figure S6B) and segmental vs. territory MFR (see Supplementary data online, Figure S6C), improvements in diagnostic performance were driven by the LAD and RCA territories. For both CAD ≥50% and CAD ≥70% categorization, the diagnostic performances of 1-segment and 2-segment flow metrics were similar in the LAD territory (see Supplementary data online, Figure S7).
We subsequently determined whether combining flow metrics with PQ might enhance diagnostic performance, beyond PQ alone. For CAD ≥50% categorization (Figure 4A), combinatorial assessment using PQ with either segmental SMBF (AUC = 0.782, P < 0.01) or territory SMBF (AUC = 0.771, P < 0.05) significantly improved the diagnostic performance beyond PQ alone (AUC = 0.730). The addition of the remaining flow metrics did not significantly improve diagnostic performance when combined with PQ (Figure 4A). On the other hand, for CAD ≥70% categorization (Figure 4B), no flow metric enhanced diagnostic performance when combined with PQ, beyond the one achieved by PQ alone (AUC = 0.853).
![Per-vessel diagnostic performance of combinatorial perfusion quantitation and flow metrics for CAD ≥50% (A), CAD ≥70% (B), and CAD 50–69% (C) categorization. (A) For CAD ≥50% categorization of pooled coronary territories (n = 735), the addition of either segmental or territory SMBF significantly improved the diagnostic performance of perfusion quantitation (PQ), whereas the other flow parameters did not provide additional discriminatory value [PQ AUC = 0.730 (0.686–0.775), PQ + segmental SMBF AUC = 0.782 (0.741–0.823), PQ + territory SMBF AUC = 0.771 (0.730–0.813), PQ + segmental MFR AUC = 0.742 (0.696–0.789), PQ + territory MFR AUC = 0.736 (0.688–0.783), PQ + segmental RFR AUC = 0.733 (0.686–0.781), PQ + territory RFR AUC = 0.713 (0.664–0.761], *P < 0.05, **P < 0.01]. (B) For CAD ≥70% categorization, MBF metrics did not provide additive discriminatory value when combined with perfusion quantitation [PQ AUC = 0.853 (0.809–0.897), PQ + segmental SMBF AUC = 0.856 (0.811–0.901), PQ + territory SMBF AUC = 0.851 (0.805–0.897), PQ + segmental MFR AUC = 0.848 (0.798–0.899), PQ + territory MFR AUC = 0.842 (0.790–0.893), PQ + segmental RFR AUC = 0.841 (0.790–0.892), PQ + territory RFR AUC = 0.825 (0.770–0.880)]. (C) For CAD 50–69% categorization, the addition of either segmental or territory SMBF significantly improved the diagnostic performance of perfusion quantitation (PQ), whereas the other flow parameters did not provide additional discriminatory value [PQ AUC = 0.586 (0.522–0.649), PQ + segmental SMBF AUC = 0.704 (0.643–0.764), PQ + territory SMBF AUC = 0.691 (0.631–0.750), PQ + segmental MFR AUC = 0.607 (0.538–0.676), PQ + territory MFR AUC = 0.602 (0.533–0.671), PQ + segmental RFR AUC = 0.609 (0.539–0.678), PQ + territory RFR AUC = 0.576 (0.507–0.644), **P < 0.01, ***P < 0.001]. AUC, area under the curve; CAD, coronary artery disease; MFR, myocardial flow reserve; RFR, relative flow reserve; SMBF, stress myocardial blood flow.](https://oup.silverchair-cdn.com/oup/backfile/Content_public/Journal/ehjcimaging/23/12/10.1093_ehjci_jeab267/1/m_jeab267f4.jpeg?Expires=1750053431&Signature=ycHOqDT7NEolaFSvO2Ydj7xnOGRxfXBkD-25a7XWD94Xze7VpC6lQWYUCubsgXNUUHcaqlMxvTGdytIbqce7~XmiHlu8C4QGSlNyQ2G6UHj1U3T26LaSEMM3xJISIUccyaJ4GWZjKjcZ3NLdOzs4DVoN5pVsB13mt~VdvwQn~W4ckgMWRPj2KBNz45SoFkOSrlcK1SiWik800lygbo4PJg5hoen-diLJEHfsYVSiWSXjvTznqb2fSG~3H0Neoaeop2jwoQt3i1cNYjuETxIggaGGpqLFbh7O~pqWuGvu8NXh88PNj7Wx4oRiD8PCgxNlN5jmEx2MX6v08sF9CiUCAg__&Key-Pair-Id=APKAIE5G5CRDK6RD3PGA)
Per-vessel diagnostic performance of combinatorial perfusion quantitation and flow metrics for CAD ≥50% (A), CAD ≥70% (B), and CAD 50–69% (C) categorization. (A) For CAD ≥50% categorization of pooled coronary territories (n = 735), the addition of either segmental or territory SMBF significantly improved the diagnostic performance of perfusion quantitation (PQ), whereas the other flow parameters did not provide additional discriminatory value [PQ AUC = 0.730 (0.686–0.775), PQ + segmental SMBF AUC = 0.782 (0.741–0.823), PQ + territory SMBF AUC = 0.771 (0.730–0.813), PQ + segmental MFR AUC = 0.742 (0.696–0.789), PQ + territory MFR AUC = 0.736 (0.688–0.783), PQ + segmental RFR AUC = 0.733 (0.686–0.781), PQ + territory RFR AUC = 0.713 (0.664–0.761], *P < 0.05, **P < 0.01]. (B) For CAD ≥70% categorization, MBF metrics did not provide additive discriminatory value when combined with perfusion quantitation [PQ AUC = 0.853 (0.809–0.897), PQ + segmental SMBF AUC = 0.856 (0.811–0.901), PQ + territory SMBF AUC = 0.851 (0.805–0.897), PQ + segmental MFR AUC = 0.848 (0.798–0.899), PQ + territory MFR AUC = 0.842 (0.790–0.893), PQ + segmental RFR AUC = 0.841 (0.790–0.892), PQ + territory RFR AUC = 0.825 (0.770–0.880)]. (C) For CAD 50–69% categorization, the addition of either segmental or territory SMBF significantly improved the diagnostic performance of perfusion quantitation (PQ), whereas the other flow parameters did not provide additional discriminatory value [PQ AUC = 0.586 (0.522–0.649), PQ + segmental SMBF AUC = 0.704 (0.643–0.764), PQ + territory SMBF AUC = 0.691 (0.631–0.750), PQ + segmental MFR AUC = 0.607 (0.538–0.676), PQ + territory MFR AUC = 0.602 (0.533–0.671), PQ + segmental RFR AUC = 0.609 (0.539–0.678), PQ + territory RFR AUC = 0.576 (0.507–0.644), **P < 0.01, ***P < 0.001]. AUC, area under the curve; CAD, coronary artery disease; MFR, myocardial flow reserve; RFR, relative flow reserve; SMBF, stress myocardial blood flow.
To explore differences in diagnostic performance of combinatorial flow metrics and PQ in CAD ≥50% and CAD ≥70% categorizations, we scrutinized the behaviour of these measures in subgroups of significant CAD defined as 50–69% (n = 77, see Supplementary data online, Figure S8 and Figure 4C), 70–79% (n = 18, see Supplementary data online, Figure S9); 80–89% (n = 15, see Supplementary data online, Figure S10); and 90–100% (n = 53, see Supplementary data online, Figure S11). Whereas there was no difference in the 70–100% subgroups, the 50–69% subgroup indicated (see Supplementary data online, Figure S8 and Figure 4C) the diagnostic performance of segmental SMBF (AUC = 0.702, P < 0.01), and territory SMBF (AUC = 0.688, P < 0.01) was significantly greater than the diagnostic performance of PQ (AUC = 0.586), whereas segmental and territory MFR or RFR were in a similar range (see Supplementary data online, Figure S8). Additionally, the diagnostic performance of segmental SMBF was greater than segmental MFR and segmental RFR, as was territory SMBF compared with territory MFR and territory RFR (see Supplementary data online, Figure S8). Subsequently, we determined whether combining flow metrics with PQ enhanced diagnostic performance, beyond PQ alone, in the CAD 50–69% subgroup (Figure 4C). Combinatorial assessment using PQ with either segmental SMBF (AUC = 0.704, P < 0.001) or territory SMBF (AUC = 0.691, P < 0.01) significantly improved diagnostic performance beyond PQ alone (AUC = 0.586). The addition of the MFR or RFR metrics on the other hand did not significantly improve diagnostic performance when combined with PQ (Figure 4C).
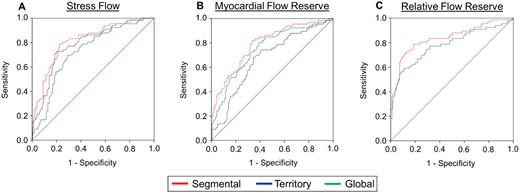
On a per-patient assessment of CAD ≥50% categorization (Figure 5), the diagnostic performance of segmental SMBF (AUC = 0.766) was greater than territory SMBF (AUC = 0.745, P < 0.05, Figure 5A), as was segmental MFR (AUC = 0.709) vs. territory MFR (AUC = 0.686, P < 0.05, Figure 5B). Segmental and territory RFR were not significantly different (Figure 5C). Performance measures with global SMBF and MFR are presented for contextualization only. The diagnostic performance of segmental and territory SMBF was greater than segmental and territory MFR, respectively (P < 0.05; see Supplementary data online, Figure S12).
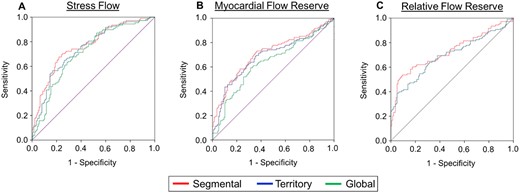
Per-patient diagnostic performance of segmental vs. territory flow metrics for CAD ≥50% categorization. (A) The AUC = 0.766 (0.706–0.825) of segmental stress flow was significantly greater than the territory stress flow AUC = 0.745 (0.683–0.807) and the global stress flow AUC = 0.712 (0.647–0.776, n = 245, P < 0.05 segmental vs. territory, P < 0.001 segmental vs. global, P < 0.001 territory vs. global). (B) The AUC = 0.709 (0.642–0.777) of segmental MFR was also significantly greater than the territory MFR AUC = 0.686 (0.617–0.756) and the global MFR AUC = 0.633 (0.561–0.705, n = 245, P < 0.05 segmental vs. territory, P < 0.0001 segmental vs. global, P < 0.0001 territory vs. global). (C) The AUC = 0.729 (0.663–0.796) of segmental RFR was not significantly different than the territory RFR AUC = 0.695 (0.626–0.764). AUC, area under the curve; CAD, coronary artery disease; MFR, myocardial flow reserve; RFR, relative flow reserve.
We then scrutinized the per-patient assessment of CAD ≥70% categorization (Figure 6). The diagnostic performance of segmental SMBF (AUC = 0.816) was higher than territory SMBF (AUC = 0.785, P < 0.01, Figure 6A), as was segmental MFR (AUC = 0.791) vs. territory MFR (AUC = 0.750, P < 0.001, Figure 6B), and segmental RFR (AUC = 0.835) vs. territory RFR (AUC = 0.783, P < 0.05, Figure 6C). There was no significant difference within segmental metrics or territory metrics (see Supplementary data online, Figure S13).
Per-patient diagnostic performance of segmental vs. territory flow metrics for CAD ≥70% categorization. (A) The AUC = 0.816 (0.755–0.877) of segmental stress flow was significantly greater than the territory stress flow AUC = 0.785 (0.720–0.849) and the global stress flow AUC = 0.730 (0.661–0.798, n = 245, P < 0.01 segmental vs. territory, P < 0.0001 segmental vs. global, P < 0.0001 territory vs. global). (B) The AUC = 0.791 (0.727–0.855) of segmental MFR was significantly greater than the territory MFR AUC = 0.750 (0.680–0.820) and the global MFR AUC = 0.671 (0.596–0.747, n = 245, P < 0.001 segmental vs. territory, P < 0.0001 segmental vs. global, P < 0.0001 territory vs. global). (C) The AUC = 0.835 (0.770–0.899) of segmental RFR was significantly greater than the territory RFR AUC = 0.783 (0.709–0.856, P < 0.05). AUC, area under the curve; CAD, coronary artery disease; MFR, myocardial flow reserve; RFR, relative flow reserve.
Optimal cut-off points from the ROC curves were determined for segmental SMBF, MFR, and RFR, and for territory SMBF and MFR, both for CAD ≥50% and CAD ≥70% categorizations (see Supplementary data online, Table S1).
Illustrative case examples of automated relative PQ, territory SMBF, and segmental SMBF polar maps in patients with CAD are shown (see Supplementary data online, Figures S14 and S15).
Discussion
Using 18F-flurpiridaz PET for CAD categorization, we (i) present a comprehensive approach for flow quantitation, (ii) characterize an improvement in flow-based diagnostic performance with segmental SMBF, MFR, or RFR compared with territory SMBF, MFR, or RFR, and (iii) demonstrate the incremental discriminatory power provided by SMBF over a validated automated perfusion quantitative approach13 in moderate CAD. We posit that assessment of MBF metrics on a segmental basis may increase the ability to detect underlying CAD. Indeed, when segments with abnormal MBF are ‘diluted’ by segments with normal MBF, this may decrease overall diagnostic performance by erroneously categorizing a given coronary territory as normal despite the presence of underlying significant disease. Using an automated approach, we demonstrate that for CAD ≥50% stenosis categorization, only segmental and territory SMBF provide additive discriminatory power beyond automated PQ, while there is no significant improvement with MFR or RFR metrics. For CAD ≥70% stenosis detection however, no flow metric improved diagnostic performance beyond automated PQ alone, indicating that the additive contribution of SMBF assessment is mainly driven by coronary territories with moderate CAD defined as 50–69% stenoses. This may be explained in part by severe stress-inducible ischaemia in patients with ≥70% stenoses, given the majority in this group had ≥90% stenoses.
Various groups previously proposed determining MBF over an area smaller than a given coronary territory. Longitudinal flow gradient, defined as the decrease in 13N-ammonia MBF from mid to apical regions,17 correlates with fractional flow reserve.18 Segmental 82Rb-chloride stress MBF decreases from >2.5 mL min−1 g−1 in myocardial regions without underlying coronary stenosis to a stress MBF <2.0 mL min−1 g−1 in areas with ≥70% coronary stenosis.19 Moreover, the addition of segmental 13N-ammonia MFR <2.0 as an abnormality criterion improves the per-vessel diagnostic accuracy for detection of CAD ≥50%.20 Using 15O-water PET, Danad et al.21 previously quantified segmental MBF and defined abnormal values when present in ≥4 adjacent segments assigned to the LAD, or in ≥2 adjacent segments assigned to the LCx or RCA vascular territory. Their results indicate a superior diagnostic performance of SMBF over MFR to detect haemodynamically significant CAD defined as invasive FFR ≤0.80, with a per-vessel AUC = 0.85.21 Similarly, Berti et al.22 demonstrated an overall diagnostic accuracy for significant CAD detection of 85% per-patient and 83% per-vessel using predetermined abnormality cut-offs for 15O-water and 13N-ammonia segmental MBF and MFR measures. Others suggest using hybrid coronary computed tomography angiography (CTA)/PET MPI to increase the diagnostic accuracy of lesion-specific hyperaemic MBF—calculated from the average MBF of segments downstream of a stenotic lesion—compared with territory MBF.23,24 Recent work proposes that hybrid coronary CTA/PET MPI measures of abnormal MBF may be further improved by determining the specific coronary artery vessel path and by assessing MBF along that path, as opposed to the 17-segment model.25 Taken together, the above studies suggest that a more refined approach than the standard territory measurements of stress MBF and MFR may provide additional discriminatory power for CAD diagnosis.14
In addition to the well-established prognostic power of PET-based MBF metrics,5 multiple groups have explored the contribution of flow quantitation to epicardial CAD diagnosis. To this end, studies with 82Rb-chloride,2613N-ammonia,27 and 15O-water28 have indicated a significant improvement in diagnostic performance when using flow metrics compared with standard PQ. Subsequently, the incremental value of MFR with 82Rb-chloride29,30 or 13N-ammonia20 PET when combined with relative perfusion assessment was established. Recently, Moody et al.12 showed an improvement in diagnostic performance with 18F-flurpiridaz-based flow measured at the territory level over a base model that combined both clinical parameters and relative perfusion.
As with other PET MPI radiotracers, quality control is a crucial step in obtaining reliable MBF data (see Supplementary data online, Methods). Specifically, MBF data with 18F-flurpiridaz are more sensitive to patient motion during pharmacological stress due its higher resolution as compared with 82Rb-chloride. All the quality control steps as well as motion correction when indicated were integral to the present study. Stress MBF quantitation, and MFR and RFR calculations require first-pass kinetics of the radiotracer that is feasible with pharmacological stress but not with treadmill exercise. Therefore, these parameters could only be derived in the pharmacological stress subgroup of the Phase III 18F-flurpiridaz trial. Our method of 18F-flurpiridaz MBF quantitation10,14 is based on certain parameters, namely: (i) a flow-independent, fixed myocardial extraction fraction of 94%, (ii) the assumption that no tracer metabolites appear in the first minutes following radiopharmaceutical injection, (iii) the binding of 18F-flurpiridaz to cardiomyocytes is deemed irreversible, and (iv) correction for the partial-volume effect and spillover of activities. Furthermore, our approach to segmental MBF measurements takes advantage of some of the salient features of 18F-flurpiridaz. The linear relation of 18F-flurpiridaz myocardial extraction to MBF over a wide range of flow values permits accurate measurement of MBF with fewer assumptions.11 Additionally, 18F is a low-energy positron, travelling a short distance of 1 mm in the myocardium prior to annihilation and photon emission.3 This prevents the ‘contamination’ of myocardial segments with a signal emanating from tracer uptake in a neighbouring segment, thus creating a robust platform for the accurate analysis of segmental MBF.
Our findings indicate that measurement of SMBF, MFR, and RFR at the segmental level with 18F-flurpiridaz enhances overall flow-based diagnostic performance for both CAD ≥50% and CAD ≥70% categorization compared with standard assessments of these same metrics at the coronary territory level. For SMBF and MFR, this phenomenon is driven by significant improvements in the LAD and RCA territories, whereas there is no improvement in the LCx territory which may be explained at least in part by variability in coronary anatomy.25,31 Future studies should consider using a hybrid PET/CT angiography approach to reassign myocardial segments according to the angiographic determination of coronary distributions, which may further enhance the diagnostic performance of MBF metrics.25 Finally, the integration of 18F-flurpiridaz-derived flow metrics with relative PQ indicates an additive discriminatory contribution of SMBF—beyond perfusion alone—to enhance diagnostic performance for moderate CAD detection.
Limitations
We derived 18F-flurpiridaz MBF quantitation retrospectively. To facilitate future prospective assessment of our segmental (and territory) MBF approach, we provide the optimal cut-off points for CAD ≥50% and CAD ≥70% stenosis diagnosis. The cut-off values are presented as indicative only, should not be considered definitive, and will require further validation in the ongoing second Phase III 18F-flurpiridaz trial (303 studies). The diagnostic performance results we present are compared with % CAD stenosis and not FFR, thus requiring caution in interpretation. Similarly, the presented cut-off points are expected to differ when using FFR as the reference standard to determine the haemodynamic significance of CAD lesions. While FFR was not obtained in the present Phase III study population in accordance with FDA guidelines, future research efforts should be directed towards comparing both 18F-flurpiridaz relative perfusion and MBF quantitation with FFR. Furthermore, as per the Phase III trial protocol,9 rest MBF values were not corrected for systolic blood pressure and heart rate, which may theoretically have led to an overestimation of rest MBF values, for example, in certain anxious patients.5 However, our MFR measures using uncorrected rest MBF values demonstrated a robust ability to distinguish graded changes in CAD stenosis. Additionally, this simplified approach will likely enhance the generalizability and routine applicability of our findings. Finally, due to regulatory requirements, quantitative ICA was the reference standard. Thus, invasive fractional flow reserve/coronary flow reserve was not measured, which likely adversely affected the diagnostic performance of flow metrics.
Conclusion
The present body of work establishes an improvement in 18F-flurpiridaz flow-based diagnostic performance by the lowest segmental SMBF, MFR, and RFR over their territory counterparts, and further demonstrates that only segmental or territory SMBF provides additive discriminatory power for CAD ≥50% categorization when combined with automated PQ.
Supplementary data
Supplementary data are available at European Heart Journal - Cardiovascular Imaging online
Acknowledgements
We thank James Sayre, PhD (Biostatistics Department, UCLA School of Public Health), for statistical support.
Funding
This study was supported by NIH 1R43HL123069-01, NIH 5R44 HL123069-03, VA Merit BX004558, and UCLA Cardiovascular Discovery Fund/Lauren B. Leichtman and Arthur E. Levine Investigator Award.
References
Author notes
Conflict of interest: E.V.G. and C.D.C. receive royalties from the Emory Cardiac Toolbox. K.F.V.T. and C.D.C. are employees of Syntermed which distributes the Emory Cardiac Toolbox. J.R.V. consults for the Emory Cardiac Toolbox. E.V.G. and J.M. are scientific advisors to Lantheus Medical Imaging and GE Healthcare.
