


Abstract
Rupture of the fibrous cap (RFC) represents the main pathophysiological mechanism causing acute coronary syndromes (ACS). Destabilization due to plaque biomechanics is considered to be importantly involved, exact mechanisms triggering plaque ruptures are, however, unknown. This study aims at characterizing the relation between plaque components and rupture points at ACS-causing culprit lesions in a large cohort of ACS-patients assessed by high-resolution intracoronary imaging.
Within the prospective, multicentric OPTICO-ACS study program, the ACS-causing culprit plaques of 282 consecutive patients were investigated following a standardized optical coherence tomography (OCT) imaging protocol. Each pullback was assessed on a frame-by-frame basis for the presence of lipid components (LC), calcium components (CC), and coexistence of both LC and CC (LCC) by two independent OCT-core labs. Of the 282 ACS-patients, 204 patients (72.3%) presented with ACS caused by culprit lesions with rupture of the fibrous cap (RFC-ACS) and 27.7% patients had ACS caused by culprit lesions with intact fibrous cap (IFC-ACS). When comparing RFC-ACS to IFC-ACS, a preferential occurrence of all three plaque components (LC, CC, and LCC) in RFC-ACS became apparent (P < 0.001). Within ruptured culprit lesions, the zone straight at the rupture point [extended rupture zone (RZ)] was characterized by similar (24.7% vs. 24.0%; P = ns) calcium content when compared with the proximal and distal border of the culprit lesion [border zone (BZ)]. The RZ displayed a significantly higher amount of both, LC (100% vs. 69.8%; P < 0.001) and LCC (22.7% vs. 6.8%; P < 0.001), when compared with the BZ. The relative component increase towards the RZ was particularly evident for LCC (+233.8%), while LC showed only a modest increase (+43.3%).
Calcified- and lipid-containing components characterize ruptured fibrous cap ACS-causing culprit lesions. Their coexistence is accelerated directly at the ruptured point, suggesting a pathophysiological contribution in the development of RFC-ACS.

Introduction
Rupture of the fibrous cap (RFC) has been identified as main pathophysiological mechanism causing acute coronary syndromes (ACS),1–3 and the detrimental impact of vascular inflammation on plaque destabilization is well known.4,5 Inflammatory cells may infiltrate the fibrous cap and weaken its strength, thereby favouring plaque rupture and thrombus formation, finally causing vessel occlusion and myocardial infarction.6–8 Besides inflammation, plaque biomechanics determine the occurrence of plaque rupture.9 Debris accumulation within the plaque body may ultimately lead to its burst when the pressure within the plaque exceeds the withholding capacity of the fibrous cap.10 Peak cap stress as the force acting on the fibrous cap, has therefore been suggested as measure of plaque vulnerability.11 Lipid content within the plaque has been postulated as one of its major determinants,12 since eccentric large lipid pools increase cap stress.13,14 The presence of calcium is further considered as relevant factor facilitating plaque rupture.15 However, an increase of the calcium content alone may not alter plaque biomechanics at all,16 suggesting that both, lipid and calcium contents, may act as a dynamic entity. This study aims at characterizing the relation between lipid and calcified plaque components and rupture points at ACS-causing culprit lesions in a large cohort of ACS-patients assessed by high-resolution intracoronary imaging.
Methods
Study design
The prospective, multicentric OPTIcal-COherence Tomography in Acute Coronary Syndrome (OPTICO-ACS)5 study was coordinated at the Charité—University Medicine Berlin and the Berlin Institute of Health (BIH), Germany. A total of 282 patients presenting with ACS [Non-ST segment elevation myocardial infarction (NSTE-ACS)17 or ST segment elevation myocardial infarction (STE-ACS)]18 and undergoing percutaneous coronary intervention (PCI) of a clearly determinable culprit lesion were consecutively enrolled. Ethical approval was obtained from the local ethics committee (No. EA1/270/16) and the study was conducted in accordance with the Declaration of Helsinki.19 Written informed consent was obtained from all the participating subjects and the study was registered at ClinicalTrials.gov (NCT03129503).
Optical coherence tomography image acquisition and analysis
The protocol for optical coherence tomography (OCT)-image acquisition was previously published.5 In short, after diagnostic angiography and before PCI, culprit site preparation by thrombectomy using an Export Advance™ aspiration catheter system (Medtronik, Minneapolis, USA) and eventually, pre-dilation by means of a PTCA compliant balloon was performed as appropriate. Whenever the blood flow within the affected culprit vessel was adequate (TIMI II or higher), OCT-pullback without further culprit site preparation was attempted with an OPTIS integrated system (St. Jude Medical, St. Paul, MN, USA) together with a commercially available OCT-catheter (Dragonfly Duo, St. Jude Medical, St. Paul, MN, USA). Angiographic features that led to study exclusion were: Main stem involvement of >50%, a culprit lesion within a bypass vessel, heavily calcified lesions, vessels with heavy tortuosity and culprit lesions, located very distally, thereby hindering uncomplicated passage of the OCT-catheter.
Standardized analyses of all pullbacks were performed by two OCT Core Labs following a pre-defined standard operating procedure5 and using Medis QIvus 3.0 (Medis Medical Imaging Service, Leiden, The Netherlands). The entire culprit segment was defined by the longitudinal extension of the culprit plaque. The proximal and distal references and borders of the culprit lesion were defined as the largest lumen either proximal or distal to the stenosis but within the same segment and ideally within 10 mm from the culprit point.20,21 RFC-ACS were defined as plaques with a discontinuous or disrupted fibrous cap,21 and IFC-ACS by the absence of plaque rupture and the presence of a thrombus overlying an intact fibrous cap, a luminal surface irregularity without associated thrombus, or an attenuated underlying plaque with thrombus and without superficial lipid or calcium content.5,21 This study investigated lipid component (LC) and calcium plaque component (CC) in detail as assessed in every single cross-sectional frame (slice thickness 0.1 mm) according to universal consensus standards.5,21 Calcified content was identified as heterogenous mass with sharply delineated borders21 and LC was defined as signal-poor structure with a diffuse border.21 Whenever both, lipid and calcium were present within the same frame, they were categorized as coexisting components (LCC), thereby representing the calcium-lipid interface.
For a quantitative plaque analysis within the RFC-ACS group, the rupture site served as reference point for proximal and distal segmentation. The proximal and distal margins of the culprit lesion were used as the proximal and distal borders. The rupture plaque edges, i.e. the beginning and ending of the rupture site, were identified as the proximal and distal rupture borders. The segment extending from each border to the proximal and distal culprit lesion margins were further divided into two halves labelled extended rupture zone (RZ; Figure 1), which extends from the rupture border to half way till the culprit border, and border zone (BZ; Figure 1), which extends from the extended rupture zone border to the culprit lesion margin. Each zone was further investigated for lipid (LC), calcium (CC), and the coexistence of both plaque components (LCC) on a frame-by-frame basis and was adjusted to the number of evaluated frames in the corresponding zone.
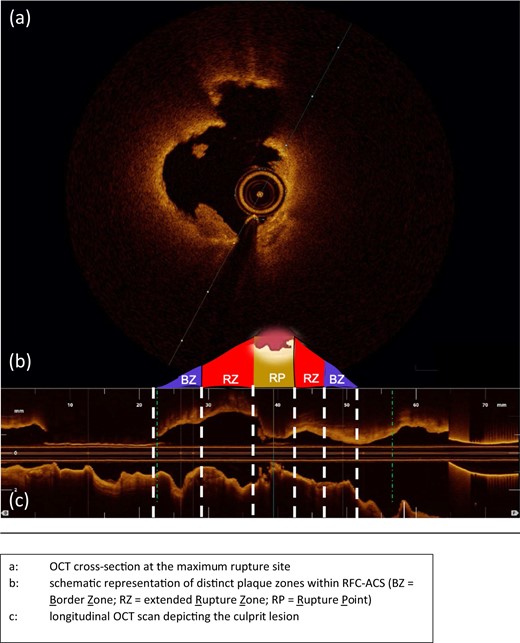
Representative OCT-case with schematic illustration of the plaque zones within RFC-ACS. (A) OCT cross-section at the maximum rupture site. (B) Schematic representation of distinct plaque zones within RFC-ACS. (C) Longitudinal OCT scan depicting the culprit lesion. BZ, border zone; OCT, optical coherence tomography; RZ, extended rupture zone; RP, rupture point; RFC-ACS, ruptured-fibrous cap acute coronary syndrome.
Statistical analysis
All variables were tested for normal distribution via Shapiro–Wilk test, assisted by graphical evaluation via Q-Q-diagrams. Categorical variables were compared via χ2 test. Extended rupture and BZs were compared by Wilcoxon signed rank test within the RFC-ACS group. Continuous variable in LCChi- and LCClow-lesions were compared via Mann–Whitney test. P-values of <0.05 were considered statistically significant. All statistical analyses were performed by SPSS version 25.0 (IBM Corp., Armonk, USA).
Results
Patient baseline characteristics and OCT-features
Out of 355 eligible patients included into the OPTICO-ACS-study program with evaluable OCT runs, a total of 282 patients (79.4%) with RFC-ACS or IFC-ACS as primary underlying pathophysiology were included into the analysis. Patients with an ACS caused by an in-stent restenosis or spontaneous coronary artery dissection (n = 53), as well as calcified nodules as underlying pathology (n = 20) were excluded from the entire analysis. Baseline characteristics are presented in Table 1. Patients were predominantly men (n = 215, 76.2%) with a mean age of 62.9 (±11.9) years, presenting with STE-ACS in the majority of cases (n = 180, 63.8%). The prevalence of cardiovascular risk factors was high with arterial hypertension and diabetes mellitus observed in 80.1% (n = 226) and 20.2% (n = 57), respectively. Table 2 summarizes OCT-derived plaque features: The mean longitudinal culprit lesion extension was 17.7 (± 6.5 mm). Plaques were almost exclusively fibroatheromas (95.1%) with a mean cap thickness of 68.6 (±39.2 µm). RFC-ACS and IFC-ACS were present in 72.3% (n = 204) and 27.7% (n = 77) of patients, respectively. CC and LCC were present in 207 (73.4%) and 186 (66.0%) patients, respectively. Macrophages occurred in 94.3% (n = 266) of the culprit lesions.
Baseline characteristics of the entire study population
| ACS patients (n = 282) | |
|---|---|
| Patient characteristics | |
| Age (mean ± SD) | 62.9 (11.9) |
| Male, n (%) | 215 (76.2) |
| Family history of CAD, n (%) | 116 (41.1) |
| Previous history of CAD, n (%) | 23 (8.2) |
| Arterial hypertension, n (%) | 226 (80.1) |
| Dyslipidaemia, n (%) | 202 (71.6) |
| Diabetes mellitus, n (%) | 57 (20.2) |
| BMI (mean ± SD) | 27.0 (4.1) |
| Pre-admission medication | |
| Statin, n (%) | 37 (13.1) |
| ASA, n (%) | 49 (17.4) |
| P2Y12 inhibitor, n (%) | 2 (0.7) |
| β-Blocker, n (%) | 58 (20.6) |
| ACE-inhibitor, n (%) | 73 (25.9) |
| CCB, n (%) | 26 (9.2) |
| Laboratory data | |
| Total cholesterol (mg/dL) | 180.4 (42.4) |
| LDL cholesterol (mg/dL) | 117.8 (37.1) |
| HDL cholesterol (mg/dL) | 45.6 (14.6) |
| Serum creatinine (mg/dL) | 1.0 (0.2) |
| Leukocytes (per nL) | 12.1 (10.3) |
| hs-CRP (mg/dL) | 12.8 (33.5) |
| ACS characterisitcs | |
| Presentation as STE-ACS, n (%) | 180 (63.8) |
| CK peak (U/L; mean±SD) | 1387.3 (1560.4) |
| LV-EF at discharge (%; mean±SD) | 55.4 (10.2) |
ASA, acetylsalicylic acid; ACE, angiotensin converting enzyme; BMI, body mass index; CCB, calcium channel blocker; CAD, coronary artery disease; CRP, C-reactive protein; CK, creatine kinase; HDL, high-density lipoprotein; LVEF, left ventricular ejection fraction; LDL, low-density lipoprotein; n, number; PCI, percutaneous coronary intervention; SD, standard deviation; STE-ACS, ST segment elevation myocardial infarction.
OCT-derived culprit plaque features within the study population
| ACS patients (n = 282) | |
|---|---|
| OCT-culprit lesion characteristics | |
| Minimum lumen area (mm2; mean ± SD) | 2.0 (1.1) |
| Mean longitudinal extension (mm ± SD) | 17.7 (6.5) |
| Thrombus score (mean ± SD) | 111.8 (77.5) |
| RFC, n (%) | 204 (72.3) |
| IFC, n (%) | 78 (27.7) |
| Lipid components (LC) present, n (%) | 267 (95.1) |
| Thin cap fibroatheroma, n (%) | 217 (77.0) |
| Mean FC thickness (µm; mean ± SD) | 68.6 (39.2) |
| Calcified components (CC) present, n (%) | 207 (73.4) |
| Coexisting components (LCC) present, n (%) | 186 (66.0) |
| Macrophages present, n (%) | 266 (94.3) |
Mean FC thickness refers to fibrous caps, overlying a fibroatheroma.
FC, fibrous cap; IFC, intact fibrous cap as underlying pathology; LCC, - and calcified plaque components; n, number; RFC, ruptured fibrous cap as underlying pathology; SD, standard deviation.
Plaque composition in RFC-ACS and IFC-ACS
High-risk plaque features were significantly more prevalent in RFC-ACS when compared with IFC-ACS (P < 0.001). In fact, this was true for LC (100% vs. 80.8%; P < 0.001), CC (80.4% vs. 55.1%; P < 0.001) and LCC (77.0% vs.37.2%; P < 0.001; Table 3). Further, the prevalence of thin cap fibroatheroma was higher (97.1% vs. 24.4%; P < 0.001), fibrous caps, covering the plaque were thinner (56.2 vs. 107.6 µm; P < 0.001) and macrophages occurred more frequently (99.0% vs. 84.1%; P < 0.001) in RFC-ACS, when compared with IFC-ACS (Table 3).
Frequency of plaques containing lipid and calcium components and its overlap in ACS-causing culprit lesions with ruptured and intact fibrous cap
| Parameter | RFC-ACS (n = 204) | IFC-ACS (n = 78) | P-value |
|---|---|---|---|
| Lipid components (LC) present, n (%) | 204 (100) | 63 (80.8) | <0.001 |
| Calcium components (CC) present, n (%) | 164 (80.4) | 43 (55.1) | <0.001 |
| Coexisting components (LCC) present, n (%) | 157 (77.0) | 29 (37.2) | <0.001 |
| Minimum lumen area (MLA) (mm2; mean ± SD) | 1.9 (0.6) | 2.3 (1.7) | ns |
| Thin cap fibroatheroma, n (%) | 198 (97.1) | 19 (24.4) | <0.001 |
| Mean FC thickness (µm; mean ± SD) | 56.2 (15.2) | 107.6 (60.5) | <0.001 |
| Macrophages present, n (%) | 202 (99.0) | 64 (82.1) | <0.001 |
The presence of each individual component along the entire culprit lesion; mean FC thickness refers to fibrous caps, overlying a fibroatheroma.
IFC-ACS, intact-fibrous cap acute coronary syndrome; LCC, lipid- and calcified plaque components; n, number; RFC-ACS, ruptured-fibrous cap acute coronary syndrome.
Quantification of plaque contents within distinct zones in RFC-ACS
A comprehensive analysis for the RFC-ACS group respecting the longitudinal culprit plaque structure revealed further significant differences for the distribution of lipid-, calcified components, and their coexistence along the rupture point (Table 4 and Figure 2). Despite comparable CC along the longitudinal plaque extent (P=ns) both LC (100% vs. 69.8%; P < 0.001) and LCC (22.7% vs. 6.8%; P < 0.001) were significantly increased in the RZ when compared with the BZ. The relative increase to the RZ was 43.3% for LC and 233.8% for LCC (Figure 2).
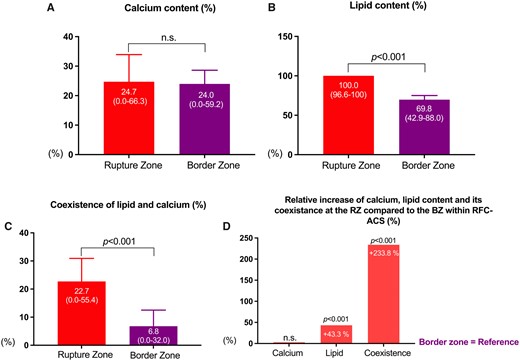
Differences among the extended rupture and border zone within ruptured fibrous cap ACS-causing culprit lesions (n = 204). ACS, acute coronary syndrome. Figure 2A, 2B and 2C: Show the percentage of individual plaque components (Figure 2A: Calcified components (CC), Figure 2B: Lipid components (LC), Figure 2C: Coexisting components (LCC) within Rupture and Border Zone). Figure 2D: Displays the relative increase of each component at the Rupture zone as compared to the Border Zone.
Differences among border zone and extended rupture zone within ruptured fibrous cap ACS-causing culprit lesions (n = 204)
| Parameter | BZ | RZ | Relative increase of individual components from BZ to RZ (%)a | P-value |
|---|---|---|---|---|
| Lipid components (LC) (%)b | 69.8 (42.9–88.0) | 100 (96.6–100) | 43.3 | <0.001 |
| Calcified components (CC) (%)b | 24.0 (0.00–59.2) | 24.7 (0.0–66.3) | 2.9 | ns |
| Coexisting components (LCC) (%)b | 6.8 (0.0–32.0) | 22.7 (0.0–55.4) | 233.8 | <0.001 |
All values are expressed as median (inter-quartile range); % change based on median values. P-values >0.05 are considered not significant.
Relative increase of individual component from border zone to extended rupture zone based on median values (in %).
Relative amount of individual component within the corresponding zone presented as median (in %).
ACS, acute coronary syndrome; BZ, border zone; ns: not significant; RZ, extended rupture zone.
Clinical and culprit lesion characteristics in patients with a high or low degree of coexisting plaque components
Finally, when comparing RFC-ACS lesions with a high and low degree of coexistence (over/above the study specific median value), no statistically significant differences in associated clinical features, previous drug therapy or OCT-derived plaque features were detected (Supplementary data online, Table S1).
Discussion
For the first time, this study demonstrates the characteristics of the calcium-lipid interface in distinct plaque zones of the culprit lesion in a large cohort of ACS patients using high-resolution intracoronary imaging. First, when comparing RFC-ACS to IFC-ACS, an increase in conventional high-risk plaque structures and most importantly in LC, CC, and LCC in RFC-ACS became apparent. Secondly, LC and LCC characterize the region of plaque rupture when compared with the BZs of the culprit lesion. Thirdly, the increase from the border to the rupture region of the plaque became particularly evident for LCC. These findings demonstrate that the extended rupture zone is characterized by a coexistence of lipid and calcium components and suggest that the interplay between these components may promote plaque rupture (Figure 3).
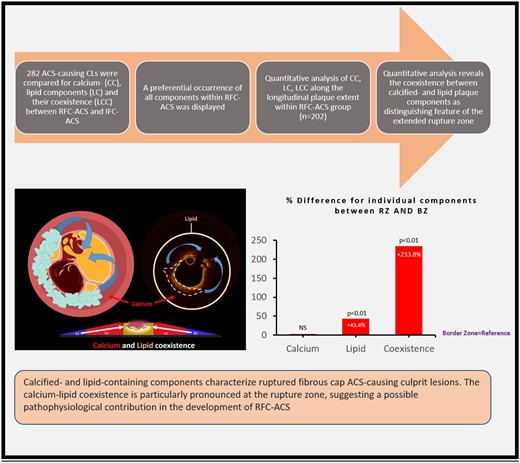
Summary of the figure. The Coexistence, occurrence and association of Calcified- and lipid-containing plaques with rupture points in patients with acute coronary syndrome (RFC-ACS).
In accord with previous studies,22–24 conventional high-risk plaque structures occurred more frequently in RFC-ACS when compared with IFC-ACS. Of note, the prevalence of macrophages in our current study was higher, when compared with some previous studies.25,26 Importantly, data about the exact longitudinal extent of the culprit lesion and reference area for macrophage measurements have not been provided in these publications,25,26 allowing for a certain degree of variability. Further, macrophages were assessed by means of a segmentation software not used in our current analysis.25,26 Importantly, within our study cohort, a high degree of internal validity was ensured by cross-readings within a second, independent core laboratory and we were able to reproduce highly statistically significant differences in the prevalence of macrophages between RFC-ACS and IFC-ACS, as previously published.23
Most importantly, this study confirms a higher lipid- as well as calcium-content in RFC-ACS when compared with IFC-ACS22–24 and points out for the first-time their interface by focusing on a coexistence between both components within the culprit plaque (Figure 3). The impact of lipid accumulation on plaque weakening, ultimately favouring plaque rupture13,14 is well established. The higher amount of LC within RFC-ACS and especially within the extended rupture zone, as observed in this study, is not surprising. The relation between calcium and plaque vulnerability, however, seems to be more complex, since an increasing calcium content within a plaque does not necessarily alter its dynamics.16 Different patterns of calcification have been reported to convey distinct effects on plaque vulnerability.27 Notably, the interaction between calcified and LC at their border has previously been postulated as a potential causal contributor to plaque rupture in a computer-based ex vivo model.15 This study for the first time investigated this relation in vivo by quantifying the extent and localization of lipid and calcified components of culprit coronary lesions by high-resolution OCT imaging, the gold standard for in-vivo plaque characterization.21,28 Although this study cannot causally elucidate whether biomechanical, inflammatory, or both factors together finally trigger plaque rupture,8 it provides important insights into the pathophysiology of plaque rupture in patients suffering from RFC-ACS.
Some limitations merit consideration. First, with respect to the study design, we report associative findings, rather than explaining causal relationships. Still, given the very comprehensive and broad approach of the OPTICO-ACS study program, which aims at investigating the pathophysiology of ACS in a large and prospectively enrolled patient cohort,5 our findings advance our understanding of plaque rupture. Secondly, given the broad inclusion criteria of the OPTICO-ACS study program, we assume our findings to be representative for the general ACS population. However, since OCT imaging was not possible in left main disease, severely calcified vessels, distal lesion locations, or when identification of the culprit lesion was unclear, the findings of this study may not extend to these patients. Thirdly, although OCT has a superior resolution when compared with other invasive or non-invasive imaging modalities21 the assessment of calcified plaque components in lesions with overlying thrombus or necrotic core is limited and therefore, calcified areas may be missed within lesions with high residual thrombus burden or behind necrotic cores close to the media.29,30
Conclusions
This analysis from the OPTICO-ACS study provides for the first time evidence for a principal role of the coexistence between calcified and lipid plaque components in the pathophysiology of plaque rupture in ACS patients. The distinct longitudinal distribution of calcium and lipids within the plaque advances our understanding of coronary plaque progression and provides the basis for future personalized preventive therapeutic approaches.
Supplementary data
Supplementary data are available at European Heart Journal - Cardiovascular Imaging online.
Funding
This study was supported by a CRU grant form the Berlin Institute of Health (BIH) and the German Centre for Cardiovascular Research (DZHK; FKZ: 81Z2100202). Furthermore an educational grant from Abbott Vascular (formerly: St. Jude Medical) provided OCT imaging.
Data availibility
The data underlying this article will be shared on reasonable request to the corresponding author.
References
Author notes
Conflict of interest: The authors have nothing to declare.
