


Abstract
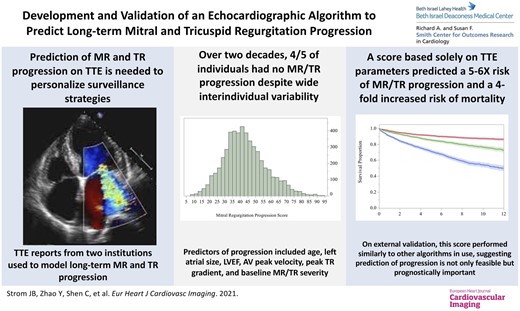
Prediction of mitral (MR) and tricuspid (TR) regurgitation progression on transthoracic echocardiography (TTE) is needed to personalize valvular surveillance intervals and prognostication.
Structured TTE report data at Beth Israel Deaconess Medical Center, 26 January 2000–31 December 2017, were used to determine time to progression (≥1+ increase in severity). TTE predictors of progression were used to create a progression score, externally validated at Massachusetts General Hospital, 1 January 2002–31 December 2019. In the derivation sample (MR, N = 34 933; TR, N = 27 526), only 5379 (15.4%) individuals with MR and 3630 (13.2%) with TR had progression during a median interquartile range) 9.0 (4.1–13.4) years of follow-up. Despite wide inter-individual variability in progression rates, a score based solely on demographics and TTE variables identified individuals with a five- to six-fold higher rate of MR/TR progression over 10 years (high- vs. low-score tertile, rate of progression; MR 20.1% vs. 3.3%; TR 21.2% vs. 4.4%). Compared to those in the lowest score tertile, those in the highest tertile of progression had a four-fold increased risk of mortality. On external validation, the score demonstrated similar performance to other algorithms commonly in use.
Four-fifths of individuals had no progression of MR or TR over two decades. Despite wide interindividual variability in progression rates, a score, based solely on TTE parameters, identified individuals with a five- to six-fold higher rate of MR/TR progression. Compared to the lowest tertile, individuals in the highest score tertile had a four-fold increased risk of mortality. Prediction of long-term MR/TR progression is not only feasible but prognostically important.
Introduction
Mitral (MR) and (TR) tricuspid regurgitation are common forms of valvular heart disease (VHD) on transthoracic echocardiography (TTE).1 Progression to severe MR or TR may result in heart failure, pulmonary hypertension, arrhythmias, or death.2 With the evolution of both surgical and transcatheter treatments, routine surveillance for disease progression is widely performed to identify when an intervention is indicated.3
Little is known about the long-term progression of MR and TR, the optimal frequency of TTE surveillance, and the relationship between long-term progression and mortality risk. Absent new symptoms, the 2014 American Heart Association/American College of Cardiology (AHA/ACC) guidelines recommend routine echocardiographic surveillance for progression of MR every 6–12 months for severe MR, 1–2 years for moderate MR, and 3–5 years for mild MR,3 largely based on expert consensus opinion, and recently published European Society of Cardiology guidelines on both heart failure and VHD do not address long-term progression.4,5 Long-term progression of mitral regurgitation has primarily been evaluated in specific disease subsets.6–8 Data on long-term TR progression are even more limited with guidelines recommending ‘periodic monitoring’,3,9–11 resulting in little evidence informing whether the current practice of periodic surveillance is insufficient or too frequent. Furthermore, individuals in whom surveillance TTE can be safely deferred are challenging to identify.
The goal of this study was to determine (i) the average rates of progression of MR and TR in a large cohort of patients with serial TTEs, (ii) to identify TTE factors predicting long-term progression of MR and TR, and (iii) to derive and externally validate, an imaging-based risk score to identify an individual’s rate of long-term MR and TR progression.
Methods
Study population
Report data from 220 135 consecutive TTEs on 118 647 patients (>18 years old) at Beth Israel Deaconess Medical Center were initially considered for inclusion. As part of routine care, TTE data were adjudicated by the National Board of Echocardiography certified faculty echocardiographers and data stored in a large electronic database maintained by the Department of Clinical Informatics. These data were previously directly linked to vital status information from the Social Security Death Master File, 2000–17. Individuals with a baseline TTE with a mitral or tricuspid valve prosthesis, annuloplasty ring, MitraClip, or evidence of suspected or confirmed endocarditis were excluded. The sample was restricted to those with ≥2 TTEs and 0–3+ MR/TR to assess progression. All TTEs were acquired using General Electric E-95, Vivid 7, Vivid Q, Vivid 9, Vivid Q, Vivid I, Vivid S70, and Hewlett Packard Medical Products 5000 and 5500 echocardiographs.
Covariates and outcomes
Age, sex, test location, image quality, inpatient/outpatient status, blood pressure, heart rate, and height as well as variables such as the presence of mitral valve prolapse, left and right ventricular and atrial sizes, left ventricular wall thickness, cavity size, left ventricular ejection fraction (LVEF), estimated peak tricuspid regurgitant gradient (TRG) via the modified Bernoulli equation,12 and transmitral Doppler filling patterns were extracted from TTE reports. The severity of MR and TR were graded using an integrative method as recommended by the American Society of Echocardiography guidelines.13 In both derivation and validation analyses, no distinction was made between primary and secondary MR/TR in order to promote ease of use and simplicity of imaging score calculation, with minimal image analysis or post-processing needed. Trace MR/TR was categorized with 1+ regurgitation. Time to progression was calculated as the time from the baseline/index TTE to the first increase of ≥1+ regurgitant severity grade.
Inter-rater agreement
Core lab adjudication of MR and TR severity was performed in a subset of 20 randomly selected patients with MR or TR. A single experienced reader (J.B.S.), blinded to the prior interpretation of valvular severity, reviewed these studies and determined quantitative metrics of MR and TR severity. Using these metrics, the adjudicator determined MR and TR severity using the integrative method as recommended by guidelines.8 The severity was compared to the initial reader’s determination using a weighted kappa statistic.
Statistical analysis
Development of MR and TR progression models
Baseline characteristics of included individuals were compared across grades of MR/TR using ANOVA for continuous variables and the χ2 test for categorical variables. Q–Q plots were used to determine normality for continuous data. The dataset was randomly split into a 2/3 derivation and a one-third testing set. Estimates of time to progression were obtained via a proportional hazards regression model, designed to handle left-censored, right-censored, and interval-censored failure time data.14 In total, six different types of progression (1+ to 2+, 1+ to 3+, 1+ to 4+, 2+ to 3+, 2+ to 4+, 3+ to 4+) were modelled based on 18 different possible data patterns (Supplementary data online, Appendix Table S1). Alluvial plots were used to graph progression from baseline to 1-, 5-, and 10-years after initial TTE.
Multivariable predictors of time to progression were determined separately for MR and TR progression using a similar proportional hazards model. Variables were chosen for inclusion based on physiologic relevance and univariate standardized effect size at the time of the initial TTE. Variables that were no longer significant at a P < 0.05 level after the inclusion in the multivariable model were removed.
Progression score development and internal validation
C-statistics were determined for the outcome of any progression using the final models in both derivation and testing datasets. Calibration was assessed in the testing set via plots of predicted vs. observed rates of progression at 1-, 5-, and 10-years after the initial TTE. Model estimates were normalized to a 100-point scale to create a progression score. This score was divided into tertiles and rates of progression determined stratified by tertile.
Mortality outcomes
The Kaplan–Meier techniques were used to determine time to all-cause mortality by score tertile in the testing dataset. Cox proportional hazards regression was used to determine the overall hazard ratio (HR) for all-cause mortality by score tertile. All analyses were done in SAS v 9.4 (SAS Institute, Cary, NC, USA) using a two-tailed P < 0.05.
External validation
Of 231 969 individuals receiving TTEs at the Massachusetts General Hospital (MGH), 2002–19, a total of 73,559 individuals (32.2%) had ≥2 TTEs and non-missing MR information, and 73 630 individuals (31.7%) had ≥2 TTEs and non-missing TR information.
As missingness was 64.5% for the left atrial superoinferior dimension (LASI), external validation was performed using the left atrial anteroposterior dimension. Using this measure, 22 536 individuals were included in the MR model and 22 206 individuals in the TR model. All analyses were done in R v3.6.2 (R Studio, 2020) using a two-tailed P < 0.05. The studies were approved by Institutional Review Boards at separate institutions with waivers of informed consent.
Results
Overall results
A total of 107 783 individuals were linked to 26 163 deaths. Nine-hundred seventy individuals (0.9%) were excluded due to presence of a mitral valve prosthesis or annuloplasty ring, 36 individuals (0.03%) due to presence of a tricuspid valve prosthesis or annuloplasty ring, and 320 individuals (0.3%) due to suspected or confirmed infectious endocarditis (Figure 1). Of the 106 457 individuals remaining after exclusions (58.6 ± 18.8 years, 51.1% female), a total of 104,851 (98.5%) had MR information and 104,740 (98.4%) had TR information (Tables 1 and 2). These included 4431 (4.2%) and 1219 (1.2%) with no MR/TR respectively, 87 908 (83.8%) and 90 176 (86.1%) with mild (1+) MR/TR, respectively, 10 130 (9.7%) and 10 983 (10.5%) with moderate (2+) MR/TR respectively, 1839 (1.8%) and 1823 (1.7%) with moderate-to-severe (3+) MR/TR respectively, and 543 (0.5%) and 539 (0.5%) with severe (4+) MR/TR, respectively. A total of 38 908 (36.5%) individuals had ≥2 TTEs (TTEs = 136 116), of which, 34 933 (89.8%) had valvular 0–3+ MR severity data and 27 526 (70.7%) had 0–3+ TR severity data.
![Flowchart of included patients in the derivation and internal and external validation cohorts. Of 118 647 individuals in the derivation cohort [Beth Israel Deaconess Medical Center (BIDMC)], 12 190 (10.3%) were excluded due to presence of a mitral valve or tricuspid valve prosthesis or annuloplasty, mild to moderate MR, or suspected or confirmed infective endocarditis (e.g. a visualized vegetation) on baseline TTE. Of those meeting inclusion in the BIDMC dataset (N = 106 457), 104 851 (98.5%) had MR information and 104 740 (98.4%) had TR information. Of these, 33.3% of those with MR and 26.3% with TR had more than one TTE during the study period. Among the external validation cohort [Massachusetts General Hospital (MGH)], 231 969 individuals with MR and TR information were initially considered for exclusion. Of these, 80 930 (34.9%) had more than one TTE during the study period. Individuals aged ≤ 18 (MR model, N = 51 023; TR model, N = 51 424) were excluded. A total of 22 536 and 22 206 individuals were included in the final MR and TR models, respectively.](https://oup.silverchair-cdn.com/oup/backfile/Content_public/Journal/ehjcimaging/23/12/10.1093_ehjci_jeab254/2/m_jeab254f1.jpeg?Expires=1750076996&Signature=5E-S6N71upbJuZw9QtLa5b9P-vygYDe3scyIHzyRuYzHgPiLmG5t0mcJwrA3usQ8X8lFIIFSTN2twxMmDIDoV8nfAhxkNytCTq9EqdqEh8B-MmbC6sVOmmpGXoIyu5TZq2-BHhRDdu~2o8QpmpU-boulDUA~VAKmnDTO07bbUNIuayQo47ppUH8FYE4tB6cPoyQ3KDJ-z~S6unA6bMYvzEwDVn~PZsSiLo12s6k24iKjW1BSkSzGUW1c~0K9eWNmE76dtwtbiqR4yOsSDf9Ny5h04JhwrvOFK4QheIQatylXp7EqAKvpKzW7sfO542McRwdKZFr3fIEnENZiidvPTw__&Key-Pair-Id=APKAIE5G5CRDK6RD3PGA)
Flowchart of included patients in the derivation and internal and external validation cohorts. Of 118 647 individuals in the derivation cohort [Beth Israel Deaconess Medical Center (BIDMC)], 12 190 (10.3%) were excluded due to presence of a mitral valve or tricuspid valve prosthesis or annuloplasty, mild to moderate MR, or suspected or confirmed infective endocarditis (e.g. a visualized vegetation) on baseline TTE. Of those meeting inclusion in the BIDMC dataset (N = 106 457), 104 851 (98.5%) had MR information and 104 740 (98.4%) had TR information. Of these, 33.3% of those with MR and 26.3% with TR had more than one TTE during the study period. Among the external validation cohort [Massachusetts General Hospital (MGH)], 231 969 individuals with MR and TR information were initially considered for exclusion. Of these, 80 930 (34.9%) had more than one TTE during the study period. Individuals aged ≤ 18 (MR model, N = 51 023; TR model, N = 51 424) were excluded. A total of 22 536 and 22 206 individuals were included in the final MR and TR models, respectively.
Baseline characteristics of individuals with mitral regurgitation (N = 104 851)
| No MR | Mild (1+) MR | Moderate (2+) MR | Moderate to severe (3+) MR | Severe (4+) MR | |
|---|---|---|---|---|---|
| (N = 4431) | (N = 87 908) | (N = 10 130) | (N = 1839) | (N = 543) | |
| Age (years) | 57.2 ± 17.9 | 57.8 ± 18.0 | 72.7 ± 14.6 | 74.1 ± 14.5 | 71.3 ± 15.6 |
| Female, n (%) | 2166 (48.9) | 45457 (51.7) | 5432 (53.6) | 1021 (55.5) | 277 (51.0) |
| Bedside study, n (%) | 1392 (31.4) | 19079 (21.7) | 3326 (36.4) | 670 (36.4) | 233 (42.9) |
| Inpatient study, n (%) | 2373 (53.6) | 37381 (42.5) | 6323 (62.4) | 1295 (70.4) | 388 (71.5) |
| Suboptimal image quality, n (%) | 1016 (22.9) | 13467 (15.3) | 1599 (15.8) | 217 (11.8) | 57 (10.5) |
| Systolic blood pressure (mmHg) | 127.1 ± 34.8 | 127.6 ± 28.7 | 129.9 ± 30.4 | 127.1 ± 49.1 | 122.6 ± 54.1 |
| Diastolic blood pressure (mmHg) | 73.2 ± 36.6 | 73.9 ± 32.4 | 72.1 ± 33.5 | 71.6 ± 39.1 | 69.1 ± 23.1 |
| Heart rate (beats per minute) | 79.1 ± 19.8 | 74.4 ± 20.3 | 76.0 ± 23.3 | 80.1 ± 29.5 | 82.1 ± 31.9 |
| Mitral valve prolapse, n (%) | 73 (1.7) | 1509 (1.7) | 428 (4.2) | 227 (12.3) | 167 (30.8) |
| Left atrial size (cm) | |||||
| AP | 3.7 ± 0.7 | 3.8 ± 0.7 | 4.4 ± 0.8 | 4.7 ± 0.8 | 4.8 ± 0.9 |
| SI | 5.0 ± 0.8 | 5.0 ± 0.8 | 5.7 ± 0.9 | 6.0 ± 1.0 | 6.2 ± 1.0 |
| Right atrial length (cm) | 4.8 ± 0.7 | 4.9 ± 0.7 | 5.4 ± 0.9 | 5.6 ± 1.0 | 5.6 ± 1.1 |
| Left ventricular dimension (cm) | |||||
| End diastole | 4.5 ± 0.6 | 4.6 ± 0.6 | 4.9 ± 0.9 | 5.3 ± 1.0 | 5.6 ± 1.0 |
| End systole | 2.8 ± 0.6 | 2.9 ± 0.6 | 3.3 ± 1.0 | 3.8 ± 1.2 | 4.0 ± 1.3 |
| Left ventricular ejection fraction (%) | 57.2 ± 11.9 | 55.9 ± 12.5 | 46.2 ± 17.3 | 40.3 ± 20.0 | 41.1 ± 20.4 |
| Right ventricular diastolic diameter (cm) | 3.3 ± 0.7 | 3.4 ± 0.8 | 3.7 ± 0.9 | 3.9 ± 0.9 | 4.0 ± 1.0 |
| Peak transaortic velocity (m/s) | 1.5 ± 0.5 | 1.5 ± 0.5 | 1.8 ± 0.9 | 1.9 ± 1.1 | 1.8 ± 0.9 |
| Transmitral peak E-wave velocity (m/s) | 0.8 ± 0.3 | 0.8 ± 0.3 | 1.0 ± 0.3 | 1.2 ± 0.4 | 1.3 ± 0.3 |
| Transmitral peak A-wave velocity (m/s) | 0.8 ± 0.4 | 0.8 ± 0.3 | 0.8 ± 0.4 | 0.8 ± 0.5 | 0.8 ± 0.4 |
| Transmitral E/A ratio | 1.1 ± 0.5 | 1.2 ± 0.5 | 1.3 ± 0.8 | 1.7 ± 0.9 | 1.9 ± 1.0 |
| E/e′ ratio | 8.7 ± 3.6 | 9.1 ± 3.8 | 13.6 ± 6.4 | 15.9 ± 7.2 | 18.8 ± 9.7 |
| Estimated peak tricuspid regurgitant pressure (mmHg) | 25.1 ± 10.0 | 25.9 ± 9.3 | 34.3 ± 11.8 | 39.7 ± 13.5 | 41.7 ± 14.2 |
Values are listed as means ± SDs unless otherwise indicated. P-values for all comparisons are < 0.001.
AP, anteroposterior dimension (measured on the parasternal long axis view); n, number; SD, standard deviation; SI, superoinferior dimension (measured in the apical four-chamber view).
Baseline characteristics of individuals with tricuspid regurgitation (N = 104 740)
| No TR | Mild ±1+) TR | Moderate (2+) TR | Moderate to severe (3+) TR | Severe (4+) TR | |
|---|---|---|---|---|---|
| (N = 1291) | (N = 90 176) | (N = 10 983) | (N = 1823) | (N = 539) | |
| Age (years) | 56.9 ± 16.6 | 57.8 ± 18.0 | 73.4 ± 15.0 | 77.6 ± 13.6 | 76.8 ± 14.4 |
| Female, n (%) | 507 (39.3) | 46229 (51.3) | 6716 (61.1) | 1161 (63.7) | 324 (60.1) |
| Portable study, n (%) | 358 (29.4) | 19045 (21.1) | 4087 (37.2) | 765 (42.0) | 260 (48.2) |
| Inpatient study, n (%) | 601 (49.3) | 37896 (42.0) | 7217 (65.7) | 1375 (75.4) | 432 (80.2) |
| Suboptimal image quality, n (%) | 289 (23.7) | 13014 (14.4) | 1801 (16.4) | 264 (14.5) | 77 (14.3) |
| Systolic blood pressure (mmHg) | 127.8 ± 32.0 | 127.8 ± 29.1 | 128.0 ± 35.0 | 125.2 ± 45.7 | 124.9 ± 64.3 |
| Diastolic blood pressure (mmHg) | 76.1 ± 45.4 | 74.0 ± 32.3 | 70.8 ± 35.0 | 68.6 ± 26.2 | 67.3 ± 14.8 |
| Heart rate (beats per minute) | 79.0 ± 17.3 | 74.2 ± 19.9 | 77.1 ± 22.0 | 81.1 ± 24.4 | 80.7 ± 18.9 |
| Mitral valve prolapse, n (%) | 18 (1.5) | 2467 (2.7) | 410 (3.7) | 67 (3.7) | 19 (3.5) |
| Left atrial size (cm) | |||||
| AP | 3.8 ± 0.7 | 3.8 ± 0.7 | 4.2 ± 0.9 | 4.6 ± 0.9 | 4.8 ± 0.9 |
| SI | 5.0 ± 0.8 | 5.0 ± 0.8 | 5.6 ± 1.0 | 6.1 ± 1.0 | 6.4 ± 1.1 |
| Right atrial length (cm) | 4.8 ± 0.7 | 4.8 ± 0.7 | 5.4 ± 0.9 | 6.0 ± 1.1 | 6.6 ± 1.2 |
| Left ventricular dimension (cm) | |||||
| End diastole | 4.6 ± 0.7 | 4.6 ± 0.7 | 4.6 ± 0.9 | 4.7 ± 1.0 | 4.7 ± 1.0 |
| End systole | 2.9 ± 0.6 | 2.9 ± 0.6 | 3.0 ± 0.9 | 3.2 ± 1.1 | 3.4 ± 1.3 |
| Left ventricular ejection fraction (%) | 56.0 ± 11.7 | 55.7 ± 12.7 | 50.4 ± 16.8 | 46.2 ± 19.2 | 44.2 ± 19.2 |
| Right ventricular diastolic diameter (cm) | 3.3 ± 0.7 | 3.3 ± 0.7 | 3.9 ± 0.9 | 4.4 ± 0.9 | 4.7 ± 1.0 |
| Peak transaortic velocity (m/s) | 1.5 ± 0.6 | 1.5 ± 0.6 | 1.8 ± 0.9 | 1.9 ± 0.9 | 1.8 ± 0.9 |
| Transmitral peak E-wave velocity (m/s) | 0.8 ± 0.4 | 0.8 ± 0.3 | 1.0 ± 0.4 | 1.1 ± 0.4 | 1.1 ± 0.4 |
| Transmitral peak A-wave velocity (m/s) | 0.8 ± 0.4 | 0.8 ± 0.3 | 0.8 ± 0.4 | 0.8 ± 0.5 | 0.7 ± 0.4 |
| Transmitral E/A ratio | 1.1 ± 0.6 | 1.2 ± 0.5 | 1.3 ± 0.8 | 1.7 ± 1.0 | 1.8 ± 1.0 |
| E/e′ ratio | 9.3 ± 4.4 | 9.2 ± 4.1 | 12.8 ± 6.3 | 14.1 ± 6.5 | 14.8 ± 10.9 |
| Estimated peak tricuspid regurgitant pressure (mmHg) | 22.4 ± 7.9 | 25.3 ± 8.3 | 37.9 ± 12.5 | 45.3 ± 15.9 | 43.3 ± 17.8 |
Values are listed as means ± SDs unless otherwise indicated. P-values for all comparisons are < 0.001.
AP, anteroposterior dimension (measured on the parasternal long axis view); n, number; SD, standard deviation; SI, superoinferior dimension (measured in the apical four-chamber view).
Inter-rater agreement
Quantitative metrics for MR and TR severity in a random subset of 20 patients with MR and TR respectively are provided in Supplementary data online, Tables S2 and S3. The weighted kappa statistic for inter-rater agreement on MR severity was 0.91 (95% CI 0.75–1.00). The weighted kappa statistic for inter-rater agreement on TR severity was 0.90 (95% CI 0.74–1.00).
Time to progression
Of those with ≥2 TTEs and non-missing MR/TR information (MR, N = 34 933; TR, N = 27 526), 5379 (15.4%) individuals with MR and 3630 (13.2%) with TR had progression over a median [interquartile range (IQR)] 9.0 (4.1–13.4) years of follow-up (Figure 2). Of those starting with 0–1+ MR, 0.6% had 3–4+ MR at 1-year, 0.6% had 3–4+ MR at 5-years, and 0.6% had 3–4+ MR at 10-years. Of those starting with 2+ MR, 5.3% had 3–4+ MR at 1-year, 4.3% had 3–4+ MR at 5-years, and 4.3% had 3–4+ MR at 10-years. Of those starting with 0–1+ TR, 0.8% had 3–4+ TR at 1-year, 1.0% had 3–4+ TR at 5-years, and 1.0% had 3–4+ TR at 10-years. Of those starting with 2+ TR at baseline, 7.4% had 3–4+ TR at 1-year, 9.0% had 3–4+ TR at 5-years, and 10.0% had 3–4+ TR at 10-years.
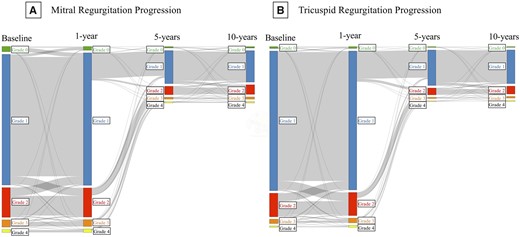
Alluvial plots demonstrating timing of long-term MR and TR progression. Alluvial plots indicating the number of individuals with mitral (A) or tricuspid (B) regurgitation of Grade 0+ (green), 1+ (blue), 2+ (red), 3+ (orange), or 4+ (yellow) at baseline and at 1-, 5-, and 10-years after the initial echocardiogram.
As the timing of repeat TTE could be influenced by progression, we evaluated the TTE intervals with and without progression. The median (IQR) time between TTEs was 849 (243–1977) days. The median (IQR) time between TTEs was 826 (263–1947) days for those with progression and 839 (241–1981) days for those without progression (P = 0.42). The median (IQR) time to progression was 909 (240–2226) days for MR and 917 (224–2160) days for TR (Supplementary data online, Tables S4). Time to progression decreased with increasing regurgitant severity and was similar for MR/TR (Supplementary data online, Figures S1–S3).
Predictors of progression
Univariate estimates of the risk of progression are presented in Supplementary data online, Appendix Table S5, ranked by standardized effect size. Age, LASI, TRG, AVV, LVEF, and stage of valvular disease severity remained significant multivariable predictors of valvular progression and were used for score development (P < 0.0001 for all; Table 3).
Multivariable predictors of time to progression and calculation of the progression score for mitral and tricuspid regurgitation
| Mitral regurgitation progression model | ||||
|---|---|---|---|---|
| Parameter | Beta coefficient | Hazard ratioa (95% CI) | P-value | Impact on scoreb (starting with a base score of 20) |
| Age (years) | 0.3238 | 1.04 (1.03–1.04) | <0.001 | +5 points for each 10-year increase in age above 18 |
| Left atrial superoinferior dimension (cm) | 0.2658 | 1.32 (1.23–1.42) | <0.001 | +2 points for each 0.5 cm increase in left atrial size above 5.7 cm |
| Estimated tricuspid regurgitant pressure gradient (mmHg) | 0.0079 | 1.01 (1.00–1.02) | 0.009 | +1 point for each 8 mmHg increase in estimated tricuspid regurgitant pressure gradient above 35 mmHg |
| Aortic valve peak velocity (m/s) | 0.2347 | 1.29 (1.20–1.38) | <0.001 | +3.5 points for each 1 m/s increase in aortic peak velocity above 2 m/s |
| Left ventricular ejection fraction (%) | −0.2299 | 0.98 (0.97–0.98) | <0.001 | −1 point for each 3% increase in left ventricular ejection fraction above 54% |
| Initial MR severity | ||||
| 0 or 1+ | Ref | Ref | Ref | +0 points |
| 2+ | 0.7000 | 1.93 (1.63–2.27) | <0.001 | +10.5 points |
| 3+ | 0.3108 | 1.24 (0.95–1.63) | 0.11 | +4.5 points |
| Tricuspid regurgitation progression model | ||||
| Parameter | Beta coefficient | Hazard ratioa (95% CI) | P-value | Impact on scoreb (starting with a base score of 23) |
| Age (years) | 0.0332 | 1.04 (1.03–1.04) | <0.001 | +4.5 points for each 10-year increase in age above 18 |
| Left atrial superoinferior dimension (cm) | 0.3398 | 1.44 (1.35–1.54) | <0.001 | +2.25 points for each 0.5 cm increase in left atrial size above 5.7 cm |
| Estimated tricuspid regurgitant pressure gradient (mmHg) | 0.0158 | 1.02 (1.01–1.02) | <0.001 | +1 point for each 5 mmHg increase in estimated tricuspid regurgitant pressure gradient above 35 mmHg |
| Aortic valve peak velocity (m/s) | 0.2496 | 1.30 (1.22–1.38) | <0.001 | +3.5 points for each 1 m/s increase in aortic peak velocity above 2 m/s |
| Left ventricular ejection fraction (%) | −0.0186 | 0.98 (0.98–0.99) | <0.001 | −1 point for each 4% increase in left ventricular ejection fraction above 54% |
| Initial TR severity | ||||
| 0 or 1+ | Ref | Ref | Ref | +0 points |
| 2+ | 0.4816 | 1.62 (1.40–1.87) | <0.001 | +6.5 points |
| 3+ | −0.0509 | 0.99 (0.77–1.28) | 0.96 | −0.7 points |
Represents the hazard ratio for progression for a 1-unit increase in the parameter.
To calculate the progression score, take the baseline score (20 for MR, 23 for TR) and add or subtract points as indicated to calculate the final score. Tricuspid regurgitant gradient was determined via the modified Bernoulli equation.
Score development and internal validation
For the MR model, the derivation sample (N = 10 277) c-statistic was 0.76 (95% CI 0.74–0.78) and testing sample (N = 5126) c-statistic was 0.76 (95% CI 0.74–0.79). For the TR model, the derivation sample (N = 10 508) c-statistic was 0.75 (0.74–0.77) and testing sample (N = 5028) c-statistic was 0.74 (0.72–0.77). Predicted and observed progression were similar at each time point evaluated (Supplementary data online, Figure S4). Model beta coefficients were normalized to a 100-point scale to create a progression score (Table 3).
The mean ± SD progression scores in the validation sample were 43.0 ± 13.5 (MR) and 53.7 ± 13.6 (TR) (Supplementary material online, Figures S5 and S6). For the MR model, 3.3% in the low-score tertile (MR, ≤ 39; TR ≤ 48), 8.6% in the intermediate-score tertile (MR, 40–49; TR 49–58) and 20.1% of the high-score tertile (MR, ≥ 50; TR ≥ 59) demonstrated progression (P < 0.001). For the TR model, 4.4% in the low-score tertile, 10.2% in the intermediate-score tertile, and 21.2% in the high-score tertile demonstrated progression (Figure 3; P < 0.001).
Cumulative incidence functions demonstrating the proportion of individuals with each valvular severity grade at time intervals since the initial echocardiogram demonstrating mild (1+) mitral or tricuspid regurgitation, stratified by tertile of valvular progression score. The Y-axis indicates the proportion of individuals with each valvular severity grade (i.e. 2+, 3+, 4+) since the initial echocardiogram demonstrating 1+ MR (top panels) or TR (bottom panels) stratified by valvular progression score tertile. The proportion with 2+ MR/TR is indicated by the blue line, 3+ by the red line, and 4+ by the green line. Scores are determined at the time of the initial echocardiogram. Estimates are right-censored at the last observation. Separate curves demonstrating progression in those with 2+ or 3+ MR/TR at baseline by score tertile are not shown.
Risk of mortality
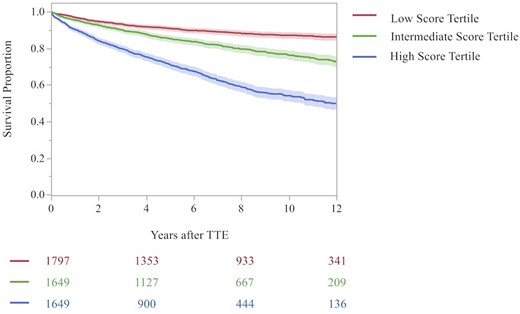
Of those in the MR testing dataset (N = 5126), 1091 (21.3%) died. Of these, 200 (11.1%) individuals in the low score tertile, 313 (19.0%) in the intermediate score tertile, and 578 (35.1%) in the high score tertile died (Figure 4A; high vs. low tertile, HR 4.22, 95% CI 3.69–4.96, P < 0.001; intermediate vs. low tertile, HR 1.90, 95% CI 1.59–2.27, P < 0.001). Of those in the TR testing dataset (N = 5028), 1072 (21.3%) died during the study period. Of these, 171 (10.6%) individuals in the low score tertile, 312 (18.2%) in the intermediate score tertile, and 589 (35.0%) in the high score tertile died (Figure 4B; high vs. low tertile, HR 4.38, 95% CI 3.69–5.19; P < 0.001; intermediate vs. low tertile, HR 1.81, 95% CI 1.50–2.18; P < 0.001).
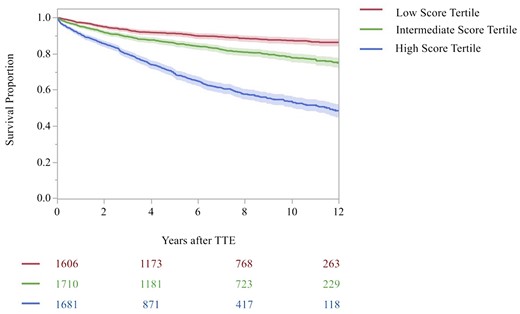
Kaplan–Meier curve for all-cause mortality by progression score tertile in the testing sample. Shown are the Kaplan–Meier curves for all-cause mortality according to time since the initial TTE in the testing dataset, stratified by TTE progression score tertile and type of valvular heart disease (i.e. MR or TR). (A) The MR progression score and (B) the TR progression score. The shaded outlines represent the 95% confidence interval for the estimates. Numbers in the risk set in each group are provided below the graph. The red curve indicates the low score tertile, green curve indicates the intermediate score tertile, and the blue indicates the high score tertile. The log-rank P-value for the comparison across tertiles was <0.001. Estimates are truncated at 12 years.
External validation
Of 231 969 individuals in the external dataset (mean age 62.6 ± 17.4), 73 559 (31.7%) for the MR model and 73 630 (31.7%) for the TR model had ≥2 TTEs and were considered for inclusion. A total of 51 023 (63.0%) and 51 424 (63.5%) individuals for MR and TR models respectively were excluded due to age ≤ 18. As the MGH has a large paediatrics hospital, these largely reflect the exclusion of paediatric TTEs. In the final MR model (N = 22 536), 3972 (17.6%) experienced progression (12.5% in the low-score tertile, 19.7% in the intermediate-score tertile, and 25.9% in the high-score tertile) and the model c-statistic was 0.61 (95% CI 0.60–0.62). In the final TR model (N = 22 206), 4236 (19.1%) experienced progression (14.1% in the low-score tertile, 28.8% in the intermediate-score tertile, and 33.5% in the high-score tertile) and the model c-statistic was 0.67 (95% CI 0.66–0.68) (Supplementary data online, Figures S7 and S8).
Discussion
In this large, multicentre study across two academic medical centres, four-fifths of patients had no progression of MR or TR. A score using only TTE parameters identified individuals with a five- to six-fold increased rate of MR or TR progression (high- vs. low-score tertile; MR, 20.1% vs. 3.3%; TR, 21.2% vs. 4.4%) and a four-fold increased risk of mortality (high vs. low tertile; MR, 35.1% vs. 11.1%; TR, 35.0% vs. 10.6%). On external validation, this score demonstrated similar performance to other algorithms commonly in use. As a whole, these results suggest that the personalization of TTE surveillance strategies is feasible and prognostically important.
Prior studies of progression
Studies of long-term MR progression have been predominantly limited to small cohorts and specific disease subsets.6–8 Amongst 63 participants with mitral valve prolapse in the Framingham Offspring cohort, progression to significant MR was noted in 17% of individuals, similar to the current findings.7 In a different cohort which prospectively enrolled 249 individuals with secondary MR in the setting of heart failure with reduced LVEF, 19% had progression, with a larger left atrial size and more TR than progressors, similar to the findings noted on the current study.8 At least one study evaluated the quantitative progression of MR in 74 patients with isolated organic MR undergoing TTE over the course of 561 ± 423 days.6 Wide individual variation in progression was noted with regression and progression of >8 mL of regurgitant volume found in 11% and 51% of individuals respectively.
Additionally, limited data exist on the progression of TR.9–11 Amongst 216 individuals with heart failure with reduced LVEF, biatrial dilation was associated progressive secondary TR.11 We confirm the large inter-individual variability in progression rates and association of rapid progression with a significant risk of mortality observed in these studies.9–11 Similar to prior literature, nearly four-fifths of individuals with serial TTEs had no evidence of progression, suggesting VHD surveillance may be too frequent in many, resulting in potentially unnecessary costs.
Predictors of progression
The rates and multivariable TTE predictors of progression were the similar for MR and TR, suggesting either common pathophysiology or significant overlap within individuals. Significant TTE predictors of both MR and TR progression included age, left atrial size, LVEF, AVV, TRG, and baseline severity of valvular regurgitation. There is sufficient physiologic rationale for the importance of several of these factors to MR and TR progression.1,15,16 As declines in LVEF17 and increasing left atrial and mitral annular dilation18 have been associated with papillary muscle tethering,19 decreased mitral valve closing force,20 and development of functional MR, it is unsurprising that these factors are also linked to MR (and resulting TR) progression. Moreover, both increased left atrial size, elevated TRG,21,22 and a decreased LVEF may be the result of significant MR17,18 and signify chronically elevated left atrial pressures. Likewise, AVV may reflect the combined haemodynamic insult of aortic regurgitation and stenosis and thus reflect the degree of afterload imposed by both of these conditions, contributing to MR. While these TTE predictors may possibly represent proxies for underlying, unmeasured clinical comorbidities, they, by association, predict the risk of progression and can be gleaned from a standard TTE without any a priori clinical knowledge. Moreover, as interval procedures, such as placement of a transvalvular pacemaker in the case of TR progression, were not evaluated, it is possible that some degree of worsening resulted from medical interventions rather than disease progression.
Use of a progression score
A 100-point score based on the aforementioned TTE predictors of progression (see Table 3 for calculation of score) identified individuals with a five- to six-fold increased rate of progression over two decades and a four-fold increased risk of mortality. This score could be incorporated into picture archiving and communication systems or electronic health records, to automatically derive an individual’s risk of progression. This score had a similar performance on external validation to other algorithms routinely used in clinical practice23,24 suggesting it could be deployed to predict progression and inform prognostication. It could be used to identify individuals at high (or conversely low) risk of VHD progression, to optimize and personalize their follow-up plan and surveillance intervals.
Societal impact of personalization of VHD surveillance
In addition to the impact of this score on risk stratifying those at high risk of VHD progression, it may be also helpful in improving appropriate utilization of TTEs. While the proportion of TTEs ordered nationally for VHD surveillance is unknown, echocardiography remains an important source of cost, representing 11% of Medicare spending on imaging services in 2010, accounting for $1.2 billion US dollars in cost, with roughly 25% of all Medicare Fee-for-Service beneficiaries receiving at least one echocardiogram.25,26 VHD surveillance may represent an important source of potentially preventable cost, and efforts to personalize decisions regarding surveillance frequency, while not sacrificing safety, are warranted.
In a study of 635 providers at a single academic institution, variability in surveillance intervals was wide and incompletely explained by patient variables.27 Surveillance intervals for MR increased with provider experience and varied by nonclinical factors with 20% of providers deemed overutilizers and 25% underutilizers of TTE.27 Such variation might be expected in the absence of clear empirical guidance on long-term progression and follow-up intervals.28 Knowledge gaps and sociodemographics may impact practice patterns for surveillance with nearly 20% of cardiologists unable to recognize left ventricular end-diastolic diameter and pulmonary hypertension as indications for MR surgery.29
Amongst those starting with 0–1+ MR or TR, progression to 3–4+ MR/TR was uncommon, occurring in 0.6–1.0% of cases respectively. Amongst those starting with 1+ MR or TR, in both low and intermediate score tertiles, less than 10% had subsequent development of 3–4+ MR or TR at 10 years, suggesting it may be feasible to space out surveillance in low and intermediate score groups to once every 10 years unless symptoms arise. This would reduce the projected number of surveillance TTEs in the low and intermediate score groups by up to two-third. Assuming a similar proportion of mild MR and TR, this change could reduce imaging costs to Medicare by an estimated 976.5 million dollars annually (in 2010 dollars). This indicates the potential magnitude of such a change on healthcare spending. As imagers are increasingly under financial pressure to justify the expense of imaging,30 VHD surveillance may represent an important target for efforts to improve the value of imaging care delivered. Based on the prognostic and societal impact of VHD progression, future guidelines should incorporate recommendations for serial TTEs in this setting.3–5
Limitations
Though large and multicentre, our study has several limitations. First, findings should be confirmed in other validation samples, particularly community sites and those with different TTE ordering practices. Second, prospective evaluation is needed to assess the potential effects on clinical outcomes of using this score in practice. Third, data were extracted from reports as it was not feasible to review all TTE images, but images were reviewed in a subset. Fourth, as all patients had two TTEs at a tertiary care centre, the rate of progression may be overestimated relative to a community setting and those having only one TTE. Fifth, no distinction was made between primary and secondary causes of MR/TR in the analysis in order to reduce score complexity and promote ease of calculation. However, it is possible that long-term progression rates may differ across primary and secondary forms of MR/TR and amongst individuals with varying anatomic substrates (e.g. atrial vs. ventricular secondary MR/TR, rheumatic disease, etc.). Sixth, quantitative estimates of MR and TR severity were not available for all TTEs, and were only evaluated in a subset. While this may diminish the granularity of MR/TR grading, agreement between initial reader and core lab evaluation on MR/TR severity was high, and the absent need for significant post-processing may promote ease of use of the progression score. Seventh, due to the retrospective nature of the study, TTE ordering patterns and follow-up were not structured, and thus it is possible for those with more significant MR/TR to have a closer follow-up with repeat echocardiography.
Conclusions
In this multicentre echocardiographic cohort study, nearly four-fifth of individuals on TTE had no progression of MR and TR. Despite marked individual variability in rates of progression, a score using only routine TTE variables identified individuals with five- to six-fold increased rate of progression and a four-fold increased risk of mortality. On external validation, this score demonstrated similar performance to other algorithms commonly in use. As a whole, these results suggest that personalization of TTE surveillance strategies is not only feasible but prognostically important.
Supplementary data
Supplementary data are available at European Heart Journal - Cardiovascular Imaging online.
Funding
The project was funded by a grant from the National, Heart, Lung, and Blood Institute (1K23HL144907 - Strom).
Data availability
The data underlying this article will be shared on reasonable request to the corresponding author.
References
Author notes
Conflict of interest: Dr Strom additionally reports grant funding from Edwards Lifesciences, Anumana, Heartsciences, and Ultromics, consulting for Bracco Diagnostics, and speaker fees from Northwest Imaging Forums, unrelated to the submitted work. Dr Yeh reports additional grant support from Abbott Vascular, Astra Zeneca, BD Bard, Boston Scientific Cook, Philips Medical and Medtronic, and consulting fees from Abbott, AstraZeneca, Boston Scientific, Edwards Life Sciences, Medtronic, Shockwave Medical and Zoll outside the submitted work. Dr Wasfy reports grant support from the American Heart Association, National Institutes of Health, consulting fees from Pfizer and Biotronik, and honoraria from the New England Comparative Effectiveness Public Affairs Council. The remaining authors have nothing to disclose.
