


Abstract
Cardiac damage in severe aortic stenosis (AS) can be classified according to a recently proposed staging classification. The present study investigated the incremental prognostic value of left ventricular (LV) global longitudinal strain (GLS) over stages of cardiac damage in patients with severe AS.
From an ongoing registry, a total of 616 severe symptomatic AS patients with available LV GLS by speckle tracking echocardiography were selected and retrospectively analysed. Patients were categorized according to cardiac damage on echocardiography: Stage 0 (no damage), Stage 1 (LV damage), Stage 2 (mitral valve or left atrial damage), Stage 3 (tricuspid valve or pulmonary artery vasculature damage), or Stage 4 (right ventricular damage). LV GLS was divided by quintiles and assigned to the different stages. The endpoint was all-cause mortality. Over a median follow-up of 44 [24–89] months, 234 (38%) patients died. LV GLS was associated with all-cause mortality independent of stage of cardiac damage. After incorporation of LV GLS by quintiles into the staging classification, Stages 2–4 were independently associated with outcome. LV GLS showed incremental prognostic value over clinical characteristics and stages of cardiac damage.
In this large single-centre cohort of severe AS patients, incorporation of LV GLS by quintiles in a novel proposed staging classification resulted in refinement of risk stratification by identifying patients with more advanced cardiac damage. LV GLS was shown to provide incremental prognostic value over the originally proposed staging classification.
Introduction
In severe aortic stenosis (AS), pressure overload caused by obstruction of the aortic valve leads to left ventricular (LV) hypertrophy and LV systolic dysfunction as a result of myocardial fibrosis formation.1 However, it has been increasingly recognized that myocardial injury caused by severe AS is not limited to the LV myocardium and can negatively influence prognosis. For example, mitral2 and tricuspid regurgitation (TR)3 are frequently observed in severe AS patients. Furthermore, multiple studies have reported a high prevalence of right ventricular (RV) dysfunction in this patient population.4–6 These expressions of cardiac damage can be classified according to a recently proposed staging classification, which has been shown to be strongly associated with prognosis, independent of other well-established predictors of poor outcome.7–10 LV global longitudinal strain (GLS) evaluated by speckle tracking echocardiography has also been demonstrated to be independently associated with all-cause mortality and adverse outcomes in severe AS patients, both with preserved and impaired LV systolic function as assessed by LV ejection fraction (LVEF).11–13 The present study investigated the incremental prognostic value of LV GLS over a recently proposed staging classification algorithm according to cardiac damage and evaluated the prognostic implications of incorporating LV GLS in this staging classification.
Methods
Study population and data collection
From an ongoing registry of patients with AS from the Leiden University Medical Center, 616 patients with symptomatic severe AS and feasible analysis of LV GLS using 2D speckle tracking echocardiography at baseline (i.e. first available echocardiogram after diagnosis of symptomatic severe AS) between 2000 and 2017 were selected. As recommended by recent guidelines, severe AS was defined as a mean aortic valve gradient ≥40 mmHg and/or aortic valve area (AVA) <1.0 cm2 [or an indexed aortic valve area (AVAi) <0.6 cm2/m2] and/or a peak aortic jet velocity ≥4 m/s.14–16 All echocardiographic data were clinically acquired and prospectively analysed by experienced observers. Exclusion criteria were previous aortic valve replacement (AVR), lack of symptoms and inadequate speckle tracking analysis due to poor acoustic windows or insufficient data. Patient demographic and clinical data (e.g. cardiovascular medication use and comorbidities) and clinical follow-up data were gathered from the departmental patient information system (EPD-Vision 11.8.4.0; Leiden University Medical Center, Leiden, The Netherlands) and hospital records (HiX; ChipSoft, Amsterdam, The Netherlands) and analysed retrospectively. The institutional review board waived the need for patient written informed consent due to the retrospective nature of this analysis (CME 10.053). The data that support the findings of this study are available on reasonable request to the corresponding author.
Transthoracic echocardiography
Using commercially available ultrasound systems (GE-Vingmed, Horten, Norway), transthoracic echocardiograms were obtained with the patient at rest in a left lateral decubitus position. Two-dimensional colour, pulsed-, and continuous-wave Doppler images were acquired as recommended and stored digitally for offline analysis (EchoPAC version 113.0.3; GE-Vingmed, Horten, Norway).17 From the parasternal long-axis view, LV dimensions were evaluated and, using the Devereux’s formula, LV mass was calculated and indexed for body surface area (LVMI).17 In the apical two- and four-chamber views, LV volumes were assessed and LVEF was calculated according to Simson’s biplane method.17 Left atrial (LA) volumes were measured by the biplane method of disks and indexed for body surface area.17 For the evaluation of LV diastolic function, peak early (E) and late (A) diastolic velocities were acquired using pulsed-wave Doppler recordings of the transmitral flow.18 To estimate LV filling pressures, the E/e′ ratio was calculated incorporating the average e′ as measured at both the lateral and septal mitral annulus by tissue Doppler imaging on the apical four-chamber view.18 From colour and continuous-wave Doppler recordings, the severity of mitral and TR was graded using a multi-parametric approach, as recommended by current guidelines.19 For the estimation of the systolic arterial pulmonary pressure (SPAP), the right atrial pressure as determined by the diameter and inspiratory collapse of the inferior vena cava was added to the RV pressure as calculated by the Bernouilli equation using the peak velocity of the tricuspid regurgitant jet.17,20 On the focused apical four-chamber view of the right ventricle, the tricuspid annular plane systolic excursion (TAPSE) was measured using anatomical M-mode to evaluate the RV systolic function.20 To assess AS severity, peak aortic jet velocity was estimated using the continuous-wave Doppler data from the apical three- or five-chamber views.15 Mean and peak transvalvular pressure gradients were calculated according to the Bernoulli equation.15 Using the LV outflow tract diameter and velocity time integrals of the aortic valve and LV outflow tract, the AVA was estimated by the continuity equation and AVAi.15
Using commercially available software (EchoPAC version 113.0.3; GE-Vingmed, Horten, Norway), LV GLS was measured on the apical four-, three-, and two-chamber views by two-dimensional speckle tracking analysis.17 Conventionally, LV GLS is presented as a negative value (since it represents the myocardial shortening in the longitudinal direction), but in the present study absolute values are reported.17
Staging classification and reclassification by LV GLS
Patients were classified into five independent stages as proposed by Généreux et al.7 based on the presence and extent of cardiac damage as evaluated on baseline transthoracic echocardiography (Figure 1): no signs of cardiac damage was categorized as Stage 0; LV damage [LV hypertrophy (LVMI >95 g/m2 for women or >115 g/m2 for men), LV systolic (LVEF <50%), or diastolic dysfunction (E/e′ >14)]17,18 as Stage 1; LA or mitral valve damage (LA volume index >34 mL/m2, significant mitral regurgitation (MR; MR grade ≥3) or presence of atrial fibrillation at time of baseline echocardiography)17,19 as Stage 2; pulmonary artery vasculature or tricuspid valve damage [severe pulmonary hypertension (SPAP >60 mmHg) or significant TR (TR grade ≥3)]19 as Stage 3 and RV damage [RV dysfunction (TAPSE <16 mm)]20 as Stage 4. Patients were classified in the most advanced stage if criteria for more than one stage were present.7
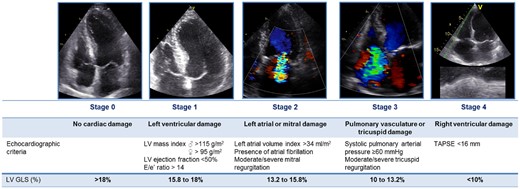
Proposed staging classification according to the presence and extent of cardiac damage on echocardiography with addition of LV GLS quintiles for reclassification. GLS, global longitudinal strain; LV, left ventricular; TAPSE, tricuspid annular plane systolic excursion.
To incorporate LV GLS in the proposed staging classification, LV GLS was divided by quintiles and assigned to the different stages of cardiac damage as depicted in Figure 1: LV GLS >18% for Stage 0, 15.8–18% for Stage 1, 13.2–15.8% for Stage 2, 10–13.2% for Stage 3 and <10% for Stage 4. Classification of stages after taking into account LV GLS was performed using the previously described approach7: patients were classified into the most advanced stage for which either a criterion for cardiac damage or for LV GLS was present (Figure 1).
Follow-up and endpoint
All patients were followed up for all-cause mortality and the occurrence of AVR (either surgical or transcatheter). The primary outcome was all-cause mortality, which was obtained by review of the departmental cardiology information system (which is linked to the governmental death registry database).
Statistical analysis
Continuous data are presented as mean ± standard deviation or median [interquartile range (IQR)], as appropriate, and were compared between patients groups as divided by stage of cardiac damage using the analysis of variance (ANOVA) test with Bonferroni’s post hoc analysis or Kruskal–Wallis test when distributed normally or non-normally, respectively. Categorical data are presented as frequencies and percentages and were compared between groups using the χ2 test. To calculate cumulative survival rates of the stages of cardiac damage, Kaplan–Meier analyses were performed. For comparison of survival rates between the different stages, the log-rank test was used. Univariable Cox proportional hazard analyses were performed to assess the association of the proposed staging classification and other relevant parameters with all-cause mortality. Statistically significant (P < 0.05) or clinically relevant predictors from the univariable analysis were included in the multi-variable model. Cox proportional hazard analyses were performed for both the proposed staging classification and after reclassification taking into account LV GLS. AVR (surgical or transcatheter) was entered into the analyses as a time-dependent covariate. Hazard ratio (HR) and 95% confidence interval (CI) were presented for all included variables. To assess the incremental prognostic value of LV GLS over the proposed staging classification, nested regression models were constructed and changes in χ2 value were calculated. All statistical analyses were performed on SPSS software (version 23, IBM SPSS statistics for Windows, Armonk, NY, USA) and a two-sided P-value <0.05 was considered statistically significant.
Results
A total of 616 symptomatic severe AS patients (mean age 75 ± 11 years, 58% male) were classified according to the proposed staging classification (Figure 1): 55 (9%) patients had no signs of cardiac damage (Stage 0), 164 (27%) patients had LV damage (Stage 1), 281 (45%) patients had LA or mitral valve damage (Stage 2), 35 (6%) patients had pulmonary vasculature or tricuspid valve damage (Stage 3), and 81 (13%) patients had RV damage (Stage 4) (Figure 2). Patients in Stages 3 and 4 were generally older, had more comorbidities (e.g. coronary artery disease, chronic obstructive pulmonary disease and atrial fibrillation), had more severe symptoms (NYHA functional class ≥3), had worse renal function and more often used diuretics when compared with patients in Stages 0–2 (Table 1). Echocardiographically, patients in more advanced stages had larger diameters of both the LV and LA, had worse LVEF, more often had significant MR and TR and more often had low-flow low-gradient AS when compared with patients in less advanced stages (Table 2). Of note, LV GLS was gradually more impaired with each increasing stage.
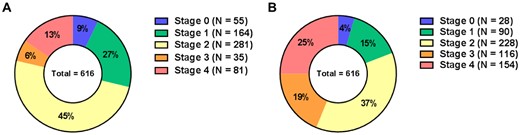
Distribution of stages of cardiac damage in study population according to the proposed staging classification (A) and after reclassification by incorporating LV GLS (B). GLS, global longitudinal strain; LV, left ventricular.
Clinical characteristics of total study population and per stage of cardiac damage classified according to proposed staging classification
| Total population (n = 616) | Stage 0 (n = 55) | Stage 1 (n = 164) | Stage 2 (n = 281) | Stage 3 (n = 35) | Stage 4 (n = 81) | P-value* | |
|---|---|---|---|---|---|---|---|
| Age (years) | 75.4 ± 10.7 | 72.6 ± 10.3 | 72.1 ± 12.1 | 76.3 ± 10.2‡ | 79.6 ± 8.3†‡ | 78.5 ± 7.8†‡ | <0.001 |
| Male gender, n (%) | 359 (58) | 36 (66) | 87 (53) | 166 (59) | 13 (37) | 57 (70) | 0.006 |
| Body mass index (kg/m2) | 26.3 ± 4.4 | 26.8 ± 4.6 | 26.2 ± 4.0 | 26.6 ± 4.7 | 25.3 ± 3.7 | 25.6 ± 4.5 | 0.244 |
| Body surface area (m2) | 1.87 ± 0.21 | 1.88 ± 0.21 | 1.86 ± 0.20 | 1.88 ± .21 | 1.80 ± 0.21 | 1.87 ± 0.20 | 0.186 |
| Hypertension, n (%) | 414 (67) | 34 (62) | 114 (70) | 190 (67) | 25 (71) | 51 (63) | 0.720 |
| Hypercholesterolaemia, n (%) | 348 (57) | 32 (58) | 87 (53) | 163 (58) | 16 (46) | 50 (62) | 0.452 |
| Diabetes mellitus, n (%) | 150 (24) | 12 (22) | 35 (21) | 70 (25) | 6 (17) | 27 (33) | 0.233 |
| Coronary artery disease, n (%) | 311 (51) | 22 (40) | 75 (46) | 143 (51) | 15 (43) | 56 (69) | 0.003 |
| Previous myocardial infarction, n (%) | 126 (21) | 9 (16) | 26 (16) | 57 (20) | 9 (26) | 25 (31) | 0.069 |
| History of smoking, n (%) | 214 (35) | 26 (47) | 54 (33) | 100 (36) | 9 (26) | 25 (31) | 0.204 |
| COPD, n (%) | 101 (16) | 8 (15) | 7 (17) | 36 (13) | 12 (34) | 18 (22) | 0.012 |
| History of atrial fibrillation, n (%) | 169 (27) | 5 (9) | 16 (10) | 83 (30) | 17 (49) | 48 (59) | <0.001 |
| NYHA functional class ≥3, n (%) | 254 (42) | 21 (38) | 40 (25) | 117 (43) | 24 (69) | 52 (64) | <0.001 |
| Symptoms, n (%) | |||||||
| Angina | 260 (42) | 24 (44) | 79 (49) | 120 (43) | 11 (31) | 26 (32) | 0.100 |
| Dyspnoea | 478 (78) | 40 (73) | 111 (68) | 220 (79) | 33 (94) | 74 (91) | <0.001 |
| Syncope | 67 (11) | 5 (9) | 25 (15) | 33 (12) | 0 (0) | 4 (5) | 0.027 |
| Estimated glomerular filtration rate (mL/min/1.73m2) | 62.2 ± 20.6 | 66.1 ± 21.5 | 64.7 ± 21.8 | 63.5 ± 19.8 | 50.5 ± 19.9†‡§ | 55.4 ± 17.7†‡§ | <0.001 |
| eGFR <60 mL/min/1.73 m2, n (%): | 287 (47) | 22 (40) | 72 (44) | 121 (43) | 23 (66) | 49 (61) | 0.006 |
| Systolic blood pressure (mmHg) | 138.0 ± 23.5 | 142.0 ± 21.9 | 140.5 ± 21.1 | 139.6 ± 24.3 | 127.2 ± 27.6†‡§ | 129.2 ± 22.0†‡§ | <0.001 |
| Diastolic blood pressure (mmHg) | 73.8 ± 13.4 | 76.6 ± 13.6 | 76.0 ± 12.4 | 72.8 ± 13.1 | 69.2 ± 16.1 | 72.7 ± 14.0 | 0.011 |
| Medication, n (%) | |||||||
| Beta-blocker | 328 (53) | 24 (44) | 83 (51) | 151 (54) | 18 (51) | 52 (64) | 0.166 |
| ACE inhibitor/ARB | 306 (50) | 25 (46) | 76 (46) | 143 (51) | 18 (51) | 44 (54) | 0.730 |
| Aspirin/thienopyridines | 280 (46) | 26 (47) | 84 (51) | 122 (43) | 13 (37) | 35 (43) | 0.422 |
| Oral anticoagulant | 173 (28) | 10 (18) | 20 (12) | 82 (29) | 16 (46) | 45 (56) | <0.001 |
| Statin | 355 (58) | 33 (60) | 93 (57) | 164 (58) | 17 (49) | 48 (59) | 0.825 |
| Calcium channel blocker | 145 (24) | 10 (18) | 39 (24) | 72 (26) | 7 (20) | 17 (21) | 0.718 |
| Diuretics | 311 (51) | 14 (26) | 65 (40) | 153 (54) | 29 (83) | 50 (62) | <0.001 |
Continuous variables are presented as mean ± SD or median [interquartile range]. Categorical variables are expressed as n (%). The boldface values indicate statistical significance.
ACE, angiotensin-converting enzyme; ARB, angiotensin II receptor blocker; COPD, chronic obstructive pulmonary disease; NYHA, New York Heart Association.
P-values depict differences between stages of cardiac damage and are calculated by ANOVA and Kruskal–Wallis H test for continuous data (with normal and non-normal distribution, respectively), and by χ2 test for categorical data.
P-value <0.05 vs. Stage 0 with Bonferroni’s post hoc analysis.
P-value <0.05 vs. Stage 1 with Bonferroni’s post hoc analysis.
P-value <0.05 vs. Stage 2 with Bonferroni’s post hoc analysis.
Echocardiographic characteristics of total study population and per stage of cardiac damage classified according to proposed staging classification
| Total population (n = 616) | Stage 0 (n = 55) | Stage 1 (n = 164) | Stage 2 (n = 281) | Stage 3 (n = 35) | Stage 4 (n = 81) | P-value* | |
|---|---|---|---|---|---|---|---|
| Heart rate at moment of TTE (bpm) | 75.0 ± 14.4 | 74.3 ± 12.1 | 72.0 ± 12.5 | 73.6 ± 13.6 | 84.2 ± 16.2†‡§ | 82.0 ± 17.6†‡§ | <0.001 |
| Valve morphology, n (%) | <0.001 | ||||||
| Tricuspid | 555 (90) | 47 (86) | 135 (82) | 261 (93) | 34 (97) | 78 (96) | |
| Bicuspid | 61 (10) | 8 (15) | 29 (18) | 20 (7) | 1 (3) | 3 (4) | |
| Atrial fibrillation at moment of TTE, n (%) | 72 (12) | 0 (0) | 0 (0) | 34 (12) | 10 (29) | 28 (35) | <0.001 |
| LV end-diastolic diameter (mm) | 48.9 ± 8.3 | 42.4 ± 5.0 | 48.2 ± 7.5† | 49.3 ± 8.3† | 50.8 ± 9.3† | 52.0 ± 8.8†‡ | <0.001 |
| LV end-systolic diameter (mm) | 35.6 ± 9.9 | 29.6 ± 5.1 | 34.2 ± 8.7† | 35.3 ± 9.7† | 39.3 ± 11.7†‡ | 41.8 ± 11.0†‡§ | <0.001 |
| Septal wall thickness (mm) | 12.9 ± 2.3 | 11.3 ± 1.6 | 12.5 ± 1.9† | 13.4 ± 2.4†‡ | 12.7 ± 2.4† | 12.8 ± 2.6† | <0.001 |
| Posterior wall thickness (mm) | 12.1 ± 2.0 | 10.9 ± 1.4 | 11.8 ± 1.9 | 12.6 ± 2.1†‡ | 11.9 ± 1.9 | 11.8 ± 2.2§ | <0.001 |
| LV mass index (g/m2) | 129.4 ± 37.1 | 85.7 ± 14.2 | 122.4 ± 32.0† | 138.0 ± 37.6†‡ | 138.3 ± 32.9† | 138.6 ± 34.5†‡ | <0.001 |
| LV end-diastolic volume (mL) | 98 [76-130] | 78 [60-95] | 90 [74-114] | 101 [80-133] | 113 [71-139] | 128 [92-161] | <0.001 |
| LV end-systolic volume (mL) | 45 [31-76] | 31 [21-41] | 38 [27-55] | 47 [33-74] | 58 [36-97] | 83 [45-118] | <0.001 |
| LV ejection fraction (%) | 52.9 ± 14.0 | 61.9 ± 7.3 | 57.2 ± 12.0 | 53.1 ± 12.9†‡ | 45.3 ± 14.4†‡§ | 40.6 ± 15.1†‡§ | <0.001 |
| LV ejection fraction <50%, n (%) | 203 (33) | 0 (0) | 33 (20) | 90 (32) | 21 (60) | 59 (73) | <0.001 |
| LV global longitudinal strain (%) | 14.0 ± 4.5 | 17.3 ± 3.6 | 15.2 ± 3.7† | 14.2 ± 4.2† | 11.3 ± 5.1†‡§ | 9.5 ± 3.6†‡§ | <0.001 |
| Peak E-wave velocity (cm/s) | 83.0 ± 30.0 | 65.2 ± 18.5 | 72.4 ± 22.8 | 85.8 ± 30.7†‡ | 104.4 ± 26.1†‡§ | 98.1 ± 34.3†‡§ | <0.001 |
| E′ (cm/s) | 5.1 ± 2.1 | 6.0 ± 1.5 | 4.4 ± 1.5† | 5.2 ± 2.3‡ | 5.6 ± 2.1‡ | 5.3 ± 2.4‡ | <0.001 |
| E/e′ ratio | 16 [12-22] | 11 [10-12] | 17 [13-21] | 17 [12-22] | 20 [15-38] | 20 [13-28] | <0.001 |
| Left atrial volume index (mL/m2) | 41.0 ± 17.5 | 23.9 ± 5.8 | 25.1 ± 6.8 | 48.8 ± 14.4†‡ | 51.3 ± 18.2†‡ | 52.3 ± 16.7†‡ | <0.001 |
| Significant mitral regurgitation, n (%) | 56 (9) | 0 (0) | 0 (0) | 30 (11) | 11 (31) | 15 (19) | <0.001 |
| Systolic pulmonary arterial pressure (mmHg) | 33.0 ± 12.4 | 24.9 ± 8.4 | 28.7 ± 7.5 | 31.9 ± 9.5†‡ | 56.5 ± 11.7†‡§ | 38.2 ± 14.8†‡§‖ | <0.001 |
| Significant tricuspid regurgitation, n (%) | 43 (7) | 0 (0) | 0 (0) | 0 (0) | 24 (69) | 19 (24) | <0.001 |
| Tricuspid annular plane systolic excursion (mm) | 20.2 ± 3.9 | 21.9 ± 2.5 | 21.5 ± 3.0 | 21.3 ± 3.0 | 19.0 ± 3.0†‡§ | 13.5 ± 1.5†‡§‖ | <0.001 |
| Mean aortic valve gradient (mmHg) | 42.3 ± 16.6 | 41.0 ± 13.8 | 43.4 ± 15.3 | 45.0 ± 17.7 | 37.7 ± 14.9 | 33.3 ± 14.4‡§ | <0.001 |
| Peak aortic jet velocity (m/s) | 4.0 ± 0.7 | 4.0 ± 0.6 | 4.1 ± 0.7 | 4.1 ± 0.8 | 3.8 ± 0.7 | 3.5 ± 0.7†‡§ | <0.001 |
| Aortic valve area (cm2) | 0.77 ± 0.19 | 0.85 ± 0.22 | 0.78 ± 0.17 | 0.76 ± 0.19† | 0.76 ± 0.23 | 0.71 ± 0.18† | 0.001 |
| Indexed aortic valve area (cm2/m2) | 0.41 ± 0.10 | 0.46 ± 0.11 | 0.42 ± 0.09 | 0.41 ± 0.10† | 0.42 ± 0.11 | 0.38 ± 0.10†‡ | <0.001 |
| Low-flow low-gradient AS, n (%) | 162 (26) | 12 (22) | 30 (18) | 61 (22) | 13 (37) | 46 (57) | <0.001 |
Continuous variables are presented as mean ± SD. Categorical variables are expressed as number (percentage).
AS, aortic stenosis; bpm, beats per minute; TTE, transthoracic echocardiogram.
P-values depict differences between stages of cardiac damage and are calculated by ANOVA and Kruskal–Wallis H test for continuous data (with normal and non-normal distribution, respectively), and by chi-square test for categorical data.
P-value <0.05 vs. Stage 0 with Bonferroni’s post hoc analysis.
P-value <0.05 vs. Stage 1 with Bonferroni’s post hoc analysis.
P-value <0.05 vs. Stage 2 with Bonferroni’s post hoc analysis.
P-value <0.05 vs. Stage 3 with Bonferroni’s post hoc analysis.
Prognostic value of staging classification
Over a median follow-up of 44 (24–89) months, 550 (89%) patients underwent AVR (49% surgical and 51% transcatheter), and 234 (38%) patients died. Of the 234 patients who died, 57 (24%) did not receive AVR. As shown in Figure 3, the Kaplan–Meier analysis demonstrated a significantly lower survival from all-cause mortality with increasing stages of cardiac damage, especially Stages 3 and 4 (log-rank χ2 65.2, P < 0.001). Using Cox proportional hazard analyses (Table 3), stage of cardiac damage as classified by the proposed staging classification was independently associated with all-cause mortality (HR 1.25, 95% CI 1.09–1.45; P = 0.002). This effect seemed to be determined mainly by Stage 4 (HR 2.33, 95% CI 1.19–4.54; P = 0.013), as other stages of cardiac damage did not show a significant independent effect on prognosis (P > 0.05). Importantly, LV GLS was associated with all-cause mortality, independent of stage of cardiac damage (HR 0.95, 95% CI 0.92–0.98; P = 0.004).
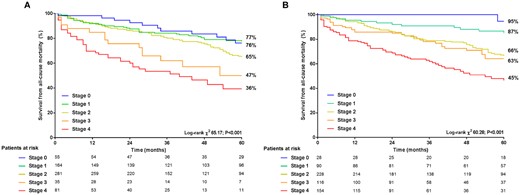
Kaplan–Meier survival curves for all-cause mortality per stage of cardiac damage according to the proposed staging classification (A) and after reclassification by incorporating LV GLS (B). GLS, global longitudinal strain; LV, left ventricular.
Univariable and multi-variable Cox proportional hazard analyses for all-cause mortality including proposed stages of cardiac damage
| Univariate analysis | Multi-variate analysis | |||
|---|---|---|---|---|
| Hazard ratio (95% CI) | P-Value | Hazard ratio (95% CI) | P-value | |
| Age (per 1 year increase) | 1.034 (1.020–1.048) | <0.001 | 1.023 (1.008–1.038) | 0.003 |
| Male gender (yes/no) | 1.099 (0.845–1.429) | 0.480 | 1.119 (0.846–1.480) | 0.432 |
| Coronary artery disease (yes/no) | 1.566 (1.207–2.031) | 0.001 | 1.035 (0.751–1.425) | 0.835 |
| Previous myocardial infarction (yes/no) | 2.021 (1.521–2.685) | <0.001 | 1.490 (1.051–2.114) | 0.025 |
| Chronic obstructive pulmonary disease (yes/no) | 1.191 (0.830–1.708) | 0.343 | ||
| History of atrial fibrillation (yes/no) | 1.455 (1.094–1.935) | 0.010 | 0.948 (0.692–1.298) | 0.737 |
| Diabetes mellitus (yes/no) | 1.598 (1.206–2.118) | 0.001 | 1.552 (1.159–2.080) | 0.003 |
| NYHA functional class ≥ 3 (yes/no) | 1.455 (1.116–1.895) | 0.006 | 1.165 (0.875–1.551) | 0.297 |
| eGFR <60 (mL/min/1.73 m2 increase) | 2.422 (1.859–3.154) | <0.001 | 1.736 (1.312–2.295) | <0.001 |
| Systolic blood pressure (per 1 mmHg increase) | 0.998 (0.992–1.003) | 0.430 | ||
| Diuretics (yes/no) | 1.496 (1.155–1.938) | 0.002 | 1.043 (0.787–1.381) | 0.770 |
| Peak aortic jet velocity (per 1 m/s increase) | 0.645 (0.537–0.774) | <0.001 | 0.943 (0.761–1.169) | 0.592 |
| Indexed AVA (per 0.01 cm2/m2 increase) | 1.430 (0.386–5.291) | 0.592 | 4.052 (0.910–18.05) | 0.066 |
| Surgical or transcatheter AVR (yes/no) | 0.370 (0.269–0.509) | <0.001 | 0.384 (0.276–0.535) | <0.001 |
| LV global longitudinal strain (per 1% increase) | 0.911 (0.886–0.936) | <0.001 | 0.951 (0.919–0.983) | 0.004 |
| Stage of cardiac damage (per 1 stage increase) | 1.541 (1.370–1.734) | <0.001 | 1.253 (1.087–1.445) | 0.002 |
| Stages according to cardiac damage | ||||
| Stage 0 (no cardiac damage) | Reference | Reference | ||
| Stage 1 (LV damage) | 1.108 (0.623–1.968) | 0.727 | 1.138 (0.629–2.057) | 0.669 |
| Stage 2 (left atrial or mitral damage) | 1.614 (0.938–2.776) | 0.084 | 1.293 (0.730–2.290) | 0.378 |
| Stage 3 (pulmonary vasculature or tricuspid damage) | 2.782 (1.387–5.578) | 0.004 | 1.704 (0.786–3.696) | 0.177 |
| Stage 4 (right ventricular damage) | 4.429 (2.471–7.938) | <0.001 | 2.327 (1.192–4.541) | 0.013 |
AVA, aortic valve area; AVR, aortic valve replacement; CI, confidence interval; HR, hazard ratio; eGFR, estimated glomerular filtration rate; LV, left ventricular; NYHA, New York Heart Association.
Incorporation of LV GLS in staging classification and prognostic implications
To incorporate LV GLS in the proposed staging classification, LV GLS was divided by quintiles (i.e. >18%, 15.8–18%, 13.2–15.8%, 10–13.2% and <10%) and assigned to the stages of cardiac damage as shown in Figure 1. Using the same approach as with the proposed staging classification, patients were reclassified by taking into account LV GLS: 28 (4%) patients were categorized as Stage 0, 90 (15%) patients as Stage 1, 228 (37%) patients as Stage 2, 116 (19%) patients as Stage 3, and 154 (25%) patients as Stage 4 (Figure 2). Baseline and echocardiographic characteristics per reclassified stage of cardiac damage after incorporation of LV GLS are summarized in Supplementary data online, Tables S1 and S2, respectively.
Kaplan–Meier survival curves for all-cause mortality per stage of cardiac damage reclassified after incorporating LV GLS are depicted in Figure 3. Cumulative 5-year survival rates decreased with increasing stages of cardiac damage (log-rank χ2 60.3, P < 0.001). Compared with the proposed staging classification, use of the staging classification incorporating LV GLS (Figure 3B) resulted in better discrimination of cumulative survival in Stage ≥2 vs. Stage 0 and 1 (P < 0.01 for all and P < 0.02 for all, respectively). Kaplan–Meier analysis including the patients under medical therapy (i.e. censored at the moment of AVR) showed decreasing survival rates with increasing stages of cardiac damage (log-rank χ2 11.50, P = 0.022; Supplementary data online, Figure S1).
Table 4 summarizes the Cox proportional hazard analyses for all-cause mortality, assessing the prognostic value of the staging classification after incorporation of LV GLS. On multi-variable analysis, the stage of cardiac damage was independently associated with all-cause mortality (HR 1.41, 95% CI 1.22–1.62; P < 0.001). Importantly, Stages 2–4 were all independent predictors of outcome: with each increasing stage, a gradually increasing risk for all-cause mortality was observed [Stage 2: HR 4.35 (95% CI 1.35–14.10; P = 0.014), Stage 3: HR 4.82 (95% CI 1.45–16.00; P = 0.010), and Stage 4: HR 8.08 (95% CI 2.45–26.67; P < 0.001)].
Univariable and multi-variable Cox proportional hazard analyses for all-cause mortality including stages of cardiac damage after reclassification by incorporating LV GLS
| Univariate analysis | Multi-variate analysis | |||
|---|---|---|---|---|
| Hazard ratio (95% CI) | P-value | Hazard ratio (95% CI) | P–value | |
| Age (per 1-year increase) | 1.034 (1.020–1.048) | <0.001 | 1.023 (1.009–1.038) | 0.002 |
| Male gender (yes/no) | 1.099 (0.845–1.429) | 0.480 | 1.111 (0.841–1.468) | 0.459 |
| Coronary artery disease (yes/no) | 1.566 (1.207–2.031) | 0.001 | 1.017 (0.740–1.399) | 0.916 |
| Previous myocardial infarction (yes/no) | 2.021 (1.521–2.685) | <0.001 | 1.462 (1.031–2.073) | 0.033 |
| Chronic obstructive pulmonary disease (yes/no) | 1.191 (0.830–1.708) | 0.343 | ||
| History of atrial fibrillation (yes/no) | 1.455 (1.094–1.935) | 0.010 | 1.039 (0.767–1.407) | 0.806 |
| Diabetes mellitus (yes/no) | 1.598 (1.206–2.118) | 0.001 | 1.586 (1.182–2.127) | 0.002 |
| NYHA functional class ≥ 3 (yes/no) | 1.455 (1.116–1.895) | 0.006 | 1.182 (0.890–1.568) | 0.248 |
| eGFR <60 (mL/min/1.73 m2 increase) | 2.422 (1.859–3.154) | <0.001 | 1.746 (1.320–2.309) | <0.001 |
| Systolic blood pressure (per 1 mmHg increase) | 0.998 (0.992–1.003) | 0.430 | ||
| Diuretics (yes/no) | 1.496 (1.155–1.938) | 0.002 | 0.994 (0.748–1.320) | 0.966 |
| Peak aortic jet velocity (per 1 m/s increase) | 0.645 (0.537–0.774) | <0.001 | 0.924 (0.747–1.144) | 0.468 |
| Indexed AVA (per 0.01 cm2/m2 increase) | 1.430 (0.386–5.291) | 0.592 | 4.115 (0.914–18.52) | 0.065 |
| Surgical or transcatheter AVR (yes/no) | 0.370 (0.269–0.509) | <0.001 | 0.393 (0.282–0.546) | <0.001 |
| Stage of cardiac damage (per 1 stage increase) | 1.556 (1.380–1.754) | <0.001 | 1.406 (1.221–1.619) | <0.001 |
| Stages according to cardiac damage | ||||
| Stage 0 (no cardiac damage) | Reference | Reference | ||
| Stage 1 (LV damage) | 2.259 (0.678–7.526) | 0.184 | 3.199 (0.945–10.84) | 0.062 |
| Stage 2 (left atrial or mitral damage) | 3.928 (1.242–12.43) | 0.020 | 4.354 (1.345–14.10) | 0.014 |
| Stage 3 (pulmonary vasculature or tricuspid damage) | 4.641 (1.438–14.98) | 0.010 | 4.824 (1.454–16.00) | 0.010 |
| Stage 4 (right ventricular damage) | 8.917 (2.814–28.26) | <0.001 | 8.082 (2.450–26.67) | 0.001 |
AVA, aortic valve area; AVR, aortic valve replacement; CI, confidence interval; HR, hazard ratio; eGFR, estimated glomerular filtration rate; GLS, global longitudinal strain; LV, left ventricular; NYHA, New York Heart Association.
Incremental prognostic value of LV GLS over proposed staging classification
To assess the incremental prognostic value of LV GLS in addition to clinical parameters and the proposed staging classification, a likelihood ratio test was performed. As illustrated by Figure 4, the addition of stage of cardiac damage to a baseline model (Model 1) consisting of clinical characteristics associated with all-cause mortality in the univariable Cox regression analysis (Table 3) resulted in a significant increase in χ2 (from 135 to 162; P < 0.001). Adding LV GLS to the model including clinical parameters and stage of cardiac damage (Model 2) further improved the χ2 value (P = 0.003), thereby demonstrating the incremental prognostic value of LV GLS over stages of cardiac damage as classified by the proposed staging classification. For the subgroup of 162 patients with low-flow low-gradient severe AS, LV GLS showed incremental prognostic value over stages of cardiac damage (Supplementary data online, Table S3 and Supplementary data online, Figure S2).
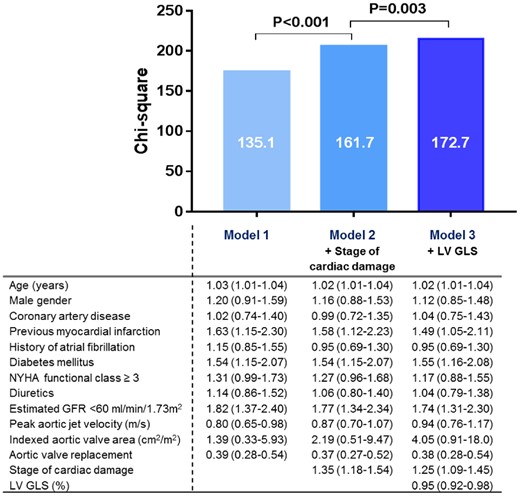
Incremental value of LV GLS on top of the proposed staging classification of cardiac damage. The bar graphs depict the incremental prognostic value of LV GLS (Model 3) over the stages of cardiac damage and clinical parameters (Model 2) for all-cause mortality, as illustrated by a significant increase in χ2 values on the y-axis. Data are presented as hazard ratios with corresponding 95% confidence intervals. GFR, glomerular filtration rate; GLS, global longitudinal strain; LV, left ventricular; NYHA, New York Heart Association.
Discussion
The present study demonstrated that, in a large single-centre cohort of symptomatic severe AS patients, the extent of cardiac damage as classified by a recently proposed staging classification was independently associated with all-cause mortality. However, this seemed to be mainly determined by RV damage (i.e. Stage 4). After incorporation of LV GLS divided by quintiles into the proposed staging classification for reclassification, Stages 2–4 were all independently associated with all-cause mortality. This suggests that incorporation of LV GLS improves the prognostic value of the staging classification by identifying patients with more advanced cardiac damage. LV GLS was demonstrated to have incremental prognostic value over clinical characteristics and over the originally proposed staging classification according to the extent of cardiac damage.
Cardiac damage and LV GLS in severe AS
Severe AS is currently regarded as a disease not limited to the aortic valve but also affecting the LV myocardium. Pressure overload caused by the stenotic aortic valve will ultimately lead to formation of myocardial fibrosis, resulting in LV systolic and diastolic dysfunction.1,21 However, hemodynamic consequences of severe AS often reach beyond the LV myocardium, as characterized by a high prevalence of concomitant mitral2 and TR3 and RV dysfunction4–6 which negatively affect prognosis even after AVR. Généreux et al.7 were the first to demonstrate the prognostic implications of classification of stages of symptomatic severe AS and their findings have recently been confirmed in more heterogenous populations of symptomatic8 and asymptomatic9 AS patients as well as in patients undergoing transcatheter AVR.10
As a potential surrogate marker of myocardial fibrosis, LV myocardial longitudinal function as assessed by LV GLS using speckle tracking echocardiography has been shown to be an independent predictor of mortality and adverse outcomes in both symptomatic and asymptomatic severe AS patients.11,12,22–24 Ng et al.11 determined that severe AS patients with an LVEF ≥55% but impaired LV GLS (i.e. LV GLS >−14%) had a risk for all-cause mortality comparable to patients with impaired LVEF. This was corroborated by a recent meta-analysis showing a significant relationship between impaired LV GLS (i.e. absolute LV GLS <14.7%) and mortality in asymptomatic AS patients with LVEF ≥60%.25 Interestingly, Cavalcante et al.5 demonstrated that LV GLS was associated with all-cause mortality independent of the presence of significant TR and RV dysfunction in 65 low-flow low-gradient severe AS patients. The present study confirms and extends these findings by demonstrating that LV GLS is associated with all-cause mortality independently of stage of cardiac damage and has incremental prognostic value over clinical parameters and the originally proposed staging classification.
Risk stratification in severe AS
According to current guideline recommendations, a Class I indication for AVR is present in patients with severe AS with symptoms or evidence of LV systolic dysfunction defined by a LVEF <50%.14,16 The decision to intervene and the choice of type of intervention (i.e. surgical vs. transcatheter AVR) is made by the heart team based on an individual risk-benefit analysis and therefore, accurate risk assessment is paramount.14 For preoperative risk stratification, the Society of Thoracic Surgeons Predicted Risk of Mortality (STS-PROM)26 and the logistic European System for Cardiac Operative Risk Evaluation (EuroSCORE)27 models are recommended and most frequently utilized.14,16 However, these algorithms derive from surgical populations and do not account for improvements in both surgical and transcatheter procedures.28 Particularly in the field of transcatheter AVR, subsequent efforts have been made to develop transcatheter AVR-specific risk scores which include clinically relevant parameters of patient comorbidity29 and frailty,30 but these are not routinely used.
Importantly, cardiac damage as assessed by conventional echocardiography remained a strong predictor for mortality after correcting for STS-PROM, comorbidities such as oxygen-dependent COPD and frailty.7,10 The presence of cardiac damage is underrepresented in current risk models: only atrial fibrillation, LV dysfunction and significant MR and TR are included in the STS-PROM and LV dysfunction and pulmonary hypertension in the logistic EuroSCORE, respectively. Importantly, both the present study and two recent studies did not find a relevant impact of the lower stages of cardiac damage (i.e. LV dysfunction and LA damage or significant MR) on prognosis.8,10 The presence of significant TR or pulmonary hypertension and RV dysfunction, however, was strongly associated with all-cause mortality, suggesting that incorporation of these parameters in current risk models may aid in future pre-procedural risk assessment.8,10
More advanced echocardiographic parameters such as LV GLS are not routinely assessed in clinical practice and are currently not included in risk stratification models. To modify the proposed staging scheme of cardiac injury, Tastet et al.9 added impaired LV GLS (i.e. absolute value ≤15%) as a criterion for LV damage (Stage 1) and consequently reclassified patients from Stage 0 (i.e. no cardiac damage) to Stage 1. Although the authors concluded that the modified staging scheme resulted in better discrimination of mortality curves, the effect of the addition of LV GLS specifically was unclear, as LV GLS was only available in one-third of the study population (250/735 patients). The present study extends these findings by demonstrating in a much larger population that LV GLS has incremental prognostic value over cardiac damage assessed by more conventional means. Incorporation of LV GLS by quintiles in the proposed staging classification reclassifies patients in lower stages to more advanced stages of cardiac damage. This results in better discrimination of prognostic impact of the separate stages, especially of LA or mitral valve damage (Stage 2), when compared with the original staging classification. These findings confirm the relevance of using both conventional and advanced echocardiographic parameters for the assessment of cardiac injury in clinical practice, which may aid in future risk stratification. Future prospective studies are needed for validation of this extended staging classification before implementation in clinical practice is feasible.
Study limitations
The current study is limited by its retrospective design and was performed in a single referral centre. This may have introduced selection and referral bias as patients underwent AVR based on the decision of the heart team as recommended by current guidelines.14 Frailty index could not be taken into account in the analyses, as the components comprising frailty index (e.g. gait speed, weight loss, and cognitive assessment) were not routinely assessed and reported in hospital records. In the current study, the study population consisted of symptomatic severe AS patients and findings cannot be extrapolated to asymptomatic AS patients. Future research on the staging of cardiac damage using incorporation of LV GLS in this population could provide insight in the role of this extended staging classification in therapeutic decision making by identifying patients [in particular with preserved (>50%) or supranormal (≥60%) LVEF and impaired LV GLS] who might benefit from early intervention. Coronary artery disease and previous myocardial infarction were not regarded as exclusion criteria, which may have influenced LV GLS measurements. However, an earlier study on LV GLS in AS found no significant difference in LV GLS between patients with and without obstructive coronary artery disease that required coronary artery bypass grafting.12 Other comorbidities such as chronic obstructive pulmonary disease and atrial fibrillation may have contributed to pulmonary hypertension and RV dysfunction. However, on multi-variable analysis in the present study, LV GLS was independently associated with all-cause mortality after correcting for coronary artery disease, previous myocardial infarction and atrial fibrillation (COPD was not associated with outcome in the univariable Cox regression analysis). Furthermore, as comorbidities such as coronary artery disease are prevalent findings in severe AS patients, inclusion of these patients depicts a true representation of the severe AS population in daily practice. For correct assessment of cardiac damage, comprehensive echocardiographic evaluation is necessary, preferably using standard protocols. This may not be always be feasible in clinical practice, although the included criteria for the staging classification were selected based on broad acceptance and simplicity in acquisition.7 In the present study, LV GLS was measured using vendor-dependent software and therefore, the results may not be generalizable across other imaging platforms. However, recent studies have reported good feasibility and inter- and intra-observer variability and only limited differences between vendors, especially compared with conventional parameters such as LVEF.31,32 Finally, LV GLS has been reported to be a load-dependent parameter, influenced particularly by afterload.33,34 In AS, afterload is increased due to pressure overload and this may have affected LV GLS measurements in the current study. Importantly, impaired LV GLS has been suggested to reflect true depression of myocardial contractility35 and has been shown to be an independent predictor of outcome in load-dependent conditions such as acute heart failure36 and secondary mitral regurgitation.37
Conclusions
This large single-centre cohort of symptomatic severe AS patients demonstrates that LV GLS has incremental prognostic value over a recently proposed staging classification based on cardiac damage. Incorporation of ranges of LV GLS in the staging classification results in the identification of patients with more advanced cardiac damage among those classified within the less advanced cardiac damage stages and reclassification of these patients to more advanced stages, improving the prognostic value of the originally proposed staging classification. These findings suggest that the addition of LV GLS to the currently proposed staging classification may enhance risk stratification, especially when staging of cardiac damage based on conventional echocardiography suggests limited cardiac damage. In addition, it may provide better pre-procedural risk assessment if implemented in currently used risk prediction algorithms and therefore improve timing of intervention in severe AS patients.
Supplementary data are available at European Heart Journal - Cardiovascular Imaging online.
Conflict of interest: The Department of Cardiology received research grants from Biotronik, Medtronic, Boston Scientific, GE Healthcare, and Edwards Lifesciences. N.A.M. has received speaker fees from Abbott Vascular and Philips Ultrasound. Z.P.D. has received speaker fees from Phillips. P.G. has received consultant and speaker fees from Abbott Vascular, Boston Scientific, Cardiovascular Systems, Edwards Lifesciences, Medtronic, and Cordis and holds equity in SoundBite Medical Solutions, Saranas, Pi-Cardia, and Sig.Num. S.H.E. has received speaker fees from Edwards Lifesciences and Abbott Vascular. V.D. has received speaker fees from Abbott Vascular, Medtronic, Edwards Lifesciences, GE Healthcare and MSD. J.J.B. has received speaker fees from Abbott Vascular . The other authors have nothing to declare.

Comments
A possible confounding factor in their analysis not mentioned in the limitations may be coexisting cardiac amyloidosis (CA) particularly given the mean age of 75 years in the study group. Reduced GLS is a hallmark of myocardial involvement of CA and several recent studies have demonstrated a prevalence of around 15% of CA in the severe AS population which is associated with reduced prognosis. (1-3) Particularly if signs of cardiac damage are to be considered in clinical timing of valve intervention, the possibility of CA as an contributor to the LV dysfunction should be investigated.
1. Rosenblum H, Masri A, Narotsky DL, et al. Unveiling outcomes in coexisting sever aortic stenosis and transthyretin cardiac amyloidosis. Eur J Heart Fail 2020
2. Scully PS, Patel KP, Treibel TA, et al. Prevalence and outcomes of dual aortic stenosis and cardiac amyloid pathology in patients referred for transcathter aortic valve implantation Eur Heart J 2020 41: 2759-67.
3. Boldrini M, Cappelli F, Chacko L, et al. Multiparametric echocardiography scores for the diagnosis of cardiac amyloidosis. JACC: Cardiovasc Imag 2020 13: 909-20.