


Undetectable high-sensitivity cardiac troponin (hs-cTn) in a single determination upon admission may rule out acute coronary syndrome. We investigated undetectable hs-cTnT (<detection limit; <5 ng/l) together with clinical risk scores (GRACE, TIMI, HEART and a previously published simple score), for one-year outcomes in patients with chest pain and normal hs-cTnT (<99th percentile; <14 ng/l) upon admission.
This study was a retrospective design involving 2254 consecutive patients (July 2016–November 2017). The primary endpoint was one-year death or acute myocardial infarction; the secondary endpoint added unstable angina requiring revascularization. Early (<90 minutes since pain onset, n = 661) and late (n = 1593) presenters were separately considered.
A total of 56 (2.5%) patients reached the primary endpoint and 91 (4%) the secondary endpoint. Undetectable hs-cTnT had a poor C-statistic in early and late presenters (0.648 and 0.703, respectively). Adding hs-cTnT measurable concentrations above the detection limit (as continuous variable) significantly enhanced the C-statistics (0.754 and 0.847, respectively). Addition of the HEART (0.809, p = 0.005) or simple clinical scores (0.804, p = 0.02) further improved the model and significantly reclassified patient risk, in early presenters. The results were similar for the secondary endpoint. The TIMI risk score performed worse and the GRACE score did not give additional information. In late presenters, no clinical score provided significant additional information over hs-cTnT.
Diagnostic algorithms should consider not only whether hs-cTnT is above or below the detection limit but also its concentration if above, for risk stratification over one year in patients with initial normal hs-cTnT. The clinical scores provide valuable additional information in early presenters.
Introduction
Decision making in acute chest pain is challenging. As one of the most frequent causes of emergency department visits, rapid and safe discharge of low-risk patients is crucial. Troponin concentrations below the upper reference limit measured (the 99th percentile) are commonly regarded as normal. Though these normal concentrations at arrival imply a potential low risk, yet some patients have a non-negligible risk of events despite normal troponin.1,2
Several algorithms based on hs-cTn have been derived for rapid rule-out of acute coronary syndrome.3 They provide valuable though not completely optimal support.4 Among algorithms, undetectable (below the limit of detection; LoD) concentrations of hs-cTn at arrival is the simplest, since it could allow a rapid discharge after a single hs-cTnT determination. Previous studies have shown that undetectable hs-cTn on admission has very high negative predictive value in the exclusion of myocardial infarction.5,,,,,,,,,–15 Not all studies, however, have shown optimal sensitivity.14 Furthermore, the role of undetectable hs-cTnT for prediction midterm outcomes is unknown. Clinical scores might complement the performance of the undetectable hs-cTn algorithm.16
The present study involved a series of patients presenting to the emergency department with acute chest pain showing normal hs-cTn concentrations in the first determination upon hospital arrival. The main difference from the vast majority of the studies in the field is that it concentrates only on patients with troponin concentration within the normal range (below the 99th percentile).17,18 We chose this particular group of patients as the a priori candidates for rapid discharge. On the other hand, patients were followed-up for 1 year in order to identify those patients who might require closer monitoring after discharge. Three widely known clinical scores (GRACE, TIMI and HEART) for risk stratification of acute coronary syndromes were tested.19,–21 A previously published simple clinical score derived from patients with acute chest pain and normal hs-cTn concentrations was also analyzed.22 The aims were to evaluate the undetectable hs-cTn strategy (below the LoD), measurable troponin values below the upper reference limit and the ancillary role of clinical scores, for one year outcomes.
Methods
Study design
The study group consisted of 2254 consecutive patients presenting to the emergency department of the University Clinic Hospital of València, Spain, with acute chest pain, non-persistent ST-segment elevation in the initial electrocardiogram, and normal hs-cTnT in the first determination at arrival. This was a retrospective cohort design that analyzed the electronic medical records of emergency department visits from 1 July 2016 to 1 November 2017. In this database we identified a cohort of consecutive patients presenting with chest pain as the chief complaint without persistent ST-segment elevation, in whom hs-cTnT was determined at arrival. To be screened for the study, the first hs-cTnT measurement had to be normal (hs-cTnT <14 ng/l, Roche Diagnostic, Switzerland). A total of 3019 patients were screened, of whom 2254 were selected. The criteria for exclusion were: (a) transient ST-segment deviation (either elevation or depression) in the initial electrocardiogram (ECG), (b) diagnoses other than acute coronary syndrome made in the emergency department that could explain chest pain, such as arrhythmias (tachyarrhythmias >100 beats/minute or bradyarrhythmias <50 beats/minute), structural heart disease, pericardial disease, aortic dissection or extra-cardiac disease. Figure 1 shows the study flowchart. All electronic registries were reviewed by a single investigator (EV). The study was approved by the ethics committee of the University Clinic Hospital of València.
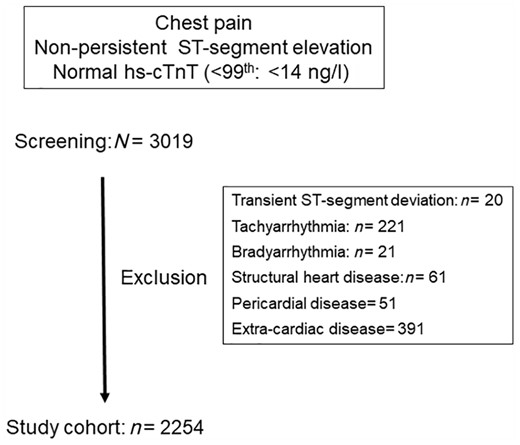
Study flowchart.
Patients were managed according to standard emergency department practice. Accordingly, additional hs-cTnT measurements or non-invasive ischemia tests and admission or discharge decisions were at the discretion of the attending physician. The following variables were collected: time from chest pain onset, chest pain characteristics (including effort-related pain at admission or the previous week, chest pain slightly, moderately or highly suggestive of acute coronary syndrome according to the HEART score, and chest pain recurrence in the previous 24 hours), demographic data and medical history (age, gender, coronary risk factors, prior history of cardiovascular disease, prior hospitalization for heart failure), admission heart rate and blood pressure, electrocardiograms (ST-segment depression, T wave inversion, left bundle branch block, atrial fibrillation at admission) and routine blood tests (hs-cTnT, and creatinine).
Four clinical scores were calculated: GRACE score for 6-month mortality or myocardial infarction (seven variables), TIMI risk score (seven variables), HEART score (five variables, three categories per variable) and a previously published simple clinical score (four variables: male gender, one point; effort-related chest pain, one point; at least two chest pain episodes in the last 24 hours, two points; prior ischemic heart disease, two points).19,,–22 The HEART and modified HEART were the same for this cohort of patients since the troponin score component of HEART was always zero (i.e. the score represents the non-troponin components of HEART).
Outcome measures
The primary endpoint was all-cause mortality or acute myocardial infarction during 1-year follow-up (including the index visit). Acute myocardial infarction was defined according to European Society of Cardiology guidelines on non-ST-segment elevation acute coronary syndrome, requiring a rising and/or falling pattern of hs-cTnT values with at least one value above the 99th.23 The rising and/or falling pattern was considered if serial changes >50% since the initial hs-cTnT value was below the 99th in all cases.24 The secondary endpoint was all-cause mortality, acute myocardial infarction or unstable angina diagnosis receiving urgent revascularization during 1-year follow-up (including the index visit).
Since the European Society of Cardiology guidelines state that the undetectable hs-cTn algorithm using a single determination upon admission should only be applicable in patients with chest pain onset >3 hours, the patient population was divided into two groups, early presenters (chest pain <3 hours, n = 661) and late presenters (chest pain >3 hours, n = 1593). The analysis was performed separately.
Assay
The hs-cTnT assay (Roche Diagnostic, Switzerland) has a manufacturer specified upper reference limit of 14 ng/l and limit of detection of 5 ng/l.
Statistical analysis
Continuous variables were expressed as mean and standard deviation, while categorical variables were expressed as absolute values and percentages. The chi-square test and unpaired t test were used for comparison between patients with undetectable and detectable hs-cTnT concentrations. All clinical variables were normally distributed except the delay from chest pain onset, which was expressed by the median and interquartile intervals and compared using the Kruskal–Wallis test.
The discriminative ability of admission hs-cTnT concentration was tested alone and pooled with each clinical score, using Cox regression analysis. Any troponin concentrations below the limit of detection of the hs-cTnT assay (LoD: 5 ng/l) were coded to the same value (4.9 ng/l). hs-cTnT was included in the model as an indicator variable which dichotomizes hs-cTnT concentrations as above or below the LoD, and as a continuous variable. The TIMI, HEART, and simple clinical scores were treated as categorical variables because of their non-normal distribution. As a rule of thumb, regression models should have no more than one degree of freedom per ~15 events. Therefore, to reduce degrees of freedom we categorized the TIMI score as 0, 1, ≥2 points, the HEART score as 0–3, 4–6, ≥7 points and the simple clinical score as 0, 1, ≥2 points. The GRACE score was normally distributed and treated as a continuous variable. The hazard ratio (HR), 95% confidence intervals (CI) and C-statistic of the models, were estimated.
To test the value of risk scores beyond the undetectable troponin strategy, the simple model of hs-cTnT above or below the LoD (LoD model) was compared with a model of hs-cTnT above or below the LoD combined with each clinical risk score (LoD + score models). To test if there was additional prognostic value provided by actual measured troponin concentrations these models were then compared with models that additionally had hs-cTnT concentrations as a continuous variable (LoD + continuous hs-cTnT + score models). Comparisons between models were made using the log-likelihood ratio test and p-values are presented. We evaluated the changes in discrimination accuracy (Harrell’s C-statistic) as well as risk reclassification using the integrated discrimination improvement (IDI) and continuous net reclassification improvement (NRI) indexes.
We further evaluated the use of the LoD strategy combined with clinical scores dichotomized according to the recommended cutoffs defined in previous studies: GRACE score >140 points,23 TIMI risk score >1 point,25 HEART score >3 points,26 and the simple clinical score >1 point.21 The negative predictive value and sensitivity were estimated.
Statistical analysis was performed using SPSS version 20.0 software (SPSS, Inc, Chicago, IL) and Stata 14 (StataCorp LP).
Results
Patient characteristics and follow-up
Table 1 presents the characteristics of the patient population as well as the events. Mean age was 56 ± 16 years and 1167 (52%) were male. A total of 661 patients were early presenters (<90 minutes since chest pain onset) and 1593 late presenters (>90 minutes since chest pain onset). Mean hs-cTnT values at hospital arrival were 6.5 ± 3.0 ng/l; 900 (40%) patients showed undetectable hs-cTnT (<5 ng/l). A second hs-cTnT determination was carried out in 702 (31%) patients.
Patient characteristics (n = 2254).
| Age (years) | 56 ± 16 |
| Males | 1167 (51.8%) |
| Current smokers | 561 (24.9%) |
| Hypertension | 903 (40.1%) |
| Hypercholesterolemia | 1043 (46.3%) |
| Diabetes mellitus | 331 (14.7%) |
| Family history of early ischemic heart disease | 103 (4.6%) |
| Previous myocardial infarction | 228 (10.1%) |
| Previous percutaneous coronary intervention | 199 (8.8%) |
| Previous coronary bypass surgery | 39 (1.7%) |
| Previous admission for heart failure | 32 (1.4%) |
| Peripheral artery disease | 41 (1.8%) |
| Previous stroke | 65 (2.9%) |
| Previous antiplatelet treatment | 399 (17.7%) |
| Previous statin treatment | 863 (38.3%) |
| Effort-related chest pain in the previous week | 135 (6.0%) |
| Chest pain moderately suspicious | 1549 (68.7%) |
| Chest pain highly suspicious | 187 (8.3%) |
| Recurrent chest pain in the last 24 hours | 85 (3.8%) |
| Admission systolic blood pressure (mmHg) | 137 ± 21 |
| Admission diastolic blood pressure (mmHg) | 79 ± 14 |
| Admission heart rate (beats/minute) | 78 ± 20 |
| ST-segment depression ≥0.5 mm | 71 (3.1%) |
| T-wave inversion ≥1 mm | 201 (8.9%) |
| Admission atrial fibrillation (ventricular rate <100 beats/minute) | 61 (2.7%) |
| Left bundle branch block | 27 (1.2%) |
| Permanent pacemaker | 12 (0.5%) |
| Hospitalization at the index episode | 161 (7.1%) |
| Non-ST-segment elevation acute myocardial infarction diagnosis at the index episode | 19 (0.8%) |
| Readmission for acute myocardial infarction | 22 (1.0%) |
| All-cause mortality | 18 (0.8%) |
| One-year primary endpoint | 56 (2.5%) |
| Unstable angina receiving urgent revascularization at the index episode | 21 (0.9%) |
| Readmission for unstable angina receiving urgent revascularization | 16 (0.7%) |
| One-year secondary endpoint | 91 (4%) |
Data are presented as n (%), or mean ± standard deviation, or median (lower-quartile to upper-quartile).
A total of 161 (7.1%) patients were hospitalized at the index episode, 19 (0.8%) of them were diagnosed with non-ST-segment elevation acute myocardial infarction after a second hs-cTnT determination. A total of 79 (3.5%) patients underwent exercise testing, 62 (2.8%) stress cardiac magnetic resonance with dipyridamole, 86 (3.8%) coronary angiogram, and 29 (1.3%) coronary revascularization (26 percutaneous coronary revascularizations and 2 bypass surgeries).
Complete follow-up was obtained in 2236 (99%) patients; 2 patients were lost after the index episode, while the remaining 16 patients with incomplete follow-up all reached at least 6-week follow-up (range = 42 to 279 days).
Primary endpoint
In total, 56 (2.5%) patients reached the primary endpoint; 26 early presenters and 30 late presenters. Undetectable hs-cTnT had a poor C-statistic in both groups (0.648 and 0.703, respectively, Table 2). Adding hs-cTnT as a continuous variable to each model, using the measurable detectable concentrations, improved them all in comparison with the models only using hs-cTnT as a dichotomized variable (detectable or undetectable), both in early and late presenters (0.754, p = 0.007; and 0.847, p = 0.0001; respectively). The discrimination ability, however, was better in late presenters (p = 0.09, Figure 2). In early presenters, addition of the HEART (0.809; p = 0.005) and simple clinical scores (0.804; p = 0.020) improved the model in comparison with the hs-cTnT model (detectable or undetectable plus measured detectable hs-cTnT concentration). Likewise, the HEART or simple clinical scores led to a significant risk reclassification in terms of the NRI and IDI indexes (Table 3). In contrast, the addition of the TIMI risk and GRACE scores did not produce a significant change. In late presenters, no clinical score resulted in a significant improvement on the model’s discriminative ability or risk reclassification (Tables 2 and 3).
Discriminative ability of admission hs-cTnT concentration alone and pooled with each clinical score for the primary endpoint (death or acute myocardial infarction).
| Model | C-statistic (95% CI) | p |
|---|---|---|
| Early presenters (n = 661) | ||
| Dichotomized hs-cTnT (LoD) | 0.648 (0.562–0.733) | |
| Dichotomized (LoD) + continuous (per1 ng/l) | 0.754 (0.665–0.843) | 0.007a |
| Dichotomized (LoD) + continuous (per1 ng/l) + GRACE score | 0.754 (0.665–0.843) | 1b |
| Dichotomized (LoD) + continuous (per1 ng/l) + TIMI risk score | 0.765 (0.678–0.852) | 0.512b |
| Dichotomized (LoD) + continuous (per1 ng/l) + HEART score | 0.809 (0.728–0.890) | 0.005b |
| Dichotomized (LoD) + continuous (per1 ng/l) + simple score | 0.804 (0.726–0.883) | 0.020b |
| Late presenters (n = 1593) | ||
| Dichotomized hs-cTnT (LoD) | 0.703 (0.635–0.771) | |
| Dichotomized (LoD) + continuous (per1 ng/l) | 0.847 (0.785–0.910) | 0.0001a |
| Dichotomized (LoD) + continuous (per1 ng/l) + GRACE score | 0.847 (0.785–0.910) | 1b |
| Dichotomized (LoD) + continuous (per1 ng/l) + TIMI risk score | 0.857 (0.794–0.920) | 0.468b |
| Dichotomized (LoD) + continuous (per1 ng/l) + HEART score | 0.858 (0.798–0.918) | 0.564b |
| Dichotomized (LoD) + continuous (per1 ng/l) + simple score | 0.868 (0.814–0.922) | 0.243b |
In comparison with the model using only dichotomized hs-cTnT (above or below LoD).
In comparison with the model using dichotomized hs-cTnT (above or below LoD) + continuous hs-cTnT (per 1 ng/l).
CI: confidence interval; HR: hazard ratio; Hs-cTnT: high sensitivity cardiac troponin T; LoD: limit of detection.
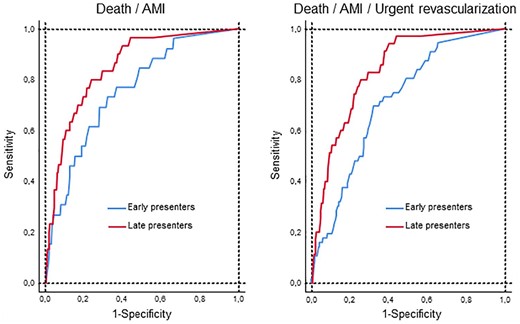
Diagnostic performance of hs-cTnT considering both whether hs-cTnT was above or below the limit of detection and its measured concentration if detectable (below the 99th percentile) upon hospital arrival. Receiver operating characteristic curves for the primary (left) and secondary (right) endpoints, in early (<3 hours since chest pain onset, blue line) and late presenters (red line). Discriminative ability was superior in late presenters in comparison with early presenters for the primary (0.847 vs 0.754, p = 0.09) and secondary (0.837 vs 0.713, p = 0.004) endpoints.
AMI: acute myocardial infarction.
Risk reclassification for the primary endpoint after adding each clinical score to the hs-cTnT model using dichotomized hs-cTnT (above or below LoD) plus continuous hs-cTnT (per 1 ng/l).
| hs-cTnT vs hs-cTnT + GRACE score | hs-cTnT vs hs-cTnT + TIMI risk score | hs-cTn vs hs-cTnT + HEART score | hs-cTn vs hs-cTnT + Simple clinical score | |
|---|---|---|---|---|
| Early presenters (n = 661) | ||||
| NRI (95% CI) | −0.006 (−0.537 to 0.511) | 0.293 (−0.496 to 0.873) | 0.595 (0.218–1.058) | 0.533 (0.219–1.180) |
| IDI (95% CI) | −0.001 (−0.005 to 0.012) | 0.003 (−0.003 to 0.018) | 0.067 (0.010–0.179) | 0.023 (0.003–0.057) |
| Late presenters (n = 1593) | ||||
| NRI (95% CI) | 0.145 (−0.460 to 0.815) | 0.786 (−0.333 to 1.220) | 0.914 (−0.459 to 1.186) | 0.282 (0.005–1.077) |
| IDI (95% CI) | 0.003 (−0.003 to 0.036) | 0.008 (−0.002 to 0.035) | 0.006 (−0.002 to 0.029) | 0.011 (−0.004 to 0.053) |
CI: confidence interval; hs-cTn: high sensitivity cardiac troponin; hs-cTnT: high sensitivity cardiac troponin T; IDI: integrated discrimination improvement; LoD: limit of detection; NRI: continuous net reclassification improvement.
The undetectable hs-cTnT cutoff had optimal negative predictive value (99.53%, 95% CI 97.01–99.99) but suboptimal sensitivity (96.30%, 95% CI 79.11–99.8) for the primary endpoint in early presenters. Undetectable hs-cTnT combined with the HEART score at the recommended thresholds enhanced sensitivity to 100% (95% CI 84.50–99.65); the remaining scores did not increase the sensitivity. In late presenters, hs-cTnT negative predictive value (99.85%, 95% CI 99.06–99.99) and sensitivity (96.67, 95% CI 80.95–99.83) were not improved by any score.
Secondary endpoint
A total of 91 (4%) patients reached the secondary endpoint; 56 early presenters and 35 late presenters. Tables 4 and 5 show the performance of hs-cTnT together with the risk scores. The combination of dichotomized hs-cTnT (undetectable vs detectable) and continuous hs-cTnT performed better than dichotomized hs-cTnT alone, both in early and late presenters. Again, the C-statistic was greater in late presenters (p = 0.004, Figure 2). In early presenters, the TIMI, HEART and simple scores, unlike the GRACE score, significantly increased the C-statistics and reclassified risk (Tables 4 and 5). In late presenters, the clinical scores did not improve the C-statistic, although the TIMI, HEART and simple scores provided a significant risk reclassification in terms of the continuous NRI (Tables 4 and 5).
Discriminative ability of admission hs-cTnT concentration alone and pooled with each clinical score for the secondary endpoint (death or acute myocardial infarction or urgent revascularization).
| Model | C-statistic (95% CI) | p |
|---|---|---|
| Early presenters (n = 661) | ||
| Dichotomized hs-cTnT (LoD) | 0.647 (0.584–0.709) | |
| Dichotomized (LoD) + continuous (per1 ng/l) | 0.713 (0.650–0.776) | 0.012a |
| Dichotomized (LoD) + continuous (per1 ng/l) + GRACE score | 0.717 (0.655–0.779) | 0.475b |
| Dichotomized (LoD) + continuous (per1 ng/l) + TIMI risk score | 0.772 (0.719–0.825) | 0.008b |
| Dichotomized (LoD) + continuous (per1 ng/l) + HEART score | 0.765 (0.708–0.822) | 0.003b |
| Dichotomized (LoD) + continuous (per1 ng/l) + simple score | 0.835 (0.789–0.881) | 0.0001b |
| Late presenters (n = 1593) | ||
| Dichotomized hs-cTnT (LoD) | 0.706 (0.644–0.768) | |
| Dichotomized (LoD) + continuous (per1 ng/l) | 0.837 (0.781–0.893) | 0.0001a |
| Dichotomized (LoD) + continuous (per1 ng/l) + GRACE score | 0.836 (0.776–0.895) | 0.848b |
| Dichotomized (LoD) + continuous (per1 ng/l) + TIMI risk score | 0.856 (0.798–0.914) | 0.384b |
| Dichotomized (LoD) + continuous (per1 ng/l) + HEART score | 0.853 (0.799–0.906) | 0.432b |
| Dichotomized (LoD) + continuous (per1 ng/l) + simple score | 0.841 (0.785–0.898) | 0.897b |
In comparison with the model using only dichotomized hs-cTnT (above or below LoD).
In comparison with the model using dichotomized hs-cTnT (above or below LoD) + continuous hs-cTnT (per 1 ng/l).
CI: confidence interval; HR: hazard ratio; hs-cTnT: high sensitivity cardiac troponin T; LoD: limit of detection.
Risk reclassification for the secondary endpoint after adding each clinical score to the hs-cTnT model using dichotomized hs-cTnT (above or below LoD) plus continuous hs-cTnT (per 1 ng/l).
| Hs-cTnT vs hs-cTnT + GRACE score | Hs-cTnT vs hs-cTnT + TIMI risk score | Hs-cTn vs hs-cTnT + HEART score | Hs-cTn vs hs-cTnT + Simple clinical score | |
|---|---|---|---|---|
| Early presenters (n = 661) | ||||
| NRI (95% CI) | −0.140 (−0.394 to 0.328) | 0.634 (0.361–0.904) | 0.610 (0.358–0.867) | 1.076 (0.666–1.301) |
| IDI (95% CI) | −0.002 (−0.003 to 0.011) | 0.029 (0.006–0.065) | 0.058 (0.015–0.124) | 0.090 (0.051–0.143) |
| Late presenters (n = 1593) | ||||
| NRI (95% CI) | 0.244 (−0.382 to 0.835) | 0.880 (0.541–1.329) | 0.995 (0.647–1.197) | 0.425 (0.170–1.112) |
| IDI (95% CI) | 0.006 (−0.002 to 0.036) | 0.018 (0.001–0.045) | 0.013 (−0.001 to 0.049) | 0.021 (−0.001 to 0.068) |
CI: confidence interval; hs-cTn: high sensitivity cardiac troponin; hs-cTnT: high sensitivity cardiac troponin T; IDI: integrated discrimination improvement; LoD: limit of detection; NRI: continuous net reclassification improvement.
In early presenters, the sensitivity (94.64%, 95% CI 84.20–98.61) and negative predictive value (98.59%, 95 % CI 95.60–99.64) of undetectable hs-cTnT were increased by its combination with the TIMI (sensitivity = 98.21%, 95% CI 89.19–99.91; negative predictive value = 99.48%, 95% CI 96.70–99.97) and simple score (sensitivity = 98.21%, 95% CI 89.19–99.91; negative predictive value = 99.46%, 95% CI 96.55–99.97), reaching 100% with the HEART score (sensitivity = 100%, 95% CI 97.11–99.94; negative predictive value = 100%, 95% CI 92.00–99.84). In late presenters, the clinical scores did not improve undetectable hs-cTnT sensitivity (97.14%, 95% CI 83.88–99.85) and negative predictive value (99.85%, 95% CI 99.06–99.99).
Discussion
This study investigated diagnostic strategies in patients presenting to the emergency department with acute chest pain using hs-cTnT. Its principal strength is that it focused on patients with normal hs-cTnT at arrival since patients with elevated hs-cTnT require careful evaluation and hospital admission in most cases. The main finding was that the evaluation of whether hs-cTnT is above or below the LoD together with the measured concentrations if above, in a single determination at admission, outperformed the mere consideration of undetectable hs-cTnT alone. However, hs-cTnT still showed suboptimal diagnostic accuracy in early presenters (<3 hours since chest pain onset). The addition of the HEART or simple clinical risk scores resulted in significant incremental discriminative ability and risk reclassification beyond what hs-cTnT alone can do. The ancillary role of the HEART or simple clinical risk scores was even greater when considering unstable angina diagnosis requiring coronary revascularization. Therefore, hs-cTnT in a single determination should not be used alone but in combination with clinical scores for decision making in early presenters. In late presenters, however, the performance of hs-cTnT was more robust and its discriminative accuracy was not improved by any clinical score.
Undetectable hs-cTn
Several studies and meta-analyses suggest that undetectable hs-cTn concentrations at hospital arrival rule out acute coronary syndrome.5,,,,,,,,,–15 This is the simplest hs-cTn algorithm since it results in rapid discharge after a single hs-cTn test. The proportion of patients identified as low risk depends on population characteristics. Our study, which included only patients with hs-cTnT below the 99th percentile, revealed a 40% rate of undetectable hs-cTnT, implying a potentially valuable tool in this population. The sensitivity of the undetectable hs-cTn strategy is, however, a matter of concern. By consensus, the sensitivity goal for acute myocardial diagnosis or other major adverse cardiac events soon after discharge was established at 99%.27 In a meta-analysis using hs-cTnT, not all studies reached the 99% sensitivity target.14
Our results indicate sub-optimal diagnostic accuracy for 1-year outcomes, particularly in early presenters. It should be noted that the 99% sensitivity threshold was proposed for diagnosis at the emergency department while our study was targeted at 1-year outcomes. Even though undetectable hs-cTnT might guide a safe discharge in terms of short-term outcomes, some patients still require careful monitoring during follow-up due to the non-negligible likelihood of cardiac events. The identification of these patients is advisable.
The Cox regression model indicated that the discriminative ability enhanced by considering both whether hs-cTnT was above or below the LoD, and its actual concentration if above at hospital arrival. The number of events in this study is too small to develop a medium (1-year) risk tool. However, the results of this study suggest that a useful approach in developing such a tool would be to consider only patients with troponin concentrations below the upper reference limit, include troponin as a continuous variable and as whether it is above or below the LoD, and include relevant clinical risk factors. Alternatively, serial hs-cTnT testing might be indicated in some early presenters. The European Society of Cardiology guidelines do require a second sample when clinical suspicion is not low, and the initial level is negative or undetectable.23 A recent study suggests that the 0/1-hour algorithm is safe for ruling out purposes in early presenters.28
Clinical scores
Clinical scores aim to stratify risk by integrating clinical data, hemodynamic status, ECG findings, and myocardial injury biomarkers. Of the four scores evaluated, only the HEART and simple clinical scores have been developed specifically for use in chest pain assessment in the emergency department. The HEART and simple clinical scores were the most useful in our study, the TIMI risk score was of modest value and the GRACE score did not provide additional information over hs-cTnT. The GRACE and TIMI scores were developed for use after acute coronary syndrome diagnosis but have been applied in the emergency department. The GRACE score is the most precise index in acute coronary syndromes. Current guidelines recommend a 140-point cutoff to define low risk in the context of normal hs-cTn concentrations.23 This cutoff was not useful in our study because nearly all patients were below the cutoff. Indeed, the GRACE score performed worse than the TIMI, HEART and simple clinical scores, which can be explained by population characteristics. All patients showed hemodynamic stability, no ischemic ECG changes, and normal troponin; therefore, scores focused on clinical data could be expected to perform better.
Limitations
This study has the limitations inherent to its retrospective nature, though all consecutive patients were screened during the study period. The low number of events limits conclusions. This low event rate was expected since the study targeted a very low risk population in considering all comers to the emergency department with initial normal hs-cTnT concentrations. However, rapid rule-out is particularly intriguing in this population and the results of the study might provide some clues for this purpose.29 On the other hand, the outcomes were not centrally adjudicated. The mean age was 56 years; therefore, the applicability of the results for the elderly is uncertain. The decision for a second hs-cTnT determination was left at the discretion of the attending physician and we cannot control how this fact might have influenced the results of the study. Finally, we were unable to analyze the EDACS and T-MACS scores because of the unavailability of all the variables that make up these scores.30,31
Conclusions
In patients presenting to the emergency department with acute chest pain and normal hs-cTnT concentrations after a single determination upon arrival, diagnostic algorithms should take into account not only whether hs-cTnT is above or below the LoD but also its actual concentration if above, for decision making and prognostic stratification over one year. In addition, and especially in early presenters, the clinical risk scores should also be considered.
The authors thank Marina Soro, for her support to this project.
The author(s) declared the following potential conflicts of interest with respect to the research, authorship, and/or publication of this article: JS reports grants from Biotronik, Prosmedica and Bayer outside the submitted work. JNú reports personal fees from Novartis, Vifor, Rovi, Boehringer Ingelheim and Novo Nordisk, outside the submitted work. JP has received consultancy fees from Abbott Diagnostics. The remaining authors have nothing to disclose.
The author(s) disclosed receipt of the following financial support for the research, authorship, and/or publication of this article: This work was supported by grants from the Spanish Ministry of Economy and Competitiveness through the Carlos III Health Institute: CIBERCV 16/11/00420, Madrid, Spain.

Comments