


Cardiogenic shock complicating ST-elevation myocardial infarction is characterised by progressive left ventricular dysfunction causing inflammation and neurohormonal activation. Often, cardiogenic shock develops after hospital admission. Whether inflammation and a neurohormonal activation precede development of clinical cardiogenic shock is unknown.
In 93% of 2247 consecutive patients with suspected ST-elevation myocardial infarction admitted at two tertiary heart centres, admission plasma levels of pro-atrial natriuretic peptide, copeptin, mid-regional pro-adrenomedullin and stimulation-2 were measured on hospital admission. Patients were stratified according to no cardiogenic shock development and cardiogenic shock developed before (early cardiogenic shock) or after (late cardiogenic shock) leaving the catheterization laboratory. In total, 225 (10%) patients developed cardiogenic shock, amongst these patients late cardiogenic shock occurred in 64 (2.9%). All four biomarkers were independently associated with the development of late cardiogenic shock (odds ratio per two-fold increase in risk: 1.19–3.13) even when adjusted for the recently developed Observatoire Régional Breton sur l’Infarctus risk score for prediction of late cardiogenic shock development. Furthermore, pro-atrial natriuretic peptide, copeptin and mid-regional pro-adrenomedullin, but not stimulation-2, added significant predictive information, when added to the Observatoire Régional Breton sur l’Infarctus risk score (area under the receiver-operating characteristic curve, pro-atrial natriuretic peptide: 0.87, p=0.0008; copeptin: 0.86, p<0.05; mid-regional pro-adrenomedullin: 0.88, p=0.006).
Pro-atrial natriuretic peptide, copeptin, mid-regional pro-adrenomedullin and stimulation-2 admission plasma concentration were associated with late cardiogenic shock development in patients admitted with suspected ST-elevation myocardial infarction. Pro-atrial natriuretic peptide, mid-regional pro-adrenomedullin and copeptin had independent predictive value for late cardiogenic shock development.
Introduction
During recent decades, short-term mortality in patients suffering from myocardial infarction (MI) has been drastically reduced.1,2 However, for the 5–10% of patients with ST-elevation myocardial infarction (STEMI) developing cardiogenic shock (CS), mortality remains high.1 Furthermore, the most frequent cause of 30-day mortality after STEMI is CS.3 CS due to cardiac ischaemia is most often characterised by progressing left ventricular (LV) dysfunction complicated by a systemic inflammatory response-like syndrome4 and increased neurohormonal activation.5
Natriuretic peptides (NPs), released from the heart in response to myocardial strain, have previously been shown to have increased in the plasma from STEMI patients with CS compared to non-CS patients.6,7 In response to MI especially, atrial natriuretic peptide (ANP) plasma concentration raises within a few hours after the infarction.8 Arginine vasopressin (AVP) increases peripheral vascular resistance9 and has also been shown to increase in patients with CS.10 Adrenomedullin (ADM) has a vasodilatory effect,11 and the plasma concentration of the stable mid-regional pro-adrenomedullin (MRproADM) fragment has been found to be elevated in CS patients.12 An increased systemic inflammatory response may cause inappropriate vasodilation in CS patients4 and inflammatory biomarkers have been found to be elevated in STEMI patients with CS compared to non-CS patients.13 Recently, soluble stimulation-2 (ST2), a receptor from the interleukin (IL)-1 receptor family, has been found in increased concentrations in patients with CS compared to STEMI patients without CS.14
Not all STEMI patients developing CS are in shock at admission, but develop CS within the next few days.15 Mortality in these patients is comparable to patients with shock at admission.15 As these patients show no obvious hypoperfusion on hospitalization, they are difficult to identify and biomarkers measured early could potentially predict high-risk patients with a need for intensified observation and treatment.
In this study, we assessed the associations between biomarkers reflecting neurohormonal response and inflammation in a large consecutive and contemporary cohort of patients admitted with suspected STEMI versus the development of CS. Further, we assessed the predictive value of the biomarkers drawn upon admission for the development of CS.
Methods
The study population has previously been described in detail.15 We consecutively included patients admitted for acute coronary angiography (CAG) due to suspected STEMI at two tertiary heart centres in Denmark, throughout 2015–2016.
The data that support the findings of this study are available from the corresponding author upon reasonable request.
CS
The primary endpoint of this study was development of CS, which was defined as the presence of the following three criteria:
Unstable haemodynamic status (systolic blood pressure (sBP)<90 mm Hg for more than 30 min or treatment with at least one vasopressor/inotropic agent) and/or mechanical circulatory support, AND
signs of end-organ hypoperfusion (cold and clammy extremities and/or confusion and/or oliguria), AND
echocardiographic measurements indicating poor cardiac function (LV ejection fraction (LVEF)<45%) assessed during the index admission.
Patients were stratified according to whether they developed CS or not. CS patients were further divided based on the time of CS onset. Patients being in CS upon hospital admission or developing CS in the catheterization laboratory were defined as having ‘early CS’, whereas patients being stable leaving the catheterization laboratory but subsequently developing CS in the ward were defined as having ‘late CS’.
Biomarkers and assays
Blood was drawn upon arrival at the catheterization laboratory and was collected in lithium-heparin tubes immediately after sheath insertion and always before the CAG. Blood was centrifuged at 2000 g relative centrifugal force for 10 min and plasma was subsequently stored at −80°C.
Laboratory technicians conducted the biochemical analyses. Pro-atrial natriuretic peptide (proANP) was measured by a processing independent analysis (PIA); in this study, interassay variation was calculated to 6–12% over the present molar range. Notably, this method correlates closely with the commercial midregional (MR) proANP assay available from Thermo-Fisher.16 Copeptin was measured on the Kryptor Compact platform (Thermo-Fisher, Hennigsdorf, Germany). The actual analytical variation in the present study was <12% over the range of molar concentrations. MRproADM was measured with an automated sandwich chemiluminescence immunoassay on the Kryptor System (Thermo-Fisher, Hennigsdorf, Germany); the present variation was <8%. Finally, ST2 was measured by a quantitative sandwich enzyme-linked immunosorbent assay (Presage ST2 Assay, Critical Diagnostics, Inc., San Diego, California, USA). In the present study, the variation was <8% over the range of concentrations reported in this study.
In Centre 1 troponin I (TNI; Architect STAT High Sensitive Assay by Abbott, USA) and in Centre 2 troponin T (TNT; Elecsys Troponin T High Sensitive assay by Cobas, Roche Diagnostics, Switzerland) were measured. As no coefficient for conversion between the two types of troponins exists, we chose a priori to stratify patients in 10 groups based on deciles (TNI 1–10 and TNT 1–10) and combined the groups hereafter.
Ethics
Written informed consent was given by the patients. In patients not able to provide this (e.g. comatose cardiac arrest patients), consent was obtained by the patients’ next of kin and general practitioners in accordance with national legislation. The local ethics committee (Copenhagen) approved the study (Ref. H-2-2014-110).
Power calculation
Assuming an event rate of late CS of 3.2%, and a cut-off (123 pmol/l)17 assumed to be associated with a five-fold increase in relative risk of late CS, a sample size of at least 1700 patients would give us a power of 80%.
Statistics
Development of late CS was the primary outcome of interest. Dichotomous variables are presented as numbers (n) and percentages. Differences between groups were tested with the chi-square test. Continuous variables are presented as means with standard deviations (SDs), or median with 25th and 75th percentile as appropriate and analysed with one-way analysis of variance (ANOVA) or Kruskal-Wallis.
Comparisons of biomarker plasma concentrations between each CS stratification group (early CS/late CS) and no-CS patients were performed with the Mann-Whitney U test.
The associations between the biomarkers and late CS development were assessed adjusting for the recent established Observatoire Régional Breton sur l’Infarctus (ORBI) risk score for late CS prediction (age>70 years old, previous stroke/transient ischaemic attack (TIA), presentation as cardiac arrest, anterior MI, first medical contact to percutaneous intervention (PCI) delay>90 min, Killip Class on admission, heart rate>90/min on admission, sBP<125 mm Hg and pulse pressure (PP)<45 mm Hg on admission, glycaemia>10 mmol/l on admission, culprit lesion of the left main, post-PCI Thrombolysis in Myocardial Infarction (TIMI) flow<3).18 Biomarker concentrations were included in the models as continuous variables after logarithmic transformation (logarithm of two) to normalise the distributions.
The predictive values of the individual biomarkers for development of late CS were assessed as the area under the receiver-operating characteristic curve (AUC) in univariable analyses as well as in addition to the ORBI risk score. Comparison of AUCs was done using the method of DeLong et al.19 The optimal cut-off concentration for prediction of late CS was defined as the concentration with the highest combined sensitivity and specificity level based on the Youden index. Positive/negative predictive values and positive/negative likelihood ratios was calculated based on these cut-offs.
We performed separate analyses for the overall cohort and sensitivity analyses after exclusion of comatose cardiac arrest patients.
Statistical analyses were performed using SAS Enterprise software version 7.4 (SAS Institute, Cary, North Carolina, USA). A two-sided p-value <0.05 was considered significant throughout.
Results
During the enrolment period, a total of 2247 patients were enrolled in the study. Of these, 225 (10%) developed CS, whereof 161 (7%) developed early CS and 64 (3%) developed late CS.
In total, 355 patients (16%) had a final diagnosis other than STEMI. Depending on the biomarker, between 2085–2100 (93%) of the patients had biomarker concentrations available for analysis (Figure 1).

Flowchart showing patient recruitment. CAG: coronary angiography; MRproADM: mid-regional pro-adrenomedullin; proANP: pro-atrial natriuretic peptide; ST2: stimulation-2; STEMI: ST-elevation myocardial infarction.
Patients with and without CS
Baseline characteristics for patients with and without CS are shown in Table 1. Patients developing late CS were older and had more comorbidity compared to patients not developing CS. Late CS patients were less likely to be treated with platelet inhibitors in the ambulance. Upon admission, patients developing late CS had lower blood pressure and higher heart rate, lower LVEF, more severe coronary disease and higher troponin concentrations. The predictive value of admission troponin level for late CS development was AUC (95% confidence interval (CI)): 0.68 (0.61–0.74), p<0.0001.
Baseline characteristics.
| No CS | Late CS | p (Late CS vs no CS) | Early CS | |
|---|---|---|---|---|
| Number of patients, n | 2022 | 64 | 161 | |
| Sex (male), n (%) | 1459 (72) | 43 (67) | 0.38 | 116 (72) |
| Age, mean (SD) | 63 (13) | 69 (12) | 0.0002 | 65 (13) |
| Hypertension, n (%) | 872 (44) | 37 (59) | 0.02 | 91 (60) |
| Diabetes, n (%) | 278 (14) | 16 (26) | 0.09 | 24 (16) |
| Smoking, n (%) | 1383 (70) | 49 (82) | 0.009 | 102 (82) |
| Previous stroke/TIA | 138 (6.9) | 9 (15) | 0.06 | 14 (9.3) |
| Body mass index, mean (SD) | 27 (5) | 26 (5) | 0.50 | 26 (5) |
| Known heart failure, n (%) | 67 (3.3) | 6 (9.4) | 0.01 | 14 (8.7) |
| Known ischaemic heart disease, n (%) | 312 (15) | 16 (25) | 0.04 | 33 (21) |
| Known kidney dysfunction, n (%) | 94 (4.7) | 6 (9.4) | 0.09 | 6 (3.7) |
| Admission findings | ||||
| Time from symptom debut to ECG recording, min: median (25th; 75th percentile) | 47 (29; 132) | 104 (37; 810) | 0.26 | 93 (44; 252) |
| Time from ECG recording to acute CAG, min; median (25th; 75th percentile) | 85 (67; 115.5) | 92 (74; 144) | 0.08 | 97 (70; 133) |
| STEMI localisation (ECG) | ||||
| Anterior, n (%) | 764 (42) | 35 (65) | 0.007 | 48 (48) |
| Inferior/posterior, n (%) | 946 (52) | 17 (31) | 45 (45) | |
| Lateral, n (%) | 69 (3.8) | 2 (3.7) | 3 (3.0) | |
| LBBB, n (%) | 45 (2.5) | 0 (0.0) | 3 (3.0) | |
| Pre-hospital anticoagulants | ||||
| Aspirin, n (%) | 1915 (96) | 57 (90) | 0.04 | 111 (73) |
| ADP-receptor inhibitor n (%) | 1696 (85) | 44 (70) | 0.0009 | 72 (48) |
| Heparin, n (%) | 1740 (87) | 52 (83) | 0.27 | 108 (70) |
| Heart rate, mean (SD) | 78 (18) | 89 (24) | <0.0001 | 82 (25) |
| Systolic blood pressure, mean (SD) | 129 (25) | 114 (25) | <0.0001 | 92 (25) |
| Left ventricular ejection fraction, mean (SD) | 47 (11) | 30 (13) | <0.0001 | 31 (14) |
| Comatose cardiac arrest patients, n (%) | 71 (3.5) | 11 (17) | <0.0001 | 92 (57) |
| Number of vessels affected | ||||
| 0-vessel disease, n (%) | 287 (14) | 5 (7.9) | 0.007 | 9 (5.8) |
| 1-vessel disease, n (%) | 1108 (55) | 27 (43) | 54 (35) | |
| 2- vessel disease, n (%) | 388 (19) | 16 (25) | 44 (28) | |
| 3-vessel disease, n (%) | 235 (12) | 15 (24) | 48 (31) | |
| Primary PCI, n (%) | 1615 (80) | 45 (73) | 0.15 | 131 (81) |
| Culprit artery post-PCI TIMI flow | ||||
| 3 | 1489 (95) | 33 (83) | 0.0009 | 106 (88) |
| 2 | 46 (2.9) | 5 (13) | 9 (7.4) | |
| 0–1 | 28 (1.8) | 2 (5.0) | 6 (5.0) | |
| Troponin level (deciles), median (25th; 75th percentile) | 4.0 (2.0; 7.0) | 6.5 (4.5; 8.0) | <0.0001 | 5.5 (3.0; 9.0) |
ADP: adenosine di-phosphate; CAG: coronary angiography; CS: cardiogenic shock; ECG: electrocardiogram; LBBB: left bundle branch block; PCI: percutaneous intervention; SD: standard deviation; STEMI: ST-elevation myocardial infarction; TIA: transient ischaemic attack; TIMI: Thrombolysis in Myocardial Infarction.
Biomarker plasma concentration at hospital admission
Plasma concentrations of all four biomarkers were higher in patients with early and late CS compared to patients not developing CS (Table 2). This was also the case when comatose cardiac arrest patients were excluded (data not shown).
Hospital admission biomarker plasma concentration in patients with and without cardiogenic shock (CS).
| No CS | Late CSa | p (Late CS vs no CS) | Early CSb | p (Early CS vs no CS) | ||||
|---|---|---|---|---|---|---|---|---|
| ProANP (pmol/l), median (25th; 75th percentile) | 794 | (488; 1275) | 1666 | (1308; 2640) | p<0.0001 | 1995 | (1314; 3023) | p<0.0001 |
| Copeptin (pmol/l), median (25th; 75th percentile) | 55 | (15; 147) | 141 | (47; 301) | p<0.0001 | 444 | (195; 748) | p<0.0001 |
| MRproADM (nmol/l), median (25th; 75th percentile) | 0.71 | (0.58; 0.92) | 1.28 | (0.9; 1.83) | p<0.0001 | 1.05 | (0.72; 1.83) | p<0.0001 |
| ST2 (ng/ml), median (25th; 75th percentile) | 40 | (30; 57) | 73 | (45; 154) | p<0.0001 | 48 | (34; 96) | p<0.0001 |
MRproADM: mid-regional pro-adrenomedullin; proANP: pro-atrial natriuretic peptide; ST2: stimulation-2.
Late CS was defined as shock developed after leaving the catheterization laboratory.
Early CS was defined as shock developed at admission or in the catheterization laboratory.
Associations between biomarkers and CS
When stratifying patients in deciles by biomarker plasma concentration we found an increased risk of late CS development with increasing concentration of all four biomarkers (Figure 2).

Biomarker plasma concentration and risk of late cardiogenic shock (CS) development. Patients stratified by deciles of biomarker plasma concentration and percentage of patients developing late CS within each decile. MRproADM: mid-regional pro-adrenomedullin; proANP: pro-atrial natriuretic peptide; ST2: stimulation-2.
All four biomarkers were associated with both early and late CS development in univariable analyses (Table 2). A single point increase in ORBI risk score was associated with late CS development (odds ratio (OR) (95% CI): 1.39 (1.29–1.50), p<0.0001). In total, 1602 eligible patients (77%) had complete data for multivariable analyses including ORBI risk score and all four biomarkers. When adjusted for the ORBI risk score a two-fold increase in plasma concentrations of all four biomarkers remained independently associated with late CS development (OR range: 1.19–3.13) (Table 3). Except for copeptin, the biomarkers remained associated with late CS development when comatose cardiac arrest patients were excluded (data not shown).
Logistic regression models.
| Univariate | ORBI risk score adjustment | ||||||||
|---|---|---|---|---|---|---|---|---|---|
| Early CS | Late CS | ||||||||
| OR | 95% CI | p | OR | 95% CI | p | OR | 95% CI | p | |
| ProANP (pmol/l), per two-fold increase | 3.21 | (2.64– 3.91) | <0.0001 | 2.54 | (1.98–3.25) | <0.0001 | 1.82 | (1.34–2.48) | 0.0001 |
| Copeptin (pmol/l), per two-fold increase | 2.66 | (2.27–3.11) | <0.0001 | 1.33 | (1.15–1.52) | <0.0001 | 1.19 | (1.01–1.40) | 0.04 |
| MRproADM (nmol/l), per two-fold increase | 2.96 | (2.37–3.70) | <0.0001 | 4.16 | (3.04–5.69) | <0.0001 | 3.13 | (2.12–4.63) | <0.0001 |
| ST2 (ng/ml), per two-fold increase | 1.61 | (1.36–1.91) | <0.0001 | 2.40 | (1.94–2.97) | <0.0001 | 1.90 | (1.45–2.49) | <0.0001 |
CI: confidence interval; CS: cardiogenic shock; MRproADM: mid-regional pro-adrenomedullin; OR: odds ratio; ORBI: Observatoire Régional Breton sur l’Infarctus; PCI: percutaneous intervention; PP: pulse pressure; proANP: pro-atrial natriuretic peptide; sBP: systolic blood pressure; ST2: stimulation-2; TIA: transient ischaemic attack; TIMI: Thrombolysis in Myocardial Infarction.
Multivariable logistic regression models. The combination of age>70 years old, previous stroke/TIA, presentation as cardiac arrest, anterior myocardial infarction, first medical contact-to-PCI delay>90 min, Killip Class on admission, heart rate >90/min on admission, sBP<125 mm Hg and PP<45 mm Hg on admission, glycaemia>10 mmol/l on admission, culprit lesion of the left main, post-PCI TIMI flow<3 comprised the ORBI risk score.
All four biomarkers and the ORBI risk score had significant predictive value for late CS development in univariable analyses (Figure 3), irrespective of the exclusion of comatose cardiac arrest patients. We found the following optimal cut-off concentrations for the biomarkers for discrimination between late CS and no CS: proANP: 1307 pmol/l; copeptin: 138 pmol/l; MRproADM: 0.87 nmol/l; ST2: 52 ng/ml. When comatose cardiac arrest patients were excluded, the cut-off concentrations were: proANP: 1307 pmol/l; copeptin: 122 pmol/l; MRproADM: 1.01 nmol/l; ST2: 59 ng/ml. Only the combination of all four biomarkers significantly increased the predictive value for late CS when compared to MRproADM alone (AUC MRproADM: 0.82 vs MRproADM+proANP: 0.84, p=0.11; vs MRproADM+proANP+ST2: 0.85, p=0.08; vs MRproADM+proANP+ST2+copeptin: 0.86, p=0.03). When excluding comatose cardiac arrest patients, combining all four biomarkers no longer added significant predictive value of late CS development to the value of MRproADM alone (0.83 vs 0.87, p=0.08). All four biomarkers showed negative predictive value >0.97 and positive predictive value <0.1. The positive/negative likelihood ratio was between 2.0–3.17/0.24–0.63 (Table 4).
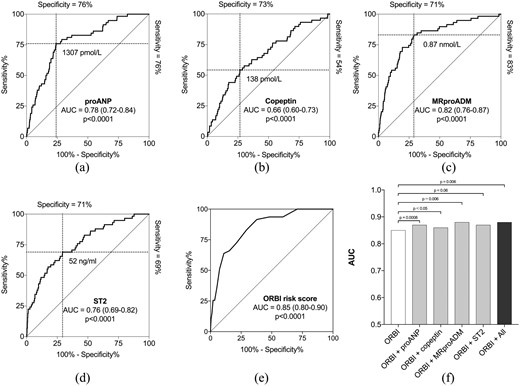
Prediction of late cardiogenic shock (CS) development. The area under the receiver-operating characteristic curve (AUC) representing the predictive value for admission plasma level of (a) pro-atrial natriuretic peptide (proANP), (b) copeptin, (c) mid-regional pro-adrenomedullin (MRproADM), (d) stimulation-2 (ST2), (e) the Observatoire Régional Breton sur l’Infarctus (ORBI) risk score and (f) the combination of the ORBI risk score and the four biomarkers for late CS development. Dashed lines represent sensitivity and specificity for optimal biomarker cut-off concentrations specified for each biomarker. Only proANP, copeptin and MRproADM added significant predictive information to the risk score.
Positive and negative predictive values and likelihood ratios.
| proANP (cut-off 1307 pmol/l) | Copeptin (cut-off 138 pmol/l) | MRproADM (cut-off 0.87 nmol/l) | ST2 (cut-off 52 ng/ml) | |
|---|---|---|---|---|
| Positive predictive value | 0.09 | 0.06 | 0.08 | 0.07 |
| Negative predictive value | 0.99 | 0.98 | 0.99 | 0.99 |
| Positive likelihood ratio | 3.17 | 2.0 | 2.86 | 2.38 |
| Negative likelihood ratio | 0.32 | 0.63 | 0.24 | 0.44 |
ANP: atrial natriuretic peptide; MRproADM: mid-regional pro-adrenomedullin; ST2: stimulation-2.
ProANP, copeptin and MRproADM added significant predictive information when added to the ORBI risk score, but not ST2 (Figure 3). The relationship between the observed and expected predicted value of late CS derived from the the ORBI risk score value and concentration of the four biomarkers is shown in Figure 4. Adding all four biomarkers to the ORBI risk score increased the predictive value significantly. We found no difference in the predictive value on late CS development between the ORBI risk score vs proANP (p=0.27) and MRproADM (p=0.55) alone. In patients with low ORBI risk score (≤10), we identified 18 and 19 patients, respectively, with proANP and MRproADM above cut-off, who developed late CS.

Calibration plots. The relationship between the observed and expected predicted value of late CS derived from the the ORBI risk score value and concentration of the four biomarkers. MRproADM: mid-regional pro-adrenomedullin; ORBI: Observatoire Régional Breton sur l’Infarctus; proANP: pro-atrial natriuretic peptide; ST2: stimulation-2.
When assessing admission biomarker plasma concentration in patients developing CS after hospital admission (CS developed in and after leaving the catheterization laboratory) as a sensitivity analysis, the association was unaltered (data not shown).
Discussion
In this prospective, observational cohort study, admission plasma concentrations of proANP, copeptin, MRproADM and ST2 were increased in patients with suspected STEMI that developed CS. All four biomarkers were associated with late CS development, but only MRproADM, proANP and copeptin were independent predictors for late CS development.
Despite a drastic decrease in the mortality of STEMI-patients throughout the past 40 years, the mortality in STEMI complicated by CS remains high,1,2 with CS being the most frequent cause of death within 30 days after admission.3 Approximately half of STEMI-patients developing CS are haemodynamically stable at admission, but develop CS within the next few days, which is in accordance with previous findings.2,15,20 Irrespective of shock onset, 30-day mortality is 40–50%2,15,20 and CS remains an unsolved clinical challenge. STEMI patients developing in-hospital cardiogenic shock are older and suffer more comorbidities2,15,20 and a greater level of coronary artery disease15 compared to uncomplicated patients. But despite this, patients developing in-hospital CS may be difficult to identify at hospital admission, since their haemodynamic status is somewhat similar to patients with uncomplicated admissions2,15 and lactate concentration is often normal.21
Besides progressive LV dysfunction, the pathophysiology of CS seems highly complex. The declining blood pressure leads to a neurohormonal5 mediated peripheral vasoconstriction which is counteracted within days by vasodilation due to inflammation and inappropriate nitric oxide production.4 Based on this, we hypothesised that biomarkers reflecting these processes could be elevated in patients in patients developing CS in their ‘pre-shock’ phase. Biomarkers reflecting these processes were selected based on previous studies showing that natriuretic peptides (NPs),6,7 copeptin,22,23 ST214 and MRproADM7,12 were higher in patients suffering from critical heart disease and associated with poor outcome. Our findings suggest that these processes are ongoing in patients at risk of developing late CS.
Recently, the ORBI risk score18 assessing prediction of late CS development in STEMI patients was established and validated in two French STEMI cohorts. In our cohort the risk score showed identical prediction of late CS development making it applicable in Denmark. Despite the good prediction of late CS development, the biomarkers added predictive value to the ORBI score. Interestingly, the prediction of late CS development was equally good for the ORBI risk score and proANP/MRproADM. Very early ’point-of-care’ biomarker assessment may in the future prove valuable for immediate risk stratification. However, although biomarker prediction of late CS development seems promising, the additive value to thorough clinical examination may be limited. In patients with low risk score but where the clinician may identify a patient as a ‘high-risk’ patient, biomarker measurements may prove valuable.
Clinical impact of findings
As mortality in patients with uncomplicated STEMI today is very low, more focus is drawn towards STEMI patients with cardiac arrest and CS where mortality remains high. CS is a continuum from being ‘at risk’ of CS to having fulminant circulatory collapse.24 As evidence-based mortality-reducing treatment options in patients with fulminant CS are limited25,26 and the majority of previous CS trials have been neutral,27,–29 patients at risk of CS development may serve as a population of increasing interest for future trials.
Patients with low ORBI risk score and/or low biomarker measurements may help identify those with little, if any, need of post-PCI intensive care unit (ICU) monitoring and treatment. This is in line with increasing focus on ICU utilization for STEMI patients from a recent North American study showing that only 16% of STEMI patients require ICU intervention.30
Patients with high ORBI risk score and/or biomarker concentration, should be monitored closely with haemodynamic measurements, urine output measurements and, for example, continuous lactate concentration assessment. If signs of haemodynamic deterioration should occur, early intervention with, for example, low-dose inotropes/inodilators or anti-inflammatory drugs may improve the outcome. This, however, is speculative. Risk stratification should be carried out as soon as possible (potentially already in the ambulance) as 50% of patients developing late CS do so within 12.5 h after hospital admission.15 The ongoing Accelerated Rule Out of Myocardial Infarction (AROMI) trial (ClinicalTrials.gov Identifier: NCT02666326) will provide more knowledge on very early biomarker risk stratification.
Limitations
In 7% of the patients, biomarker concentrations were not available. This may potentially lead to an over- or underestimation of the association between the biomarker plasma levels and CS development. In Denmark, the distance to the nearest tertiary heart centre is short and the vast majority of STEMI patients are treated with primary PCI. The data from this study may therefore not be applicable in STEMI populations more often treated with thrombolysis.
Conclusions
ProANP, copeptin, MRproADM and ST2 admission plasma levels were all associated with late CS development in patients admitted with suspected STEMI. Especially, admission proANP and MRproADM plasma concentrations were strong predictors for late CS development and added predictive value to the ORBI risk score. These biomarkers may be used for risk stratification in STEMI-patients.
The authors would like to acknowledge the dedicated work of the staff in the catheter laboratory, the coronary care unit and the intensive care unit at Odense University Hospital and Copenhagen University Hospital, Rigshospitalet. In addition, they greatly appreciate the dedicated work performed by technicians at the Section for External Projects at Department of Clinical Biochemistry, Rigshospitalet. The authors are grateful for the analytical work by expert technicians Marie Z Severinsen and Anne T Asanovski.
The authors declare that there is no conflict of interest.
The authors disclosed receipt of the following financial support for the research, authorship and/or publication of this article: This work was supported by Righospitalets Forskningsfond (grant number: 07IO), Forskningspuljen ml RH og OUH (grant number 13-A750, 25-A1365), The Danish Heart Foundation (Hjerteforeningen) (grant number A6024), and Hjertecentrets Forskningsudvalg, Rigshospitalet (no grant number).

Comments