


This study aimed to systematically identify and summarise all risk scores evaluated in the emergency department setting to stratify acute heart failure patients.
A systematic review of PubMed and Web of Science was conducted including all multicentre studies reporting the use of risk predictive models in emergency department acute heart failure patients. Exclusion criteria were: (a) non-original articles; (b) prognostic models without predictive purposes; and (c) risk models without consecutive patient inclusion or exclusively tested in patients admitted to a hospital ward. We identified 28 studies reporting findings on 19 scores: 13 were originally derived in the emergency department (eight exclusively using acute heart failure patients), and six in emergency department and hospitalised patients. The outcome most frequently predicted was 30-day mortality. The performance of the scores tended to be higher for outcomes occurring closer to the index acute heart failure event. The eight scores developed using acute heart failure patients only in the emergency department contained between 4–13 predictors (age, oxygen saturation and creatinine/urea included in six scores). Five scores (Emergency Heart Failure Mortality Risk Grade, Emergency Heart Failure Mortality Risk Grade 30 Day mortality ST depression, Epidemiology of Acute Heart Failure in Emergency department 3 Day, Acute Heart Failure Risk Score, and Multiple Estimation of risk based on Emergency department Spanish Score In patients with Acute Heart Failure) have been externally validated in the same country, and two (Emergency Heart Failure Mortality Risk Grade and Multiple Estimation of risk based on Emergency department Spanish Score In patients with Acute Heart Failure) further internationally validated. The c-statistic for Emergency Heart Failure Mortality Risk Grade to predict seven-day mortality was between 0.74–0.81 and for Multiple Estimation of risk based on Emergency department Spanish Score In patients with Acute Heart Failure to predict 30-day mortality was 0.80–0.84.
There are several scales for risk stratification of emergency department acute heart failure patients. Two of them are accurate, have been adequately validated and may be useful in clinical decision-making in the emergency department i.e. about whether to admit or discharge.
Introduction
Heart failure (HF) is a syndrome caused by many different cardiac problems. The natural history of HF is characterised by progressive decline in heart function and clinical status, episodes of acute decompensation leading to hospital admission, and premature death. Each episode of acute HF (AHF) increases the risk for further morbidity and mortality with 5–10% mortality during the 30 days following a decompensation.1,–3 In addition, the risk of a subsequent emergency department (ED) visit and rehospitalization is also high during the vulnerable period following an index hospitalization, since patients are not only recovering from their acute illness, but also experiencing a transient period of generalised risk for a wide range of adverse health events after hospital discharge.4 In AHF patients, the cause of rehospitalization within 30 days is attributable to further worsening of HF in only 16–37% of cases.5,,–8
Several attempts to improve survival by using new drugs in AHF patients have failed over recent decades.9,,–12 In this context, non-pharmacological strategies may improve clinical outcomes, such as the improvement in patient transition after hospital discharge,13,14 a multidisciplinary approach to frailty and dependence (present in more than 50% of AHF patients)2,15,,–18 and more adequate patient selection for hospitalization or discharge from ED, either directly or after a short time (usually <24 h) in an ED observation unit.19,20 In this regard, between one-sixth and one-third of AHF patients diagnosed at ED presentation are discharged home without hospitalization worldwide21 and these patients have poorer outcomes when compared with patients managed by admission to hospital.22,–24 The lack of risk stratification of AHF patients before ED decision-making has been identified as one of the reasons explaining the difference in clinical outcomes between directly discharged and hospitalised patients.25,26 Risk stratification is helping to make safer decisions in other highly prevalent, severe ED illnesses, and scores specifically developed for that use are available for pneumonia (Pneumonia Severity Index, CURB-65),27,28 acute coronary syndrome (GRACE, HEART)29,30 and sepsis (qSOFA and SOFA)31,32 Several scores achieving reliable risk stratification in patients with AHF have been reported during the last decade, though risk assessment seems not to be systematically performed as part of routine clinical practice. In addition, there were no recommendations in the last 2016 European Society of Cardiology (ESC) guidelines about risk stratification in ED decision-making.33 For this reason, we performed a systematic review with the following goals: (a) identify and classify risk prediction models based on their original derivation setting; (b) summarise how risk scores have been used through the identified publications; (c) compare the discriminative power among risk scores; and (d) describe the main characteristics of the scores specifically derived in the ED setting.
Material and methods
Protocol and eligibility criteria
We performed a systematic review of multicentre studies reporting the derivation and validation or use of risk prognostic scales predicting clinical outcomes in AHF patients in the ED setting. Methods and reporting follow the guidelines of Preferred Reporting Items for Systematic Reviews and Meta-Analyses (PRISMA).34 The protocol was registered in PROSPERO (CRD42020161897). To qualify for inclusion, multicentre studies had to include patients consecutively, though intermittent pre-specified periods of consecutive patient recruitment were also accepted. Exclusion criteria were: (a) studies not providing primary data (i.e. reviews); (b) studies including exclusively AHF hospitalised patients (i.e. studies not carried out in the ED, including hospitalised and discharged patients); and (c) prognostic models not aimed at predicting clinical outcomes (i.e. studies just describing the association between baseline factors and outcomes in terms of prognosis). Please note, the terms 'risk scale', 'risk score' and 'predictive model' are used interchangeably.
Data source and search strategy
Studies were identified by a search in PubMed and Web of Science databases from their inception to 31 December 2019. Only articles published in English, Spanish, German or French were included. A search for studies reporting predictive models (risk scores) concerning AHF patients attending the ED was conducted by reviewing both databases (PubMed and Web of Science) using the following text-word sequences: (‘acute heart failure’ or ‘acute decompensated heart failure’) and (‘emergency department’ or ‘emergency room’) and (‘risk stratification’ or ‘score’ or ‘scale’ or ‘prognostication’ or ‘prognosis’ or ‘prediction’ or ‘predictive’). Reference lists of the eligible reports were reviewed for any reports not captured initially. Similarly, reference lists in all editorials and reviews found through the search strategy described above were also reviewed.
Data extraction and synthesis of results
Citations were screened on the basis of title and abstract by two independent reviewers (OM and XR) and potentially eligible reports were subsequently retrieved, and the full text scrutinised for inclusion. A third investigator (FJMS) was involved in case of disagreement.
Findings in eligible studies are summarised in data tables. Individual items of data for each risk scale are presented, taking into account that such risk scales were classified into three main groups based on their primary origin: (a) scales originally derived in the ED setting using only AHF patients; (b) scales originally derived in the ED but using a broader patient population, not restricted to AHF patients; and (c) scales originally derived in ED admitted hospitalised AHF patients (and not including AHF patients discharged home from ED without hospitalization). Data extraction included: predicted outcomes, model performance, cohort characteristics and number of risk categories defined by the authors (emphasised in scales specifically derived in the ED and exclusively using AHF in the derivation process). A meta-analysis was not performed given the purpose of our research question, and the heterogeneity in study design, predicted outcomes, prognostic predictors and underlying populations.
Results
Among the 761 screened citations, 28 studies published over the last 10 years8,20,24,35,,,,,,,,,,,,,,,,,,,,,,,–59 met the inclusion criteria after full-text review (Figure 1). These 28 studies included 19 different risk models that had been used in AHF patients in the ED setting to predict clinical outcomes (Table 1). These 28 studies involved a wide range of sample sizes (between 507–68,380 subjects) and recruited from four different countries: Spain (19 studies), Canada (seven studies), Switzerland (one study) and the USA (one study). Table 2 provides detailed information about the 28 studies selected.

Study flow chart following Preferred Reporting Items for Systematic Reviews and Meta-Analyses (PRISMA) recommendations.
Summary of scales for risk stratification that has been tested in the emergency department (ED) in patients with a final diagnosis of acute heart failure (AHF) and classification based on their derivation setting.
| Acronym of the scale (full name and reference for the first time it was used in AHF patients in the ED setting) | First report using the scale in ED AHF patients | Place where the scale was originally derived | Patients used for scale derivation | Assessed risk | Number of studies published | |
|---|---|---|---|---|---|---|
| Derived in ED using AHF patients | ||||||
| 1 | Score reported by Lee et al.24 (Without acronym) | 2010 | ED | AHF patients | 7-Day mortality 30-Day mortality | 1 |
| 2 | EHMRG54 (Emergency Heart failure Mortality Risk Grade) | 2012 | ED | AHF patients | 7-Day mortality | 6 |
| 3 | EHMRG30-ST44 (Emergency Heart failure Mortality Risk Grade 30 Day mortality – ST depression) | 2014 | ED | AHF patients | 30-Day mortality | 2 |
| 4 | STRATIFY59 (Improving heart failure risk stratification in the emergency department) | 2015 | ED | AHF patients | 30-Day SAE | 1 |
| 5 | EAHFE-3D58 (Epidemiology of Acute Heart Failure in Emergency department – 3 day) | 2016 | ED | AHF patients | 3-Day mortality | 3 |
| 6 | OHFRS57 (Ottawa Heart Failure Risk Scale) | 2017 | ED | AHF patients | 30-/14-Day SAEs | 2 |
| 7 | AHFRS39 (Acute Heart Failure Risk Score) | 2017 | ED | AHF patients | ED/in-hospital/7-day SAEs | 1 |
| 8 | MEESSI-AHF38 (Multiple Estimation of risk based on Emergency department) | 2017 | ED | AHF patients | 30-day mortality | 12 |
| Derived in ED, but not using exclusively AHF patients | ||||||
| 1 | CTAS52 (Canadian Triage Acuity System) | 2011 | ED | General ED population | ED mortality 1-Day mortality 3-Day mortality 7-Day mortality 30-Day mortality | 1 |
| 2 | CTAS+age+sex52 (CTAS plus age plus sex) | 2011 | ED | General ED population+AHF patientsa | ED mortality 1-Day mortality 3-Day mortality 7-Day mortality 30-Day mortality | 1 |
| 3 | MTS53 (Manchester Triage System) | 2016 | ED | General ED population | Need of hospitalization In-hospital mortality 3-Day mortality 7-Day mortality 30-Day mortality 30-Day reconsultation | 1 |
| 4 | MAT-SET53 (Triage Andorran Model – Triage Spanish System) | 2016 | ED | General ED population | Need of hospitalization In-hospital mortality 3-Day mortality 7-Day mortality 30-Day mortality 30-Day reconsultation | 1 |
| 5 | ISAR49 (Identification of Seniors At Risk) | 2020 | ED | ED discharged elders (≥65 years) | 30-Day mortality | 1 |
| Derived using AHF patients, but not in the ED | ||||||
| 1 | EFFECT-HF54 (Enhanced Feedback For Effective Cardiac Treatment – Heart Failure) | 2012 | Hospital wards | AHF patients | 30-Day mortality | 5 |
| 2 | BI-EFFECT55 (Bathel Index plus EFFECT) | 2012 | Hospital wards+EDb | AHF patients | 30-Day mortality | 2 |
| 3 | FBI-EFFECT35 (Frailty plus Bathel Index plus EFFECT) | 2017 | Hospital wards+EDb | AHF patients | 30-Day mortality | 1 |
| 4 | GWTG-HS39 (Go With The Guidelines Heart Failure) | 2017 | Hospital wards | AHF patients | ED/in-hospital/7-day SAE | 2 |
| 5 | BWH39 (Brigham and Women’s Hospital) | 2017 | Hospital wards | AHF patients | ED/in-hospital/7-day SAE | 1 |
| 6 | ADHERE39 (Acute Decompensated Heart Failure National Registry) | 2017 | Hospital wards | AHF patients | ED/in-hospital/7-day SAE | 1 |
SAE: serious adverse event.
Scale based on previous scale derived in general ED population and therefore slightly modified and tested in patients with AHF
Scale based on a previous scale derived in AHF hospitalised patients and slightly modified by adding some new variables in ED patients.
Main characteristics of the studies included in this systematic review; ordered by year of publication.
| Authorref. (year) | Patients (country) | Acronym of the scale used in the study (role) | Usefulness of the scale in the study | Main findings (related to scales) |
|---|---|---|---|---|
| Lee et al.24 (2010) | 50,816 (Canada) | Acronymless (used to assess outcomes between discharged and hospitalised patients at comparable risk) | To find predictors of 7-day and 30-day mortality To compare outcomes (90-day mortality) between discharged and hospitalised patients with comparable 7-day and 30-day mortality risk | 90-Day mortality in discharged patients were significantly higher than in hospitalised patients either, groups paired by 7-day mortality risk and 30-day mortality risk A model was built up for 7-day mortality prediction containing 7 variables (age, sex, arrival with paramedics, number of previous AHF admissions, dementia, metastatic cancer, length of stay in ED) A model was built up for 30-day mortality prediction containing 12 variables (the 7 of the 7-day model plus triage code, valvular and rheumatic heart disease, peripheral vascular disease, respiratory disease, renal disease) The c-statistic of the 7-day/30-day models was 0.806/0.755 |
| Van Spall et al.52 (2011) | 63,380 (Canada) | CTAS/CTAS+age+sex (assessment of a generic triage scale applied to AHF) | To evaluate the CTAS (the Canadian scale used to triage patients at ED arrival) capacity to predict ED, 1-day, 7-day and 30-day mortality, alone and in combination in a multivariate model including sex/age | The c-statistic of the CTAS for ED/1-day/7-day/30-day mortality was 0.82/0.72/0.68/0.65 The c-statistic of the CTAS+age+sex for ED/1-day/7-day/30-day mortality was 0.88/0.81/0.75/0.71, all of these significantly better than those obtained with CTAS. |
| Lee et al.54 (2012) | 12,591 (Canada) | EHMRG (original derivation/validation study) EFFECT-HF (used as comparator) | To derive a tool to identify ED patients at low risk of 7-day mortality To compare with EFFECT-HF | A scale was built up containing 10 variables (age, transported by emergency medical system, SBP, heart rate, O2-sat, creatinine, potassium, troponin, active cancer, metolazone at home) The c-statistics for derivation/validation cohorts were 0.807/0.803, significantly higher than c-statistic of EFFECT-HF scale (0.755) |
| Martín-Sánchez et al.55 (2012) | 1068 (Spain) | BI-EFFECT (evolution of the EFFECT-HF scale, previously developed in hospitalised patients to predict 30-day mortality) EFFECT-HF (used as comparator) | To assess the performance of the EFFECT-HF scale in aged AHF patients at ED To check whether the addition of disability (measured thorough the Barthel Index) improves the EFFECT-HF scale performance | The c-statistic of the EFFECT-HF scale was 0.69 The c-statistic of the BI-EFFECT scale was 0.75, significantly higher than EFFECT-HF |
| Stiell et al.57 (2013) | 559 (Canada) | OHFRS (original derivation/internal validation study) | To derive a scale to predict serious adverse events (30-day death, or 14-day intubation, admission to monitored unit, myocardial infraction, major procedure or relapse requiring admission) | A scale was built up containing 10 variables (NT-proBNP, history of stroke or TIA, prior intubation, ischemic changes in ECG, heart rate, O2-sat, troponin, urea, serum CO2, heart rate) The c-statistic for derivation/internal validation cohorts was 0.774/0.77 |
| Greig et al.56 (2014) | 8772 (Canada) | EHMRG30-ST (evolution of the previously derived and validated EHMRG scale) EHMRG (used as comparator) | To derive a new scale on the basis of the variables included in the previous EHMRG scale (which predicts 7-day mortality) plus significant findings in ECG to predict 30-day mortality | The EHMRG30-ST scale was built up containing the 10 variables included in the EHMRG scale (age, transported by emergency medical system, SBP, heart rate, O2-sat, creatinine, potassium, troponin, active cancer, metolazone at home) plus ST-depression in the ECG The c-statistic of the EHMRG30-ST for 30-day mortality prediction was 0.801 The c-statistic of the EHMRG for 7-day mortality prediction was 0.801 |
| Collins et al.59 (2015) | 1033 (USA) | STRATIFY (original derivation study) | To derive a tool to identify ED patients at low risk of 30-day adverse events | A scale was built up containing 13 variables (age, body mass index, BNP, diastolic blood pressure, BUN, sodium, respiratory rate, O2-sat, troponin I, dialysis, on supplemental oxygen, ACEI at home, QRS duration) The c-statistic was 0.68 |
| Miró et al.53 (2016) | 3837 (Spain) | MTS (assessment of a generic triage scale applied to AHF) MAT-SET (assessment of a generic triage scale applied to AHF) | To evaluate how well discriminate different adverse outcomes in patients with AHF in ED two different generic triage scales. To compare discriminative capacity of both triage scales | The c-statistic of MTS/MAT-SET for need of hospitalization was 0.619/0.639 The c-statistic of MTS/MAT-SET for in-hospital mortality was 0.574/0.588 The c-statistic of MTS/MAT-SET for 3-day mortality was 0.661/0.632 The c-statistic of MTS/MAT-SET for 7-day mortality was 0.602/0.592 The c-statistic of MTS/MAT-SET for 30-day mortality was 0.578/0.567 The c-statistic of MTS/MAT-SET for 30-day post-discharge reconsultation was 0.535/0.458 There were no statistical significant differences for any comparison except to 30-day post-discharge reconsultation |
| Jacob et al.58 (2016) | 6597 (Spain) | EAHFE-3D (original derivation/validation study) | To derive a tool to identify ED patients at high risk of 3-day mortality | A scale was built up containing 7 variables (age, NYHA class at baseline, SBP, O2-sat, sodium, use of inotropes/vasopressors in ED, use of non-invasive ventilation at ED) The c-statistic for derivation/validation cohorts were 0.80/0.76 |
| Stiell et al.37 (2017) | 1100 (Canada) | OHFRS (validation in a new cohort, assessment of accuracy, acceptability and potential impact) | To evaluate the accuracy, acceptability and potential impact of the use of the OHFRS | Successful validation (no c-statistic provided) 59.2%/40.8% Of cases matching/mismatching the OHFRS and EP estimated risk category 11.9% Of EPs indicated they would be uncomfortable or very uncomfortable in using OHFRS to make disposition decisions in patients with AHF |
| Miró et al.38 (2017) | 8096 (Spain) | MEESSI-AHF (original derivation/validation study) EHMRG (used as comparator) | To derive a tool to stratify risk of 30-day mortality in ED patients To compare performance of MEESSI-AHF and EHMRG scales to predict 30-day mortality | A scale was built up containing 13 variables (Barthel Index at ED admission, SBP, age, NT-proBNP, potassium, troponin, NYHA class at ED admission, respiratory rate, low-output symptoms, episode associated with ACS, hypertrophy on ECG, creatinine) The c-statistic in derivation/validation cohorts was 0.836/0.828 The c-statistic for 30-day mortality prediction of the MEESSI-AHF/EHMRG scales using a subset of 2,137 patients with enough data to get both scales applied was 0.830/0.750 |
| García-Gutiérrez et al.39 (2017) | 1824 (Spain) | AHFRS (original derivation/validation study) BWH/ADHERE/GWTG-HS/EAHFE-3D/EHMRG (used as comparators) | To derive a tool to stratify risk of SAE during ED stay, hospitalization or the 7 following days after ED discharge | A scale was built up containing 4 variables (oedema in chest x-ray, visits to ED and hospitalizations during previous 2 years, glycaemia, and BUN) The c-statistic for derivation/validation cohorts were 0.83/0.82 The c-statistic in this cohort for BWH/ADHERE/GWTG-HS/EAHFE-3D/EHMRG was 0.73/0.69/0.70/0.695/0.79 |
| Martín-Sánchez et al.35 (2017) | 596 (Spain) | FBI-EFFECT (evolution of the EFFECT-HF scale, previously developed in hospitalised patients to predict 30-day mortality) EFFECT-HF/BI-EFFECT (used as comparators) | To assess whether the addition of frailty (measured through Fried modified criteria) and disability (measured thorough the Barthel Index) improves a previously developed scale (in hospitalised patients) when applied to patients with AHF in the ED | The c-statistics of the EFFECT-HF scale was 0.64 The c-statistic of the BI-EFFECT scale (EFFECT-HF plus disability) was 0.72 The c-statistic of the FBI-EFFECT scale (EFFECT-HF plus disability plus frailty) was 0.76 The FBI-EFFECT scale has a significantly higher discriminatory capacity of 30-day mortality than EFFECT-HF and BI-EFFECT scales |
| García-Gutiérrez et al.51 (2018) | 717 (Spain) | EAHFE-3D (validation in a new cohort) | To validate EAHFE-3D in a new cohort (hospitals that not participated in the original derivation study) | The c-statistic was 0.76 Calibration was not good |
| Gil et al.40 (2018) | 1553 (Spain) | EHMRG (validation in a new cohort) | To externally validate the EHMRG scale (derived in patients attended at Canada EDs) in a new cohort of patients recruited in Spanish EDs | The c-statistic was 0.741, and some sensitivity analysis did not improve this value. Risk stratification improved with recalibration in the Spanish cohort The EHMRG performance was not as good as in the derivation/validation cohorts reported in the original study (c-statistics of 0.807/0.804) |
| Miró et al.20 (2019) | 7960 (Spain) | MEESSI-AHF (analysis of ED patients with AHF according to the scale classification) | To compare distribution of MEESSI-AHF risk categories between hospitalised and discharged patients To assess how well EP disposition subjective decisions match with objective MEESSI-AHF risk categories To compare outcomes in every MEESSI-AHF risk category between discharged/hospitalised patients | Risk among discharged/hospitalised patients: Low-risk: 47.6%/33.5% Intermediate: 37.1%/43.5% High/very-high: 10.5%/23.0% Current subjective disposition decisions of EPs correlate with MEESSI-AHF risk categories. OR for being hospitalised according risk category: 1 for low (reference), 1.83 for intermediate, 3.05 for high, and 3.98 for very high. Patients in all MEESSI-AHF risk categories are at increased risk of post-discharge return event if they were directly discharged from ED, whereas mortality did not differ by disposition in any risk group. |
| Martín-Sánchez et al.36 (2019) | 749 (Spain) | MEESSI-AHF (used for adjustment) | None specific | None |
| Wussler et al.41 (2019) | 1572 (Switzerland) | MEESSI-AHF (external validation of the scale) EHMRG (used as comparator) | To externally validate the MEESSI-AHF scale in a different country where it was initially derived and validated | External validation of the MEESSI-AHF scale showed excellent discrimination (c-statistic: 0.80) Recalibration may be needed when the scale is introduced in new populations. The c-statistic for 30-day mortality prediction of the MEESSI-AHF/EHMRG scales using a subset of 849 patients with enough data to get both scales applied was 0.822/0.765 |
| Rossello et al.42 (2019) | 9098 (Spain) | MEESSI-AHF (create different categories based on the scale to analyse the results of the study) | To assess the value of the Barthel Index at ED arrival in predicting 30-day mortality risk in AHF patients | Barthel Index assessed at the ED arrival is a strong independent predictor of 30-day mortality, better than baseline Barthel Index, and these results were achieved using MEESSI-AHF for adjustment by severity of decompensation |
| Miró et al.50 (2019) | 1028 (Spain) | MEESSI-AHF (analyse outcomes of low-risk patients discharged home from ED) | To determine the rate of adverse events in low risk AHF patients discharged home To analyse the ability of the MEESSI-AHF to predict adverse events in this population | Rates of 30-day all-cause mortality 1.6%; rate of 7-day ED revisits due to AHF 8.0%; rate of 30-day hospitalization due to AHF 24.7% The c-statistic for discrimination of 30-day mortality, 7-day ED revisit due to AHF and 30-day hospitalization due to AHF were 0.69, 0.56 and 0.54, respectively |
| Lee et al.44 (2019) | 1983 (Canada) | EHMRG30-ST (evolution of the previously derived and validated EHMRG scale) EHMRG (used as comparator) | To validate the previously-derived EHMRG for 7-day mortality prediction To derive a modified scale (EHMRG30-ST) for 30-day mortality prediction To compare scales with EPs estimates To check EP decisions compared with risk stratification provided by EHMRG. | The c-statistic for EPs risk estimation was 0.71 The c-statistic for EHMRG for 7-day mortality was 0.81 The c-statistic for EPs risk estimation+EHMRG was 0.82 The c-statistic for EHMRG30-ST for 30-day mortality was 0.77 The c-statistic for EPs estimation+EHMRG30-ST was 0.78 79.2%/20.1% Planned for hospitalization/discharge; 79.2%/20.8% finally hospitalised/discharged 63.7% Of low/very-low risk patients were finally hospitalised 54.4% Of discharged patients were at intermediate/high/very-high risk according to EHMRG scale |
| Miró et al.43 (2019) | 4711 (Spain) | MEESSI-AHF (validation in a new cohort) | To validate MEESSI-AHF in a new cohort To compare its performance in different settings | The c-statistic was 0.810 Similar values (no significant differences) were found for university/community hospitals; ED with high/medium/low census; hospitals that participated/not participated in the MEESSI-AHF scale derivation. |
| Miró et al.8 (2019) | 505 (Spain) | MEESSI-AHF (used to measure severity of decompensation) | None specific | None |
| Miró et al.47 (2019) | 11,356 (Spain) | MEESSI-AHF/GWTG-HS (used for stratified analysis) | None specific | None |
| Rossello et al.48 (2019) | 9999 (Spain) | MEESSI-AHF (used for outcomes adjustment) | None specific | None |
| Miró et al.45 (2019) | 6727 (Spain) | MEESSI-AHF (used to measure severity of decompensation and for outcomes adjustment) | None specific | None |
| Miró et al.46 (2019) | 8563 (Spain) | MEESSI-AHF/EFFECT-HF (used to measure severity of decompensation and for outcomes adjustment) | None specific | None |
| Martín-Sánchez et al.49 (2020) | 1059 (Spain) | Senior at Risk (assessment of a scale not-specifically derived for AHF patients) EFFECT-HF (used for stratified analysis) | To check discriminatory capacity of the scale Senior at Risk to predict 30-day mortality among patients over 65 years | The c-statistic was 0.703 |
ACS: acute coronary syndrome; ADHERE: Acute Decompensated Heart Failure National Registry; AHF: acute heart failure; AHFRS: Acute Heart Failure Risk Score; BI-EFFECT: Bathel Index plus EFFECT; BWH: Brigham and Women’s Hospital; CTAS: Canadian Triage Acuity System; EAHFE-3D: Epidemiology of Acute Heart Failure in Emergency department – 3 day; ECG: electrocardiogram; ED: emergency department; EFFECT-HF: Enhanced Feedback For Effective Cardiac Treatment – Heart Failure; EHMRG: Emergency Heart failure Mortality Risk Grade; EHMRG30-ST: Emergency Heart failure Mortality Risk Grade 30 Day mortality – ST depression; EP: emergency physician; FBI-EFFECT: Frailty plus Barthel Index plus EFFECT; GWTG-HS: Go With The Guidelines Heart Failure; ISAR: Identification of Seniors At Risk; MAT-SET: Triage Andorran Model – Triage Spanish System; MEESSI-AHF: Multiple Estimation of risk based on Emergency department Spanish Score In patients with Acute Heart Failure; MTS: Manchester Triage System; O2-sat: arterial oxygen saturation; OHFRS: Ottawa Heart Failure Risk Scale; SBP: systolic blood pressure; STRATIFY: Improving heart failure risk stratification in the emergency department; TIA: transitory ischemic attack.
Identification and classification of risk prediction models based on their derivation setting
Among the 19 scales used in the ED setting, 13 were derived in the ED, though only eight of them exclusively used AHF patients in their primary derivation cohort. These eight risk predictive models were: (a) a study published by Lee et al.24, (b) Emergency Heart Failure Mortality Risk Grade (EHMRG), (c) EHMRG 30 Day mortality ST depression (EHMRG30-ST), (d) Ottawa Heart Failure Risk Scale (OHFRS), (e) Improving heart failure risk stratification in the emergency department (STRATIFY), (f) Epidemiology of Acute Heart Failure in Emergency department 3 Day (EAHFE-3D), (g) Acute Heart Failure Risk Score (AHFRS) and (h) Multiple Estimation of risk based on Emergency department Spanish Score In patients with Acute Heart Failure (MEESSI-AHF). The first four risk models were derived from Canadian subjects, whereas STRATIFY was derived from a US cohort, and the last three risk scores were obtained in Spain. The other five scales were derived in the ED and used a broader patient cohort beyond AHF subjects. Of these, four are primary or adapted triage scales (i.e. they are triage systems used in EDs, typically by nurses, when patients first check in and prior to any testing performed or therapy given): (a) Canadian Triage Acuity Scale (CTAS), (b) CTAS adding age and sex, (c) Manchester Triage System (MTS), and (d) Triage Andorran Model - Triage Spanish System (MAT-SET). The other risk score of this category, Identification of Seniors at Risk (ISAR), was primarily designed to identify of frailty in patients 65 years or older.
The remaining six risk prediction models have been derived in the hospital setting using AHF hospitalised patients: (a) Enhanced Feedback for Effective Cardiac Treatment in Heart Failure (EFFECT-HF), (b) BI-EFFECT, produced by adding the Barthel Index to the previous model, (c) FBI-EFFECT, produced by adding Physical Frailty to the former model, (d) Go With The Guidelines Heart Failure (GWTG-HF),60 (e) Brigham and Women’s Hospital (BWH)61 and (f) Acute Decompensated Heart Failure National Registry (ADHERE).62
How risk scores have been used in the 28 identified publications
The main findings of the 28 studies meeting the eligibility criteria and using at least one of the 19 risk prognostic models described above are detailed in Table 2. The number of publications per scale varied substantially: most of them had a single primary publication (i.e. deviation study), whereas four scales were used in two different studies (EHMRG30-ST, OHFRS, BI-EFFECT, GWTG-HF) and four scales were used in more than two studies: the EAHFE-3D (three publications), EFFECT-HF (five), EHMRG (six) and MEESSI-AHF (12) (Table 1). The main goal of the majority of studies was to report the risk scale derivation and/or validation, either in their primary publication or in subsequent studies using validation cohorts. Many of these studies provided data on model performances, such as the c-statistic to evaluate discrimination (summarised in Figure 2).
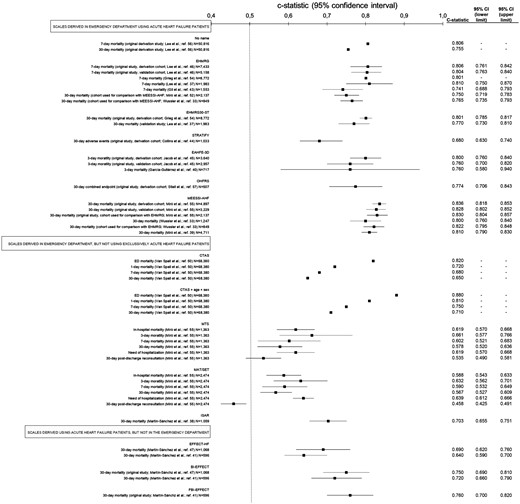
Summary of c-statistics (estimate for discrimination) for each scale used for risk stratification in patients with acute heart failure (AHF) in the emergency department (ED), classified by the setting where scales were initially derived and what kind of patients were used for the derivation.
The absence of some 95% confidence intervals for c-statistics mean that they were not originally reported by the authors. ADHERE: Acute Decompensated Heart Failure National Registry; AHFRS: Acute Heart Failure Risk Score; BI-EFFECT: Bathel Index plus EFFECT; BWH: Brigham and Women’s Hospital; CTAS: Canadian Triage Acuity System; EAHFE-3D: Epidemiology of Acute Heart Failure in Emergency department – 3 day; EFFECT-HF: Enhanced Feedback For Effective Cardiac Treatment – Heart Failure; EHMRG: Emergency Heart failure Mortality Risk Grade; EHMRG30-ST: Emergency Heart Failure Mortality Risk Grade 30 Day mortality – ST depression; FBI-EFFECT: Frailty plus Barthel Index plus EFFECT; GWTG-HS: Go With The Guidelines Heart Failure; ISAR: Identification of Seniors At Risk; MAT-SET: Triage Andorran Model – Triage Spanish System; MEESSI-AHF: Multiple Estimation of risk based on Emergency department Spanish Score In patients with Acute Heart Failure; MTS: Manchester Triage System; OHFRS: Ottawa Heart Failure Risk Scale; SAE: severe adverse event; STRATIFY: Improving heart failure risk stratification in the emergency department.
Aside from model derivation, validation or performance, several studies defined specific risk categories based on cut-offs obtained from their prognostic models and provided the expected outcome rates for every risk category (EFFECT-HF, BI-EFFECT, FBI-EFFECT, ADHERE, OHFRS, STRATIFY, EAHFE-3D, EHMRG, EHMRG30-ST, AHFRS, MEESSI-AHF).20,35,39,54,,,,–59,62 In addition, nine studies used at least one risk score to define the severity of AHF decompensation, to produce subgroups of patients based on their risk or to adjust in multivariate regressions (to reduce the impact of confounding factors).8,24,36,45,,,,–50 In one of them, the comparison between discharged and hospitalised patients at similar predicted risk (using the risk model developed by Lee et al.)24 demonstrated a higher 90-day mortality for patients discharged home from the ED. Higher percentages of 30-day post-discharge ED visit and hospitalization were also observed for ED discharged patients in every MEESSI-AHF risk category, but not in 30-day post-discharge mortality.20 Another study addressed specifically the subset of patients classified as low risk by the MEESSI-AHF scale that were discharged home from the ED and found a lower discriminative ability to predict 30-day mortality for the risk score in this subgroup of patients (c-statistic of 0.69) than in the primary publication for the MEESSI-AHF risk score (c-statistic between 0.80 and 0.84).50 Additionally, the scale was not useful to predict seven-day post-discharge ED visit and 30-day hospitalization in this particular subset of patients (c-statistic of 0.56 and 0.54, respectively).50
The level of agreement between clinical judgment and risk score assessment has been evaluated in several publications. Using the OHFRS scale, a 40.8% of mismatch was reported between risk categories assigned by the emergency physicians vs the OHFRS scale.37 A similar mismatch between the emergency physicians’ subjective decisions to hospitalise patients and objective patient risk stratification has been reported in two additional studies: 47.6% and 54.4% of AHF patients discharged home from the ED were classified as being at intermediate/high/very-high risk by the MEESSI-AHF and EHMRG scales, respectively, whereas 66.1% and 63.7% of patients classified as low/very-low risk were hospitalised.20,44 The recent ACUTE study has demonstrated that EHMRG risk scores add value in terms of discrimination to an exclusive emergency physician subjective assessment, improving the discrimination from 0.71 achieved by the sole physician estimation to 0.82 when to EHMRG score was added on top.44 In this setting, the authors reported that the net reclassification improvement was 0.763 when the EHMRG was used continuously (risk-category-free approach) and 0.820 when using the categories provided by the EHMRG score. In fact, this was the only study which showed improved net reclassification, with the rest of the studies just reporting calibration using the Hosmer-Lemershow statistic or graphical approaches. In most of these assessments, prediction was better in the low-risk than in the high-risk patients. Importantly, none of the 28 studies included in our systematic review reported findings regarding a prospective use of risk scores nor evaluated their impact on clinical outcomes.
Predicted outcomes and between-scores comparisons for model performance in terms of discrimination
The predicted outcome most frequently used was 30-day mortality, which was used by 12 of 19 scales. A variety of other outcomes have also been used, including prediction of mortality in shorter periods, serious adverse events (SAEs), need of hospitalization, and post-discharge ED visit after the AHF index event (Table 1). The discriminative power of risk scores in unselected AHF populations tended to be higher when the outcomes of interest occurred closer to the time of the index AHF (c-statistic from 0.82 to 0.86 to predict ED mortality, Figure 3). Eleven studies reported comparisons among different risk scales using the same sample of patients. In this sense, CTAS+age+sex had a significantly higher discriminative capacity than CTAS for all the assessed outcomes;52 MTS and MAT-SET had comparable performance in outcomes prediction;53 BI-EFFECT was better than EFFECT-HF, and FBI-EFFECT better than both, in predicting 30-day mortality;35,55 EHMRG was better than EFFECT-HF in predicting seven-day mortality;54 AHFRS provided clearly better estimations than BWH, ADHERE, GWTG-HS and EAHFE-3D, and was similar to EHMRG in predicting short-term SAE (although no p value for any of these comparisons was provided);39 EHMRG30-ST had comparable performance in predicting 30-day mortality to EHMRG in predicting seven-day mortality in two studies;44,56 and MEESSI-AHF was better than EHMRG in predicting 30-day mortality in two studies.38,41 However, it has to be taken into account that many of these comparisons can be considered ‘unfair’, as they were performed in cohorts used for derivation of one of the compared scales, used outcomes different from those evaluated in original derivation in some of the compared scales, or were run in countries where one of the scales under comparison was derived. Therefore, objective comparisons using independent and new multinational populations are still lacking.
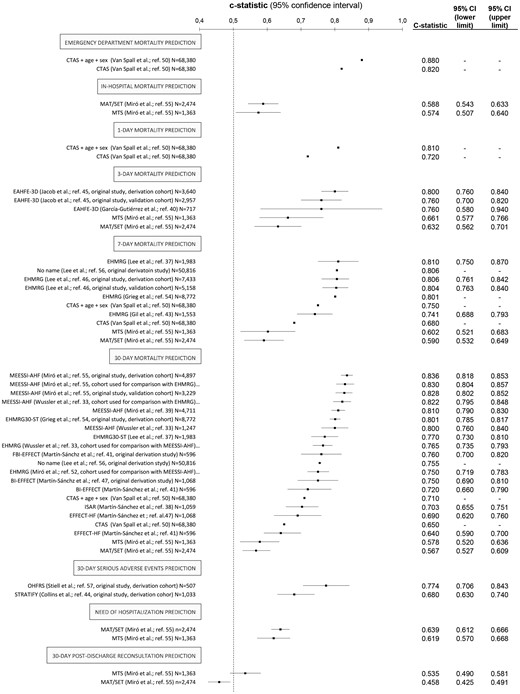
Summary of the discrimination capacity (expressed as c-statistics) of scales for risk stratification that have been tested in patients with acute heart failure (AHF) in the emergency department (ED), grouped by the predicted outcome used for risk stratification. The absence of some 95% confidence intervals for c-statistics mean that they were not originally reported by the authors. ADHERE: Acute Decompensated Heart Failure National Registry; AHFRS: Acute Heart Failure Risk Score; BI-EFFECT: Bathel Index plus EFFECT; BWH: Brigham and Women’s Hospital; CTAS: Canadian Triage Acuity System; EAHFE-3D: Epidemiology of Acute Heart Failure in Emergency department – 3 day; EFFECT-HF: Enhanced Feedback For Effective Cardiac Treatment – Heart Failure; EHMRG: Emergency Heart failure Mortality Risk Grade; EHMRG30-ST: Emergency Heart failure Mortality Risk Grade 30 Day mortality – ST depression; FBI-EFFECT: Frailty plus Barthel Index plus EFFECT; GWTG-HS: Go With The Guidelines Heart Failure; ISAR: Identification of Seniors At Risk; MAT-SET: Triage Andorran Model – Triage Spanish System; MEESSI-AHF: Multiple Estimation of risk based on Emergency department Spanish Score In patients with Acute Heart Failure; MTS: Manchester Triage System; OHFRS: Ottawa Heart Failure Risk Scale; SAE: severe adverse event; STRATIFY: Improving heart failure risk stratification in the emergency department.
Description of the main characteristics of the scales specifically derived in the ED setting
The main methodological characteristics of the eight scales specifically derived at ED presentation, and using exclusively AHF patients for their derivation, are summarised in Table 3 (acronymless, STRATIFY, AHFRS, OHFRS, EHMRG30-ST, EAHFE-3D, EHMRG and MEESSI-AHF). Each risk prognostic model contained between 4–13 predictors, the most frequently used being age, oxygen saturation and creatinine/urea (each one in six scales), as well as blood pressure and troponin (each one in five) (Figure 4). Remarkably, none of them included left ventricular ejection fraction (estimated in the ED or during the previous weeks/months) as a predictive variable. All but one scale (the acronymless one) provided clinical risk categories specifically identifying groups of patients as at low risk of adverse event. Only four of these scales were externally validated in the original studies (EHMRG, EAHFE-3D, AHFRS and MEESSI-AHF), and only two have been validated in countries other than where they were originally derived (EHMRG in Spain and Switzerland; and MEESSI-AHF in Switzerland). Both EHMRG and MEESSI-AHF scales used the Framingham criteria for patient inclusion, whereas exclusion criteria were wider in the former. These two scales provided good to very good discriminative capacity (c-statistic between 0.74 and 0.81 for EHMRG to predict seven-day mortality, and 0.80 and 0.84 for MEESSI-AHF to predict 30-day mortality) and have suggested cut-off values for patient categorization according to their underlying risk. In both scales, the 40% of patients placed in the lowest risk categories reported a low estimated risk of adverse events: 0.3% of seven-day mortality for the EHMRG, and 2.0% of 30-day mortality for the MEESSI-AHF.
Characteristics of the risk stratification scales derived in the emergency department (ED) using exclusively patients with acute heart failure (AHF); ranked vertically by the number of studies that have provided data using each scale.
| Acronymless24 (Lee et al.) | STRATIFY59 | AHFRS39 | OHFRS37 | EHMRG30-ST44 | EAHFE-3D58 | EHMRG54 | MEESSI-AHF38 | |
|---|---|---|---|---|---|---|---|---|
| n Studies performed with the scale | 1 | 1 | 1 | 2 | 2 | 3 | 6 | 12 |
| n Hospitals in the derivation study | Multicentric (not specified) | 4 | 3 | 6 | Multicentric (not specified) | 34 | 86 | 34 |
| n Variables included in the score | 12 | 13 | 4 | 10 | 11 | 7 | 10 | 13 |
| Outcome used for risk estimation | 30-Day mortality/ 7-day mortality | 30-Day SAE (hierarchical model) | ED/in-hospital/7-day SAE | 14-Day SAE (+30-day death) | 30-Day mortality | 3-Day mortality | 7-Day death | 30-Day death |
| n Patients (derivation/validation) | 78,642/- | 1033/- | 912/912 | 507/- | 8772/- | 3640/2957 | 7433/5158 | 4867/3229 |
| C-statistic (derivation/validation) | 0.806/- (7-Day) 0.755/- (30-day) | 0.68/- | 0.83/0.82 | 0.77/- | 0.801/- | 0.80/0.76 | 0.811/0.804 | 0.836/0.828 |
| Validated countries other than it was derived? (country/c-statistic) | Not | Not | Not | Not | Not | Not | Yes (Spain/0.741)a (Switzerland/0.765)a | Yes (Switzerland/0.832) |
| n Clinical risk categories defined in the derivation study | Not defined | 2 (low/increased risk) | 4 (not named) | 4 (low/medium/high/very-high) | 5 (very low/low/intermediate/high/very high) | 5 (very low/low/intermediate/high/very high) | 5 (very low/low/intermediate/high/very high) | 4 (low/intermediate/high/very high) |
| % Patients at the lowest risk category (estimated risk of adverse outcome) | – | Low risk (score <171 points) 13% (<5%) | Score 0–6 points 13.9% (1.0%) | Low risk 19.1% (2.8%) | Very low risk 20% (0.7%) | Very low risk 11.9% (0%) | Very low risk 40% (0.3%) | Low risk 40% (≤2.1%) |
| Country of the derivation study | Canada (Ontario all-province ED) | USA (Nashville and Cincinnati) | Spain (Basque Country) | Canada (Ottawa, Toronto, Kingston, Montreal and Edmonton) | Canada (Ontario all-province ED) | Spain (6% of Spanish ED, those forming the EAHFE network) | Canada (Ontario all-province ED) | 6% of Spanish ED (EAHFE network, by convenience) |
| Period of recruitment (year) | 2004–2007 | 2007–2011 | 2011–2013 | 2007–2010 | 2004–2007 | 2007/2009/2011/2014 | 2004–2007 | 2009/2011/2014 Discontinuous |
| Duration of patient recruitment (inclusion strategy) | 48 Months (all comers) | 42 Months (all comers recruited only by a convenience sample of EPs participating in the study) | 25 Months (not clearly specified if inclusion was consecutive) | 32 Months (all comers recruited only by a convenience sample of therapists/nurses participating in the study) (convenience sample of participating in the study) | Randomly picked up (stratified cluster sampling according hospital type) | 7 Months (all comers during the inclusion periods, which consisted in 1/2/2/2 months of each included year) | Randomly picked up (stratified cluster sampling according hospital type) | 7 Months (all comers during the inclusion periods, which consisted in 1/2/2/2 months of each included year) |
| Source of information | Administrative data | Clinical data (specifically designed dataset) | Clinical data (specifically designed dataset) | Clinical data (specifically designed dataset) | Administrative data | Clinical data (specifically designed dataset) | Administrative data | Clinical data (specifically designed dataset) |
| Information collection | Retrospective | Prospective | Prospective | Prospective | Retrospective | Prospective | Retrospective | Prospective |
| Main inclusion criteria | Not reported | Framingham criteria | Broad clinical definition | Task Force for the Diagnosis and Treatment of Acute and Chronic Heart Failure of the European Society of Cardiology criteria | Framingham criteria | Framingham criteria | Framingham criteria | Framingham criteria |
| Main exclusion criteria | None reported | None reported | None reported | Younger than 50, too ill to participate, oxygen saturation <85%, HR >120 bpm, SBP <90 mm Hg, confusion/dementia, ACS, palliative care, dialysis | Palliative care, DNR orders, On dialysis | STEMI+AHF (∼3%) | Palliative care, DNR orders, On dialysis | STEMI+AHF (∼3%) |
| Online calculator (website) | No | No | No | No | No | No | Yes (https://ehmrg.ices.on.ca/#/) | Yes (http://meessi-ahf.risk.score-calculator-ica-semes.portalsemes.org/calc.html) |
ACS: acute coronary syndrome; AHFRS: Acute Heart Failure Risk Score; DNR: do-not-resuscitate; EAHFE-3D: Epidemiology of Acute Heart Failure in Emergency department – 3 day; ECG: electrocardiogram; EHMRG: Emergency Heart failure Mortality Risk Grade; EHMRG30-ST: Emergency Heart failure Mortality Risk Grade 30 Day mortality – ST depression; EP: emergency physician; HR: heart rate; MEESSI-AHF: Multiple Estimation of risk based on Emergency department Spanish Score In patients with Acute Heart Failure; O2-sat: arterial oxygen saturation; OHFRS: Ottawa Heart Failure Risk Scale; SBP: systolic blood pressure; STEMI: ST-Elevation Myocardial Infarction; STRATIFY: Improving heart failure risk stratification in the emergency department; TIA: transitory ischemic attack.
Obtained for 30-day mortality prediction.
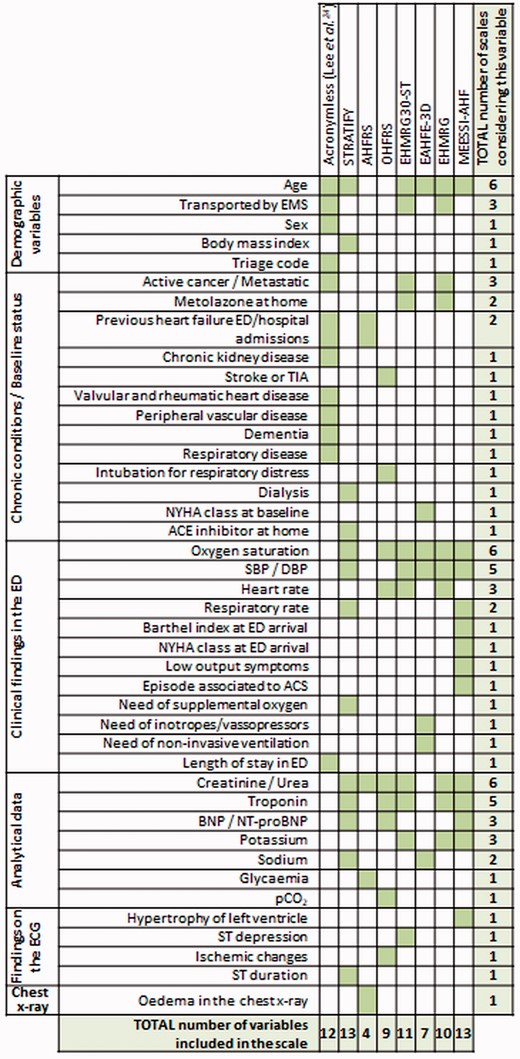
Variables included in the risk scales that have been derived in the emergency department (ED) using exclusively patients with acute heart failure (AHF).
ACS: acute coronary syndrome; ACE: Angiotensin-converting enzyme; AHFRS: Acute Heart Failure Risk Score; BNP: brain natriuretic peptide; DBP: diastolic blood pressure; EAHFE-3D: Epidemiology of Acute Heart Failure in Emergency department – 3 day; ECG: electrocardiogram; EHMRG: Emergency Heart failure Mortality Risk Grade; EHMRG30-ST: Emergency Heart failure Mortality Risk Grade 30 Day mortality – ST depression; EMS: Emergency medical services; EP: emergency physician; MEESSI-AHF: Multiple Estimation of risk based on Emergency department Spanish Score In patients with Acute Heart Failure; NT-proBNP: N-terminal prohormone of brain natriuretic peptide; NYHA: New Your Heart Association class; O2-sat: arterial oxygen saturation; OHFRS: Ottawa Heart Failure Risk Scale; pCO2: partial pressure of carbon dioxide; SBP: systolic blood pressure; STRATIFY: Improving heart failure risk stratification in the emergency department; TIA: transitory ischaemic attack.
Discussion
Identification and classification of risk prediction models based on their derivation setting
This systematic review has identified 19 scales for risk stratification that have been applied in ED patients with AHF in 28 different studies. We have classified these scales into three different groups, based on the setting and population where they were originally derived from. Eight of them were developed in the ED exclusively using AHF patients24,37,–39,54,56,58,59 and are thus the most suitable risk tools to predict outcomes in ED AHF patients. Their characteristics are discussed further below.
We also found five general scales, specifically derived in the ED setting, to predict outcomes in general populations of ED patients (but not exclusively AHF patients).49,52,53 Their strongest point is their feasibility, given that all ED patients can be triaged by the same tool on ED arrival. However, this comes at a price of a relative low performance in terms of discrimination, unless the predicted outcome was based on a very short time, i.e. ED or one-day mortality.52 One of these scales, ISAR, was developed in older ED patients to detect frailty, and demonstrated limited discriminative capacity in the ED when it was specifically investigated in AHF patients (c-statistic of 0.70).49
The last group of risk scores includes six scales that, although originally derived using only hospitalised AHF patients, have been subsequently tested in the ED setting. In fact, three of these scales correspond to the EFFECT-HF scale and its two modifications (BI-EFFECT and FBI-EFFECT). The c-statistic for 30-day prediction improved to 0.76 in respect to the original scale (EFFECT-HF, that was between 0.64 and 0.69) by the addition of the Barthel Index and physical frailty (two cardiac-unrelated variables measuring the baseline patient status) in the FBI-EFFECT. A similar predictive capacity (0.73) was reported for BWH in a single study that assessed SAEs, while the ADHERE and GWTG-HF fell below these values with the same population and outcome (0.69 and 0.70, respectively). Certainly, there are many other scoring systems for risk stratification that have been developed in either ambulatory patients without decompensated heart failure or among hospitalised AHF patients,63,–65 but we did not find specific multicentre studies testing such scales in an unselected cohort of AHF patients recruited in the ED. One likely explanation is that these scales would not meet the need of emergency physicians when assessing AHF patients in the ED. First, all predictors have to be readily available during the first hours of the ED patient stay in order to be helpful in clinical decision-making. For some scales, their predictors are not always easily available in the ED setting, such as left ventricular ejection fraction, selected biomarkers (e.g. ST2) or exercise tolerance testing.63 Second, scales derived in AHF hospitalised patients ignore around 16–36% of AHF patients that are directly discharged home without hospitalization.21 This fact introduces a potential selection bias, as these patients are not discharged at random and are probably less sick, where the scale application for decision-making may have a greater impact.
How risk scores have been used in the 28 identified publications
On top of evaluating model performance, some risk scales were used to stratify the severity of decompensation (based on the score or the risk category assigned by the score) or for co-variate adjustment in regressions evaluating associations with outcomes. In a way, the number obtained after applying a risk score integrates in a single value or category the probability of the outcome, though at a price of losing some precision in the estimation with respect to adjusting for all predictors independently. In connection with this clinical use, the use of these scales to select or stratify patients included in trials before their randomization, or to adjust after their intervention allocation, may avoid the current excessive patient heterogeneity described in recent randomised clinical trials failing to demonstrate clinical benefits.48,66,67
The correct risk stratification of patients should improve clinical outcomes and resources allocation. Risk scores are useful tools for planning disease management of patients for a given risk profile, and for the selection of patients suitable for more advanced therapies. However, very few risk prediction tools (none to our knowledge) have undergone formal impact analysis to determine whether they actually improve outcomes when used in clinical ED practice.68 Demonstration of clinical benefits of scales use by randomised clinical trials is difficult given the high number of patients and resources needed for this purpose. Nevertheless, it is expected that the use of the estimates provided by risk prediction models improves physician’s clinical decision-making and consequently improves patients’ outcomes and the cost-effectiveness of care. Whereas there are no impact studies of risk scores for AHF patients attending the ED, there has been an attempt to evaluate the additive value of using risk scores (EHMRG and EHMRG30-ST) on top of clinical judgment. Results have showed that a combination of clinical judgment and scales significantly improved predictions, suggesting they can be used to guide clinical decisions.44 The Acute Congestive Heart Failure Urgent Care Evaluation (ACUTE) study assessed the additive value of EHMRG score on top of the emergency physician estimation of the risk of patient death during the following 7 days, and showed that the addition of score provided a net reclassification improvement of 0.763 (when EHMRG was used continuously) or 0.820 (when EHMRG was used categorised).44 Nonetheless, there is a clear need for randomised clinical trials comparing the predictive performance of prognostic tools for AHF to clinician judgment on key clinical outcomes when routinely used in the ‘real world’ ED setting.
Predicted outcomes and between-scores comparisons for model performance in terms of discrimination
The most frequent predicted outcome was 30-day mortality. Of note, the closer the predicted outcome was to the AHF index episode, the higher discrimination the scale achieved. However, although death is an unambiguous and hard clinical event, it is not the only outcome of interest for emergency physicians.67,69 The prediction of short-term ED revisits or rehospitalizations after patient discharge, especially for those sent directly to home from ED without hospitalization, are also of concern for emergency physicians. These latter types of outcomes are more difficult to predict, as shown by the findings observed in the few studies addressing this issue: the MTS and MAT-SET scales assessed them in an unselected sample of AHF patients and failed in predicting them (c-statistics always below 0.60);53 and the MEESSI-AHF scale was also unsuccessful in making a reliable prediction of these outcomes in a selected sample of low-risk patients discharged from ED to home (c-statistics below 0.60.50 The reasons explaining the difficulty in predicting these outcomes include the subjectivity of the patient decision to consult to the ED demanding for urgent care, the heterogeneity in the clinical decision-making of emergency physicians to hospitalise patients, the percentage of hospitalization at the index event, the availability of hospital beds, the existence of alternatives to conventional hospitalization (such as short-stay units or hospitalization at home), the degree of development and connection of primary care and specialised facilities, the type of insurance and reimbursement policies, as well as differences in the accessibility of the ED and hospitalization in different geographic zones, cultures and healthcare systems. In any case, capturing revisits and rehospitalization in risk score predictions is relevant for three main reasons: (a) they negatively impact on patient survival; (b) they are relevant feedback for doctors discharging patients from ED or hospital wards; and (c) in some healthcare systems (like in the USA), economic penalties are applied in the form of reimbursements for those patients needing rehospitalization within the first 30 days after discharge.
A middle ground between the assessment of mortality and ED revisit or rehospitalization is placed in the assessment of a combination of SAEs, which some scales tried to predict. Although the events included in SAEs varied among scales, a patient-centred approach using some combination of severe clinical conditions that include myocardial infarction, need for mechanical ventilation, intensive care or emergent dialysis, death and the need for re-admission after ED discharge seem reasonable. Although not all these outcomes entail the same relevance, and patient preferences have to be taken into account in decision-making,70,71 a hierarchical approach ranking the events included in the composite can partly sort this flaw out, as the STRATIFY scale did.59 Scales using SAEs as an outcome for risk stratification were BWH,39 GWTG-HS39 and ADHERE39 (derived using exclusively AHF hospitalised patients) and STRATIFY,59 OHFRS37 and AHFRS39 (using whole cohorts containing hospitalised and non-hospitalised AHF patients). These parameters, in terms of discrimination, have to be ranked between the poor discrimination of revisits or rehospitalizations taken alone and the adequate discrimination of mortality (c-statistics of 0.73, 0.70, 0.69, 0.68, 0.77 and 0.83 for the aforementioned scales, respectively).37,39,59
Description of the main characteristics of the scales specifically derived in the ED setting
The eight scales derived in AHF patients in the ED setting24,37,–39,54,56,58,59 are most likely the most suitable and accurate tools to stratify risk because of their nature (derived in ED AHF patients to predict outcome in the same kind of patients and setting). These eight risk scales are: the acronymless score derived by Lee et al.,24 EHMRG,54 EHMRG30-ST,56 STRATIFY,59 EAHFE-3D,58 AHFRS,39 OHFRS37 and MEESSI-AHF.38 Among them, some have some additive value by having the following features: developed the risk model with robust methodology in their original derivation/validation processes, by using large cohort of patients, with limited number of variables in the algorithm, all of them available during the first 1–2 h of patient stay in the ED, having external validation in new cohorts after the initial development, in some cases carried out in different countries where they were originally developed for a couple of scales, and of obtaining very good discrimination, with c-statistics over 0.80 in the majority of reports. All of these features have been proposed to be met by a scale that is intended to become clinical useful.72
A deep analysis of the currently available scales concludes that none are an ideal risk prediction scale. The EHMRG and MEESSI-AHF scales are most likely those closer to be implemented in clinical practice, given that they have several favourable features. These two scales have been compared twice using the same populations: although comparison always favoured MEESSI-AHF, the outcome used for comparisons was 30-day mortality, the one used for the MEESSI-AHF but not for EHMRG derivation. In addition, one of these comparisons was performed in the Spanish population, the same country where MEESSI-AHF, but not EHMRG, was derived. Clearly, every risk prediction scale tool is relevant to its patient population, but it is essential that they also perform well when used in other countries, with different healthcare systems, before generalization can be recommended. The consideration of the Barthel Index by MEESSI-AHF probably makes this risk model more appropriate for older AHF patients than others, as dependence and frailty have been recently shown to be main determinants in outcomes of AHF patients.18,73,74
Finally, disposition decisions for AHF patients involve more than simple risk prediction. These decisions typically reflect the ability to optimise therapy in the ED, consider the aetiology, precipitating factors and other comorbid illnesses, the availability of follow-up care and the patients’ self-care at home, as well as their own patient preferences.70 The addition of measures related to cognitive, functional, social and nutritional domains may improve the discriminative ability of many risk prediction tools more that previously had not included them in their algorithms. But even with fine refinements making scales more powerful tools for predicting the risk of adverse events, we should not be abusive in their use, as they should not be used in isolation from other considerations when making disposition decisions for AHF patients in the ED setting.
Limitations
Many scales were derived retrospectively, based on chart review. They were derived in general populations using clinical definitions of AHF for patient inclusion. This clinical definition of AHF may have resulted in a more heterogeneous population in comparison to the use of a more refined definition of AHF which may even have led to less precise scales. However, authors participating in the studies frequently stated that they preferred to include typical ED patients with a clinical AHF diagnosis, where the scale is intended to be used. Importantly, we have mainly focused on two dimensions of model performance (discrimination and external validation), but it has to be acknowledged that other features are equally relevant,75,76 though more difficult to evaluate in a systematic review (i.e. calibration). We cannot exclude a potential role of other scales derived in other settings or not exclusively using patients with AHF that have never been tested in AHF patients in the ED setting. Additionally, most of these risk scales have been derived and used by a limited number of research groups using a limited number of cohorts, hence some patients/cohorts have been used in more than one study. On top of the aforementioned limitations, it should be noted that most of the AHF risk scores, including EHMRG and MEESSI-AHF, have not been designed to predict ED revisits or rehospitalizations. In fact, there is evidence that these scores generally fail in such predictions and there is a need to refine them in order to overcome this limitation. The inclusion of non-cardiologic predictors, such as frailty and dependence, might improve the prediction of these outcomes.77
Conclusions
This systematic review identified 19 scales for risk stratification of AHF patients in the ED that may help to better select patients for either hospitalising or discharging them home. Although some of the risk tools are suitable for their immediate use, we lack studies evaluating the feasibility and effects on clinical outcomes of the clinical use of risk stratification in AHF patients in the ED setting. We found two AHF scales, the EHMRG and the MEESSI-AHF, have high accuracy and have already been appropriately validated, and seem therefore well-suited for routine clinical use to help emergency physicians in AHF patient risk stratification before discharge or hospitalization decision is taken in the ED. Further research is needed regarding the impact of risk stratification on decision making of discharge or hospitalization of patients with heart failure who are being evaluated in the ED due to an acute decompensation. In this regard, before generalising their clinical use, risk scores should ideally prove through a randomised clinical trial that patients who are managed in the ED after risk stratification (ideally for death, ED revisit and rehospitalization) have better clinical outcomes than non-stratified patients. A multidisciplinary approach to this challenge is needed78,–80 because any benefit proven by using AHF risk stratification at ED would translate into both patient outcome and health care efficiency improvements.81
Conflict of interest
The following authors provided statements of conflict of interests: Oscar Miró received grants from the Instituto de Salud Carlos III supported with funds from the Spanish Ministry of Health and FEDER (PI10/01918, PI11/01021, PI15/01019, PI15/00773, PI 18/00456), La Marató de TV3 (2015/2510) and from the Catalonian Government for Consolidated Groups of Investigation (GRC 2009/1385, 2014/0313, 2017/1424); Elke Platz received grants from the National Institutes of Health; Danielle M Gualandro has received research grants from FAPESP (Sao Paulo Research Foundation) and consulting honoraria from Roche, outside the submitted work; W Frank Peacock reports grants from Abbott, grants from Ortho Clinical Diagnostics, grants from Roche, grants and personal fees from Beckman Coulter, grants and personal fees from Siemens, grants and personal fees from Bayer, grants and personal fees from Quidel, outside the submitted work; John McMurray reports other from Bayer, non-financial support and other from Cardiorentis, non-financial support and other from Amgen, non-financial support and other from Oxford University/Bayer, non-financial support and other from Theracos, non-financial support and other from Abbvie, other from DalCor, other from Pfizer, other from Merck, non-financial support and other from Novartis, non-financial support and other from Glaxo Smith Kline (GSK), other from Bristol Myers Squibb (BMS), non-financial support and other from Vifor-Fresenius , non-financial support and other from Kidney Research UK (KRUK), non-financial support and other from Novartis, non-financial support and other from AstraZeneca, outside the submitted work; Louise Cullen reports grants and personal fees from Abbott Diagnostics, grants from Beckman Coulter, grants and personal fees from Siemens, outside the submitted work.; Francisco J Martın-Sanchez received speaker, advisory or consulting fees from Novartis, MSD, Bristol-Myers Squibb, Pfizer, The Medicine Company, Otsuka, Thermo Fisher, Cardiorentis, Sanofi and research grants from the Spanish Ministry of Health and FEDER, Mapfre, Novartis, Bayer, MSD, Abbot and Orion-Pharma; Martin R Cowie reports grants and personal fees from Abbott, grants and personal fees from Medtronic, grants and personal fees from Boston Scientific, personal fees from Servier, personal fees from Bayer, personal fees from Novartis, personal fees from AstraZeneca, personal fees from Fire1Foundry, personal fees from Neurotronik, outside the submitted work; Hector Bueno reports grants from Instituto de Salud Carlos III, personal fees from Bayer, personal fees from Novartis, grants, personal fees and non-financial support from AstraZeneca, grants and personal fees from BMS-Pfizer, personal fees from Ferrer, personal fees from MEDSCAPE-the Heart-org, personal fees from Janssen, outside the submitted work; Alexandre Mebazaa reports personal fees from Novartis, personal fees from Orion, personal fees from Roche, personal fees from Servier, grants and personal fees from Adrenomed, grants and personal fees from Abbott, personal fees from Sanofi, personal fees from Otsuka, personal fees from Philips, grants from 4TEEN4, outside the submitted work; Christian Mueller has received research support from the University Hospital Basel, the University of Basel, the Foundation for Cardiovascular Research Basel, the Swiss heart Foundation, the Swiss National Science Foundation, Abbott, Roche, Novartis and Singulex, as well as speaker honoraria from Novartis and Roche. Xavier Rossello, Josep Masip, Salvatore DiSomma, Mucio Tavares de Oliveira Jr, Alain S Maisel, Susanna Price and Christiaan Vrints have nothing to declare.
The author(s) received no financial support for the research, authorship and/or publication of this article.
References
Author notes
*Òscar Miró and Xavier Rossello have equally contributed to the manuscript and should both be considered as joint co-first authors and co-corresponding authors.

Comments