


Abstract
To develop a machine learning model to predict the diagnosis of pulmonary embolism (PE).
We undertook a derivation and internal validation study to develop a risk prediction model for use in patients being investigated for possible PE. The machine learning technique, generalized logistic regression using elastic net, was chosen following an assessment of seven machine learning techniques and on the basis that it optimized the area under the receiver operator characteristic curve (AUC) and Brier score. Models were developed both with and without the addition of D-dimer. A total of 3347 patients were included in the study of whom, 219 (6.5%) had PE. Four clinical variables (O2 saturation, previous deep venous thrombosis or PE, immobilization or surgery, and alternative diagnosis equal or more likely than PE) plus D-dimer contributed to the machine learning models. The addition of D-dimer improved the AUC by 0.16 (95% confidence interval 0.13–0.19), from 0.73 to 0.89 (0.87–0.91) and decreased the Brier score by 14% (10–18%). More could be ruled out with a higher positive likelihood ratio than by the Wells score combined with D-dimer, revised Geneva score combined with D-dimer, or the Pulmonary Embolism Rule-out Criteria score. Machine learning with D-dimer maintained a low-false-negative rate at a true-negative rate of nearly 53%, which was better performance than any of the other alternatives.
A machine learning model outperformed traditional risk scores for the risk stratification of PE in the emergency department. However, external validation is needed.

Introduction
Pulmonary embolism (PE) is a major cardiovascular problem, with an overall annual incidence of 1 per 1000 people, and 11.3 per 1000 in individuals aged 80 years old or over.1–3 High-risk patients have elevated in-hospital mortality rates, which may be as high as 43%.1 The diagnosis of PE is challenging since the signs and symptoms at presentation overlap with other common diseases. Confirmation of the diagnosis is usually made with computed tomography pulmonary angiography (CTPA) in the emergency department (ED). However, only a small proportion of patients referred to CTPA will have a positive result.4,5 Additionally, radiation exposure, potential nephrotoxicity, and health care costs are issues of concern. Therefore, a careful clinical assessment is needed to estimate the preclinical probability of PE so as to risk stratify before referring to imaging tests or not.
Clinical scores in combination with D-dimer have been used to improve the utilization of diagnostic imaging.6 Fibrinolysis results in increased D-dimer concentration in patients with acute venous thromboembolism and some other non-thrombotic disorders.3,7,8 D-dimer is highly sensitive and, at pre-specified thresholds, useful to rule out the diagnosis of PE in patients with low clinical pre-test probability. However, the low specificity of D-dimer means that many patients have CTPA scans that are negative.3,8 An attempt to improve D-dimer performance has been the use of clinical probability adjusted- or age-adjusted D-dimer interpretation.9–11 Nevertheless, the specificity obtained with such adjustments is still not ideal and may increase the number of false-negative tests.11 Therefore, new approaches are warranted.
Machine learning techniques have been recently employed in many cardiovascular conditions and may provide more personalized estimations with improved accuracy.12–14 The aim of this study was to develop a risk prediction model for PE to support clinical decision-making in the ED.
Methods
We undertook a derivation and internal validation study to develop a risk prediction model for use in patients being investigated for possible PE.
Study population
The population, inclusion, exclusion, and recruitment methods have been described in detail elsewhere.15 Briefly, eligible subjects were adults (>17 years) being investigated between September 2003 and October 2008 for possible PE whom the attending clinician had sufficient clinical suspicion for PE, such that they believed objective testing to be warranted, after initial history and physical examination. A ‘suspicion’ was not defined by an explicit ‘a priori’ combination of complaints, physical finding, or risk factors. Local hospital guidelines advised to suspect PE if there is unexplained central chest pain, dyspnoea, hypoxia, collapse/shock, raised Jugular venous pressure (JVP), tachycardia, or arrhythmia present. Haemoptysis, pleuritic chest pain, and pleural effusion could also trigger suspicion. Patients became eligible for enrolment when a clinician decided to request a D-dimer test. Exclusion criteria included patients undergoing anticoagulant therapy or who would be difficult to follow-up (living overseas, unable to speak English). The study took place in Christchurch Hospital, Christchurch, New Zealand, an urban metropolitan hospital with ∼75 000 ED presentations p.a. at the time. Local clinical practice guidelines during period of data collection are outlined in Supplementary material online, Figure S1.
Data were gathered prospectively using a bespoke D-dimer blood test request form, which included check boxes for symptoms, signs, and risk factors for PE. These included those needed to calculate the Wells PE score.16 Follow-up data were gathered by a patient telephone interview 90 days following attendance conducted by a research nurse and by inspection of the clinical notes and the electronic health record. All people in New Zealand have a unique National Health Identifier which ensures mortality and all hospital events are recorded in electronic health record. All patients provided informed consent and the study was approved by the Canterbury Regional Ethics Committee, New Zealand.
Endpoint definition and adjudication
The clinical endpoint was a diagnosis of PE within 90 days. The reference standard for diagnosis was a combination of CTPA, ventilation and perfusion (VQ) scanning or ultrasonography, digital subtraction angiography, and 90-day follow-up as previously described.15 Scans were interpreted by college certified specialists in Radiology and Nuclear Medicine.
D-dimer tests
Up to January 2006 clinical D-dimer concentrations were measured using the HemosIL test D-dimer assay (Instrumentation Laboratory; Lexington, MA, USA). From February 2006 the assay was HemosIL D-dimer HS (Instrumentation Laboratory). The assays have an identical manufacturer cut-off (243 ng/mL). The principal difference of the HS test is that it avoids interference with some endogenous factors such as rheumatoid factor and has more specific D-dimer detection. This leads to less false positives and better specificity. The sensitivity is unchanged. Detailed information on the differences between the tests are described elsewhere.15
Algorithm development
Variables to be considered for the machine learning models were chosen a priori as those which appear in any of the three clinical scores for possible PE risk stratification, namely the modified Wells score,16 the revised Geneva score,17 and the Pulmonary Embolism Rule-out Criteria (PERC).18 These were age, O2 saturation, clinical signs and symptoms of deep venous thrombosis (DVT), alternative diagnosis equal or more likely than PE, heart rate, immobilization or surgery, previous PE or DVT, haemoptysis, malignancy, lower limb pain, lower leg swell, tender on palpation and hormone use (Supplementary material online, Table S1). These established variables were selected based on the objectives of our study. There are two reasons for using statistical regression models and machine learning. One is to improve prediction and the other is to discover new predictors. Our goal was not to discover new predictors but rather improve the prediction using variables well known by physicians and clearly associated with the diagnosis of PE.
Missing data with the exception of the variable ‘Alternative diagnosis equal or more likely than PE’ was imputed according to Harrell with the aregImpute function in the R package Hmisc.19 The missing data for the no-alternative diagnosis variable was imputed as ‘No’ based on the consensus opinion that this best represented the response of physicians investigating a patient for PE who did not specifically answer Yes or No to the question ‘Alternative diagnosis equal or more likely than PE?’ The maximum missingness of a variable was 14% the number of imputed data sets was set at 15 as recommended by White et al.20 The data set using the mean and mode of missing variables was used in the final analysis.
Three machine learning models were developed: the first is based on clinical variables alone, the second uses clinical variables plus D-dimer, and the third, for a sensitivity analysis, uses clinical variables with the exception of the response to the question ‘Was there an alternative diagnosis more likely than PE?’ plus D-dimer. This latter model is reported in the Supplementary material online. D-dimer was included in the models as a continuous variable.
The machine learning technique, generalized logistic regression using elastic net, was chosen following an assessment of seven machine learning techniques and on the basis that it optimized the area under the receiver operator characteristic curve (AUC) and Brier score (Supplementary material online, Figure S2). The process of selecting the optimal variables was (1) create a model with N variables and calculate the AUC of this model; (2) drop one variable at a time and create N new models, each with N − 1 variables. Calculate the AUC of each of the new models; (3) select the new model with the highest AUC; (4) if the AUC of the model selected in step 3 is higher than or equal to the AUC calculated in step 1 then: (a) use the variables used to build that best new model as the new N variables and return to step 1, else; (b) the N variables used in step 1 is the set that creates the best model. The initial set of N variables is the superset of variables used for Wells, PERC, and Geneva models. Ten-fold cross-validation was used to internally validate and reduce optimism. The statistical metrics presented are, therefore, optimism corrected.
The analysis code for this study is available on request. The algorithm is proprietary and subject to a patent application, but we can share it with researchers who agree to use it only for research purposes with a data-sharing agreement.
Statistical analysis
This was a convenience sample. Data are presented as n (%) or mean ± standard deviation, except for variables with non-normal distribution, for which median and interquartile ranges are provided.
Model performance was assessed by discrimination metrics, the AUC [95% confidence interval (CI)], Brier scores, and by calibration curves. Machine learning model performance was compared to that of standard clinical scores used to rule-out PE (rule out the need for CTPA), namely the modified Wells score, the revised Geneva score, and the PERC. We determined the rule-out probability threshold for each machine learning model for a sensitivity of 98%. This threshold was chosen on the basis of previous work by Kline et al.21 We calculated at this threshold and for the conventional score thresholds the negative predictive value, specificity, positive predictive value, negative and positive likelihood ratios, and the percentage of patients that are ruled out. The post-test probability for use when considering ruling out a PE can be obtained by multiplying the pre-test probability by the positive likelihood ratio. All CIs are 95%. Statistical analysis was performed in R v4.03 2020 (R Project for Statistical Computing, https://www.r-project.org).
Results
Among 3359 patients assessed for possible PE, 12 were excluded because of insufficient data, leaving 3347 patients included in the final analysis, of whom 219 (6.5%) were diagnosed with a PE. Patients were 54.6 ± 19.6 years old and 57.1% were female, as observed in Table 1. Patients with the final diagnosis of PE were older, were more likely to be male, and had higher heart rate and lower O2 saturation at presentation. Clinical signs or symptoms of DVT were more frequently observed in patients with PE, while alternative diagnosis was less often available. Patients with PE were more frequently associated with clinical signs consistent with PE such as haemoptysis, immobilization, surgery, history of DVT, tender on palpations, and lower knee pain or swelling.
Baseline characteristics stratified according to the occurrence of pulmonary embolism
| Variable | PE | |||
|---|---|---|---|---|
| No (N = 3128) | Yes (N = 219) | Total (N = 3347) | Missing (%) | |
| Agea | 54.1 ± 19.5 | 61.6 ± 16.7 | 54.6 ± 19.4 | 0.3 |
| Sex (female) | 1800 (57.5%) | 110 (50.2%) | 1910 (57.1%) | — |
| Systolic blood pressure | 134 (119–151) | 136 (119–151) | 134 (119–151) | 6.7 |
| Diastolic blood pressure | 77 (67–87) | 79 (69–89) | 77 (67–87) | 6.5 |
| Temperature | 36.6 ± 1.3 | 36.7 ± 0.7 | 36.6 ± 1.3 | 10.2 |
| Heart ratea | 86.1 ± 20.3 | 92.1 ± 20.1 | 86.5 ± 20.3 | 5.6 |
| Respiratory rate | 12.7 ± 5.9 | 13.1 ± 5.3 | 12.7 ± 5.9 | 7.9 |
| O2 saturationa | 96.8 ± 3.2 | 95.3 ± 3.8 | 96.7 (3.2) | 6.5 |
| Clinical signs and symptoms of DVTa | 358 (11.9%) | 48 (23.6%) | 406 (12.7%) | 4.3 |
| Alternative diagnosis equal or more likely than PEa | 986 (82.0%) | 27 (45.8%) | 1013 (80.3%) | 62 |
| Haemoptysisa | 152 (5.2%) | 15 (7.2%) | 167(5.3%) | 6.1 |
| Immobilization/surgerya | 328 (11.7%) | 63 (33.5%) | 391 (13.1%) | 9 |
| Previous DVT/PEa | 364 (12.0%) | 58 (27.8%) | 422 (13.1%) | 3.5 |
| Malignancya | 72 (2.7%) | 7 (3.7%) | 79 (2.8%) | 14.3 |
| Oestrogen usea | 188 (6.5%) | 15 (7.5%) | 203 (6.5%) | 7.3 |
| Tender on palpationa | 222 (7.5%) | 33 (16.5%) | 255 (8.0%) | 5.3 |
| Lower limb paina | 268 (8.9%) | 36 (17.1%) | 304 (9.5%) | 4 |
| Lower leg swella | 62 (2.1%) | 11 (5.8%) | 73 (2.4%) | 7.7 |
| D-dimer (ng/mL)a | 252 (142–502) | 1000 (690–1000) | 273 (148–593) | 0 |
DVT, deep venous thrombosis; PE, pulmonary embolism. aVariables in machine learning models.
Four clinical variables plus D-dimer contributed to the machine learning models, namely O2 saturation, previous DVT/PE, immobilization/surgery, and alternative diagnosis equal or more likely than PE. Clinical variables alone discriminated between PE and not PE with an AUC of 0.73 (0.69–0.76) and Brier score of 0.059. The addition of D-dimer to the machine learning model increased the AUC by 0.16 (0.13–0.19) to 0.89 (0.87–0.91) and decreased the Brier score by 14% (10–18%) to 0.051. The calibration was average (Supplementary material online, Figure S3).
At the rule-out threshold of >98% sensitivity for each of 500 bootstrapped samples the clinical variable alone machine learning model ruled out 14.0% (12.9–15.3%) of patients with a positive likelihood ratio of 1.15 (1.13–1.18) at a threshold of 0.007 (Table 2). The addition of D-dimer improved the proportion ruled out to 49.8% (48.1–51.6%) and improved the positive likelihood ratio to 2.11 (2.03–2.20) at a threshold of 0.014. More could be ruled out with a higher positive likelihood ratio than by the Wells score combined with D-dimer, revised Geneva score combined with D-dimer, or the PERC score (Table 2). The age-adjusted D-dimer in combination with Wells and revised Geneva scores had poorer sensitivity (mean <98%) and so are not compared further. Machine learning with D-dimer maintained a low-false-negative rate at a true-negative rate of nearly 53% (Figure 1), which was better performance than any of the other alternatives. In the original data set, the machine learning model with D-dimer had three false negatives (out of 219 events) below the threshold of 0.014.
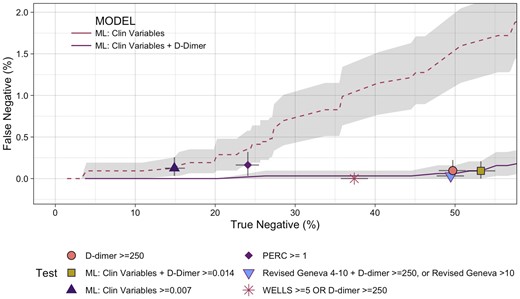
Performance of tests comparing safety (false negatives) with efficacy (true negatives) as percentage of all patients. The grey lines at each point represent 95% confidence intervals. The grey shading represents the 95% confidence interval for the machine learning models across the true-negative range. ML, machine learning; PERC, Pulmonary Embolism Rule-out Criteria.
Classification metrics for thresholds determined as >98% or as near as possible to that mark
| Test | Sensitivity | NPV | LR-ve | Percent negative | Specificity | PPV | LR+ve | Threshold |
|---|---|---|---|---|---|---|---|---|
| WELLS >4 OR D-dimer ≥age-adjusted threshold | 97.8% (95.6–99.5%) | 99.7% (99.4–99.9%) | 0.043 (0.009–0.084) | 49.4% (47.7–51.2%) | 52.7% (50.7–54.5%) | 12.6% (11.1–14.1%) | 2.07 (1.98–2.16) | NA |
| WELLS ≥5 OR D-dimer ≥250 | 100% (98.3–100%) | 100% (99.7–100%) | <0.01a | 35% (33.4–36.6%) | 37.4% (35.8–39%) | 10% (8.8–11.2%) | 1.60 (1.56–1.64) | NA |
| D-dimer ≥age-adjusted threshold or Revised Geneva >10 | 95.9% (93.1–98.2%) | 99.5% (99.2–99.8%) | 0.070 (0.032–0.119) | 54.4% (52.8–56.1%) | 57.9% (56.1–59.8%) | 13.7% (12.1–15.4%) | 2.28 (2.16–2.40) | NA |
| Revised Geneva 4–10 and D-dimer ≥250 or Revised Geneva >10 | 99.6% (98.5–100%) | 99.9% (99.8–100%) | 0.009 (0–0.030) | 46.3% (44.6–47.8%) | 49.5% (47.7–51.1%) | 12.1% (10.7–13.5%) | 1.97 (1.90–2.04) | NA |
| PERC ≥ 1 | 97.7% (95.1–99.5%) | 99.3% (98.6–99.9%) | 0.097 (0.02–0.206) | 22.7% (21.3–24%) | 24.1% (22.6–25.6%) | 8.2% (7.2–9.3%) | 1.29 (1.24–1.33) | NA |
| D-dimer ≥age-adjusted threshold | 95% (92–97.4%) | 99.4% (99–99.7%) | 0.086 (0.045–0.138) | 54.8% (53.2–56.4%) | 58.3% (56.4–60.1%) | 13.7% (12–15.4%) | 2.28 (2.15–2.40) | NA |
| D-dimer ≥ 250 | 98.6% (97–100%) | 99.8% (99.6–100%) | 0.027 (0–0.061) | 46.6% (44.9–48.1%) | 49.7% (47.9–51.3%) | 12% (10.6–13.5%) | 1.96 (1.89–2.03) | NA |
| ML performance at ≥98% sensitivity | ||||||||
| ML: clinical variables (only) | 98.2% (96.3–99.6%) | 99.2% (98.3–99.8%) | 0.121 (0.030–0.244) | 14% (12.9–15.3%) | 14.9% (13.7–16.2%) | 7.5% (6.6–8.4%) | 1.15 (1.13–1.18) | 0.007 |
| ML: clinical variables + D-dimer | 98.7% (97–100%) | 99.8% (99.6–100%) | 0.025 (0–0.056) | 49.8% (48.1–51.6%) | 53.2% (51.4–55%) | 12.8% (11.3–14.4%) | 2.11 (2.03–2.20) | 0.014 |
LR-ve, negative likelihood ratio; LR+ve, positive likelihood ratio; ML, machine learning; NA, not applicable; NPV, negative predictive value; PERC, Pulmonary Embolism Rule-out Criteria; PPV, positive predictive value.
The negative likelihood ratio cannot be calculated when there are zero false negatives. This is an estimate based on the value if there was 1 false negative.
Sensitivity analysis
The machine learning model which excluded the ‘alternative diagnosis’ variable ruled out only 1.5% fewer patients (47.3%, CI 45.6–48.9%) at a sensitivity of 98% compared with the model which included this variable (Supplementary material online, Table S2).
Discussion
In the present study, we evaluated 3347 patients who presented to the ED with suspected PE. A machine learning model, including clinical variables plus D-dimer, discriminated well between those with and without PE. Our machine learning model ruled out PE in more patients than any of the existing clinical score systems, combined or not to D-dimer, and was superior to D-dimer alone.
The diagnosis of PE is challenging and most emergency physicians use clinical predictor rules combined with D-dimer to risk stratify and aid the diagnosis in patients with suspected PE. Nevertheless, in most cases the medical doctors still need to perform a CTPA scan to obtain a final conclusive diagnosis. Regression techniques, although extensively used in clinical studies, have their limitations, such as overfitting, underperforming predictions, identifying spurious predictors, and failing to identify important ones.22,23 Therefore, the use of machine learning models such as the one used in this study are helpful in improving the prediction using stablished variables. It essentially takes such variables and optimizes their interaction in a way that simple heuristics cannot do. Furthermore, the resulting model, with the inclusion of stablished variables, is more likely to be accepted by the clinician.
D-dimer was included in our model and gave substantial contribution. Most biomarkers, including D-dimer, are non-specific. Improved methods such as machine learning can improve specificity, resulting in a better prediction model. However, some authors have used a different approach, aimed at improving the ruling-out prediction of PE, without using biomarkers.24 The main objective of such approach is to produce a pre-test probability low enough to preclude D-dimer testing in the ED, which is a different goal as compared with the present study. Which of the two strategies is better has yet to be defined. Nevertheless, including D-dimer in our model greatly improved the prediction.
Machine learning has been used before to aid the diagnosis of PE. However, most of these studies have not used clinical variables but rather information obtained from CTPA scans. Thus, such models are useful for the radiologists but are not helpful for the emergency physicians.25–27 Other studies have used machine learning to predict PE in specific populations such as young patients, patients with coronavirus disease 2019 (COVID-19), and patients with confirmed diagnosis of PE who prematurely discontinued the anticoagulant therapy.28–30 To the best of our knowledge, only one previous study created a model based on clinical and biomarker data. Banerjee et al.31 published data on the PERFORM system, a machine learning model created to generate a patient-specific risk score for PE by analysing longitudinal clinical data as clinical decision support for patients referred for computed tomography imaging for PE. The derivation and internal validation models were obtained from CTPA scans from 3214 patients at the Stanford University hospitals and clinics. The models were externally validated on 240 patients seen at Duke University Medical Center. The best-performing model achieved an AUC of 0.90 (95% CI 0.87–0.91) to predict a positive PE study. The external validation achieved an AUC of 0.71 (95% CI 0.69–0.72). The machine learning model had a better performance than the traditional scoring systems, namely the Wells score, the revised Geneva score, and the PERC score.
The performance of their model was similar to ours regarding the derivation and internal validation analysis. However, it is noteworthy that in the study by Banerjee et al., the AUC was only 0.71 in the external validation. A drop from 0.90 to 0.71 is significant. It suggests the algorithm was overfitted. It is also possible that the population used for external validation was different from that used in the original cohort. Our model has not been externally validated and therefore no comparison can be made in this regard.
Some differences between the two studies must be pointed out. First, in the study of Banerjee et al., the inclusion criterion was a CTPA performed from 1998 through 2016, including inpatient, ED, and outpatient scans. Moreover, not all patients had a D-dimer testing. Our study included patients with suspected PE at the ED, for whom a D-dimer test had been requested. Second, they excluded patients not referred for CTPA, possibly creating a referral bias, excluding patients with low-probability scores. The design of their study was not to displace the existing rule-out criteria but instead to reduce unneeded CTPA. Conversely, the design of our study aimed to confront pre-existing scores. Additionally, our model seems to be more appropriate to assist the emergency physician because our data were collected exclusively in the ED.
New diagnostic models based on machine learning analysis, such as the one in the present study, certainly help to overcome the limitations of traditional scores. This model can speed up the diagnosis of PE, leading to earlier treatment and possibly better outcomes. In addition, it would avoid unnecessary image scans, reducing costs. Pulmonary embolism can occur as a complication in patients with COVID-19.32–35 However, our model should not be used in such patients because it was created with data from non-COVID-19 patients. New models, specific for COVID-19, need to be derived since traditional risk factors for PE may not have the same role in COVID-19.29,32–35 Moreover, the role of D-dimer is not clear in the prediction of PE in COVID-19. In the Italy Registry of COVID-19 patients, D-dimer was the only predictor of PE in multivariable analysis.35 On the other hand, in the French Registry, D-dimer was not an independent predictor.33
Limitations
This study has some limitations. First, we have used a D-dimer assay that has now been superseeded. However, more modern assays are well correlated. Second, the imputation of no-alternative diagnosis variable was necessary for two of the models assessed. The assumption that there was not an alternative diagnosis being considered as more likely than PE is reasonable because the patients were first being considered for PE. This variable is highly subjective and could in any model add to noise. Finally, prior to an implementation study, we recommend external validation of this model. We will make the algorithm available for this purpose.
In conclusion, using machine learning techniques, which combined clinical variables and D-dimer, we developed a model with good performance to predict the diagnosis of PE at the ED. The model created in this study outperformed the traditional clinical scores used for this purpose. However, before implementation it needs to be externally validated.
Supplementary material
Supplementary material is available at European Heart Journal – Acute Cardiovascular Care online.
Conflict of interest: H.V.: Speaker honoraria from Novartis, AstraZeneca, Novo Nordisk, Roche, Daiichi-Sankyo, and Servier. J.W.P.: Statistical consultancy for Abbott Diagnostics and Upstream Medical Technologies. M.O.: Chief Technical Officer of Brainstorm Medical, Inc. A.S.M.: Co-founder of Brainstorm Medical, Inc. M.P.T.: Consulting, advising and research grants from Abbott, Abbott Point of Care, Alere, Beckman, Roche, and Siemens. The model reported in this manuscript is being developed as a commercial product by Brainstorm Medical Inc. All other authors declared no conflict of interest.
References
Author notes
Humberto Villacorta and John W. Pickering contributed equally to the study.

Comments