


Abstract
The temporal and small-scale spatial patterns of infestation by larval dogwood borer, Synanthedon scitula (Harris) were studied from 2002 to 2004 in two newly planted apple orchards in West Virginia and Virginia. Rootstock, tree variety, and cultural management practice were significantly associated with the presence and extent of dogwood borer infestation. In West Virginia, infestation was significantly greater on trees planted on M.26 rootstock compared with M.7 rootstock, and on trees fitted with tree guards compared with other trunk treatments. In Virginia, the proportion of infested trees was significantly greater for ‘Idared’ tree varieties compared with ‘Buckeye Gala’, and on trees fitted with tree guards compared with other trunk treatments. Median polishing technique was used to separate variability in the infestation data into large-scale variation (trend) induced mainly by treatments and small-scale variation. Variography was used to study the median-polished residuals of infestation that represent the small-scale variation. The results of variogram analysis of the median-polished residuals indicated that there were moderate to high degrees of aggregation in dogwood borer infestations on neighboring apple trees (Malus domestica Borkh.) with ranges of spatial autocorrelation from 2.8 to 17.0 m. The spatial patterns of the aggregation of infestation in the West Virginia and Virginia orchards were best described by the spherical and exponential semiovariogram models, respectively. Interpolated surface maps of the median-polished residuals revealed local hot spots, which were generally more prevalent within tree guard treatments, and were typically found where dogwood borer infestations originated. Results are discussed in relation to the sampling and management of dogwood borer larvae.
The dogwood borer, Synanthedon scitula (Harris), is an important indirect pest of apple trees (Malus domestica Borkh.) throughout eastern North America, particularly in high-density apple orchards in which trees are planted on size-controlling rootstocks (Riedl et al. 1985, Kain and Straub 2001, Bergh and Leskey 2003). These rootstocks often promote the formation of burr knots (adventitious root initials) below the graft union or scion (Rom 1970, 1973; Marini et al. 2003). Burr knots are attractive oviposition sites for female dogwood borer and appear to be an important resource for developing larvae (Riedl et al. 1985, Warner and Hay 1985, Kain and Straub 2001, Bergh and Leskey 2003, Leskey and Bergh 2005). Over consecutive seasons of larval feeding, reductions in tree health and yield (Howitt 1993) and tree death from girdling (Weires 1986) can occur as larvae consume available burr knot tissue and mine outward into the surrounding cambium. It is likely that the effect of larval feeding may be most severe during the initial years of orchard establishment and growth (Leskey and Bergh 2005).
Effective management programs for the dogwood borer in apple orchards are needed to reduce damage caused by this pest. A prerequisite for such programs is an understanding of the temporal and spatial population dynamics of the insect and the factors that affect these dynamics. Several studies have examined the effects of host plant status, such as the presence and amount of burr knot tissue, on dogwood borer population development, and incidence of infestation (Riedl et al. 1985, Warner and Hay 1985, Kain and Straub 2001, Leskey and Bergh 2005). The use of clonal rootstocks, tree guards, and inadequate weed control around the rootstock are some of the factors that have been implicated in the promotion of burr knot tissue (Leskey and Bergh 2005). However, although there appears to be a positive relationship between the amount of burr knot tissue and the level of dogwood borer infestation (Leskey and Bergh 2005), data presented in Riedl et al. (1985) suggest that the mere presence of burr knot tissue on individual trees does not guarantee that affected trees will be attacked by the insect. The precise reasons for this are unclear, but might be related to factors such as the size of adult dogwood borer populations in the orchard vicinity and variability of within-orchard factors (e.g., temperature, humidity, and management practices) that affect the temporal and spatial occurrences of burr knot tissue and probability of dogwood borer attack. An assessment of the temporal changes in insect–host plant interaction, therefore, is needed to better understand the dynamics of localized dogwood borer populations and infestations of burr knot tissue by the insect.
It is to be expected that temporal changes in insect density in an area will be influenced by the spatial dynamics of the population (Schotzko and Knudsen 1992). As such, our understanding of the factors that could potentially influence species dynamics is usually strengthened by knowledge of the spatial structure of the population within the management unit (Strother and Steelman 2001, Tobin and Pitts 2002). Currently, however, very little is known about the spatial structure of dogwood borer populations and infestations of burr knot tissue within apple orchards.
Several approaches can be used to describe the spatial structure of plant and animal populations within defined areas (Isaaks and Srivastava 1989, Cressie 1993, Perry 1995, Dale 1998, Haining 2003). One approach that has been applied to insect populations is geostatistics (Schotzko and O'Keeffe 1989, Midgarden et al. 1993). Geostatistical analysis can provide valuable information on the spatial dependence of individuals in relation to their resources within a defined area. This information can be used in developing efficient sampling programs (Kemp et al. 1989, Schotzko and O'Keeffe 1989, Midgarden et al. 1993) and for obtaining spatially independent samples that satisfy the assumption of random sampling for the design and analysis of experimental data (Williams et al. 1992, Wright et al. 2002). In addition, knowledge of the spatial structure of the insect, or of its effects, can be used to create distribution maps to develop management support systems. Such systems may lead to optimized insecticide spray programs via spatially precise and targeted applications for current infestations, future infestations, or both within the target area. This type of spatially referenced approach to insect management, formerly referred to as precision integrated pest management (IPM) (PIPM), has been described for several insect pests (Weisz et al. 1995, Midgarden et al. 1997, Ellisbury et al. 1998, Blom and Fleischer 2001, Blom et al. 2002).
We investigated the factors associated with and their influence on the temporal pattern of dogwood borer infestations within apple orchards. The data we examined were collected as part of a larger effort to study the initiation and level of infestation by dogwood borer in two newly planted apple orchards grown under different cultural management regimes (Leskey and Bergh 2005). In addition, we use geostatistics to study the small-scale spatial variability of dogwood borer infestations so as to understand the the seasonal spatial patterns of larval populations across years.
Materials and Methods
Orchard Design.
Data on infestation of burr knots by dogwood borer larvae were collected in two experimental apple orchards located in Jefferson County, WV (Fig. 1) and Frederick County, VA (Fig. 2) from 2002 to 2004. The West Virginia orchard consisted of two 0.625-ha plots separated by a spacing of 7.6 m. ‘Gale Gala’ and ‘Sun Fuji’ trees were planted on size-controlling rootstocks in each plot in December 2001. The northern-most plot consisted of 12 rows of 20 trees planted on M.7 rootstock. Tree varieties were separated into two equal blocks consisting of 10 trees in six rows with 4.9 m between rows and 3.7 m between trees. The southwestern plot consisted of 12 rows of 30 trees planted on M.26 rootstock. Tree varieties were separated into two equal blocks consisting of 15 trees in six rows with 4.9 m between rows and 2.4 m between trees. Crabapple (Malus spp.) pollenizers were planted in both plots, which consisted of ‘Manchurian’ on M.7 rootstock planted every two trees in every other row in the northeastern plot, and ‘Snow Drift’ on M.26 rootstock planted every three trees in every other row in the southwestern plot.

Layout of the research apple orchard in Jefferson County, WV, showing rootstocks (M.7 and M.26), tree varieties (Sun Fuji and Gale Gala), and trunk treatments.
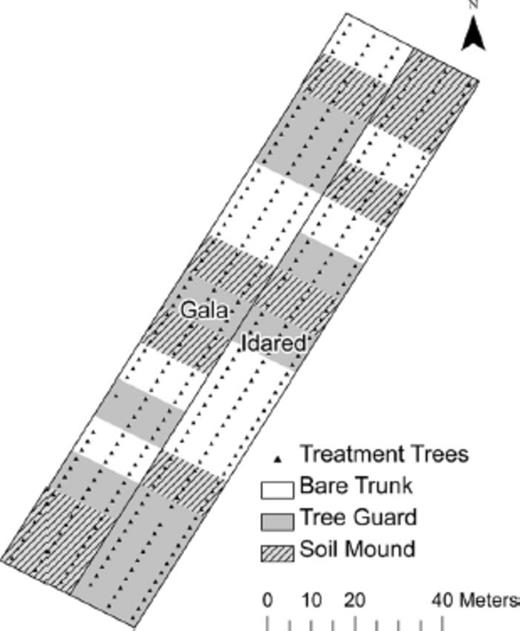
Layout of the research apple orchard planted on M.26 rootstock in Frederick County, VA, showing tree varieties (Buckeye Gala and Idared) and trunk treatments.
The Virginia orchard (Fig. 2) consisted of a 0.65-ha plot (six rows × 60 trees) of ‘Idared’ and ‘Buckeye Gala’ trees planted on M.26 rootstock in March 2002. Tree varieties were separated into two neighboring blocks consisting of 60 trees in three rows with 6.1 m between rows and 2.4 m between trees.
Orchard Management.
The orchard drive rows were mowed frequently throughout the study, and 1.2- and 1.75-m-wide herbicide strips were maintained beneath trees in the West Virginia and Virginia orchards, respectively. Disease management in both orchards was based on recommended guidelines for commercial fruit growers in the mid-Atlantic states (Pfeiffer 2004). No insecticides were applied to the West Virginia orchards during the study. The Virginia orchard received minimal insecticide inputs (four spray applications) in 2002. In 2003 and 2004, seven and nine insecticide applications were carried out, respectively, including three pyrethroid applications in 2004 to suppress damage from a severe infestation of the 17-yr periodical cicada (Magicicada spp.). None of the products used as foliar sprays to control arthropod pests in the tree canopy would be expected to reduce the infestation of dogwood borer at the base of trees.
Trunk Treatments and Infestation Surveys.
Four replicates of each of three trunk treatments consisting of bare trunk, tree guard, and soil mound were randomly assigned to groups of trees as described in Leskey and Bergh (2005). Bare trunk treatments were trees that received no protective treatment during the study, while tree guard treatments consisted of trees wrapped with a plastic spiral wrap rodent guard (OESCO, Conway, MA). Soil mound treatments were created by mounding soil around the base of trees to a point just above the graft union throughout 2002 and 2003, then removed in May 2004.
Infestation of burr knots and rooting tissue by dogwood borer larvae was evaluated based on the presence of fresh frass below the graft union at the base of each tree (Leskey and Bergh 2005). In West Virginia, the number of infested trees and the number of infestation sites per tree were recorded monthly from June to October, March to November, and May to September in 2002, 2003, and 2004, respectively. In Virginia, we recorded each tree as infested (1) or not infested (0) at approximately monthly intervals from October to November, May to October, and May to November in 2002, 2003, and 2004, respectively.
Statistical Analysis.
Data on the number of infestation sites per tree within the West Virginia orchard plots were log (y+1) transformed and analyzed by repeated measures Multivariate Analysis of Variance (MANOVA) on the three main factors (rootstock, trunk treatment, and variety), with time as the repeated measures factor (Ott and Longnecker 2001, Norman and Streiner 2008). Repeated measures MANOVA treats the response variable at each time point as a different variable and is preferred over repeated measures analysis of variance (ANOVA), especially when the sampling time points are not equally spaced (Norman and Streiner 2008), as was the case in this study. In addition, the repeated measures analysis is one of the methods that can be used to account for the possibility of pseudoreplication in the experimental design (Lazic 2010).
The repeated measures MANOVA consisted of two parts; an analysis of the between-subject effect of the three main factors (rootstock, trunk treatment, and variety) and an analysis of the within-subject effect that included the time factor (Ott and Longnecker 2001, Norman and Streiner 2008). With the between-subject analysis, we first looked for a significant interaction among the three main factors. In the absence of a significant three-way interaction, we checked for significant two-way interactions among the factors as suggested by Ott and Longnecker (2001). When a significant two-way interaction was detected, we analyzed the main effect of the factor that was not involved in the significant two-way interaction. We then analyzed each of the levels of one of the factors in the significant two-way interaction at each of the levels of the other factor, and vice versa (Ott and Longnecker 2001). The results of this analysis are presented in a 2-way table of treatments means (Mead and Curnow 1983).
For the analysis of the within-subject effect, significant time × main factor interactions were examined to determine how the patterns of infestations across time differed with respect to each of the treatments (Ott and Longnecker 2001). A sphericity χ2 test generated as part of within-subject analysis was used to check the sphericity assumption (equal variances and correlations across time in the response variable) and appropriateness of using the unadjusted univariate F-test values to determine significance. If the sphericity test was not significant, we report the unadjusted values of the F-test, otherwise the adjusted values, including adjusted degrees of freedom, are reported (Ott and Longnecker 2001, Norman and Streiner 2008). For all analyses resulting in significant differences (α=0.05), multiple comparisons of the mean responses of the factor levels were carried out by orthogonal contrast (Ott and Longnecker 2001).
For the Virginia orchard, data on the proportion of trees infested by the dogwood borer within the treatment combinations (variety and trunk treatment) and across all sampling dates also were analyzed by repeated measures multivariate analysis of variance (MANOVA). The data were arcsine square-root transformed for analysis to stabilize variances, and statistical differences were determined at α=0.05. In the absence of a significant two-factor interaction, the main effects of the factors were tested and orthogonal contrast was used for the multiple comparisons of the mean proportion of tree infested for each of the factor levels (Ott and Longnecker 2001). All statistical analyses were carried out using JMP 7.0.1 (SAS Institute 2005).
Geostatistical Analysis.
Once the semivariogram has been developed, a variogram model (e.g., spherical, exponential, Gaussian, or linear) is fitted that best describes the spatial structure of the variable. The best fit model is usually determined by the coefficient of determination (r2), residual sums of squares (RSS), or both for each of the models. (Cressie 1993, Park and Tollefson 2005b, Robinson and Metternicht 2006). The shape of a variogram model is described by three parameters, the nugget (C0), sill (C0 +C), and range (A). The nugget is the value of the semivariance at which the lag distance equals zero (i.e., where the model intercepts the y-axis of the semivariogram graph); the sill is the value of the semivariance at which the model levels off and is equivalent to the variance of the data (Farias et al. 2004); and the range is the average distance at which the semivariogram levels off, or the lag distance beyond which spatial dependence decreases. The nugget-to-sill ratio, C0 /(C0 +C), provides a measure of the degree of spatial dependence in the variable and can be used to compare semivariograms developed for different situations (Cambardella et al. 1994, Farias et al. 2004, Liu et al. 2006). Values of the ratio <0.25, 0.25–0.75, and >0.75 indicate strong, moderate, and weak spatial dependence, respectively.
The shape of the fitted variogram model also can be used to determine whether the spatial structure of the variable is uniform, random, or aggregated (Schotzko and O'Keefe 1989). In the case of an aggregated variable, for example, the semivariance is expected to increase with an increase in the separation distance between pairs of points up to some distance after which it will level off at the sill (Farias et al. 2004). The variogram model also provides information that can be used in the interpolation process known as kriging to derive estimates of the variable at unsampled locations (Rossi et al. 1992).
Spatial data usually contain two types of variation, large-scale variation (trend) and small-scale (stochastic) variation (Cressie 1993, Young and Young 1998, Bakhsh et al. 2000). A basic assumption of variogram analysis is statistical stationarity in the variable (Hamlett et al. 1986, Cressie 1993, Young and Young 1998), which requires that the mean value of the variable does not change over the sampling space. That is, the spatial system is homogeneous with no observable large-scale deterministic structure or trend in the variable. Such a trend is to be expected with the imposition of different treatments across the study area (Bresler et al. 1982, Bakhsh et al. 2000), as was the case in the current study. Therefore, it necessary to first remove any trend to model the small-scale stochastic spatial structure of the variable (Bakhsh et al. 2000).
Detrending to remove large-scale variation can be accomplished using the median polishing technique (Cressie 1993, Young and Young 1998), which iteratively removes the median from the rows and columns of the gridded data, leaving behind the residuals. The median-polished residuals represent the small-scale variation, which can be subjected to variogram analysis to study the small-scale spatial structure of the variable (Cressie 1993, Young and Young 1998, Bakhsh et al. 2000, Costa 2009). In addition, estimates of the value of the original variable at unsampled locations can be obtained by adding the kriging prediction of the median-polished residuals to the trend (Cressie 1993, Costa 2009).
For the West Virginia orchard (M.7 and M.26 plots), semivariograms were calculated separately for each of the 3 yr by using the residuals from median polishing of pooled data on the number of infested sites per tree. Pooling of the data collected over time has been shown to be an efficient method for determining spatial structure in many cases, but particularly when sample sizes are relatively small (Cressie 1993, Park and Tollefson 2005a). For the Virginia orchard, semivariograms were developed from the median-polished residuals of data on the probability of larval infestation of each tree during the season.
The r2 value of the fitted variogram model of the residuals was used to select the best model for describing the small-scale spatial structure of dogwood borer infestations within the orchard. Because no evidence of directionality was detected at 0, 45, 90, or 130°, only omnidirectional semivariograms are reported. Median polishing of the original variable was carried out using code written in Matlab 7.11 (The MathWorks Inc., Natick, MA) and geostatistical analyses were performed using GS+ 7.0 (Gamma Design Software, Plainwell, MI).
Results
Factors of Infestation and Temporal Patterns.
West Virginia Orchard. The analysis detected no significant three-factor interaction of rootstock × trunk treatment × variety (F=0.21; df=2,580; P > 0.05) on number of infestation sites per tree. As such, we proceeded first to look for significant two-factor interactions (Ott and Longnecker 2001). The only significant two-factor interaction involved rootstock × trunk treatment (F=61.76; df=2,580; P < 0.0001). Because variety was not included in the significant two-factor interaction, the effect of variety was examined alone as suggested by Ott and Longnecker (2001). The results of this analysis showed that although variety did not have a significant overall effect on the mean number of infestation sites per tree (F=3.13; df=1,590; P > 0.05), the time × variety interaction was significant (F=7.29; df=17, 10030; P < 0.0001) suggesting that the patterns of infestation sites per tree across time differed between the two varieties, Sun Fuji and Gale Gala (Fig. 3).

Temporal patterns of the mean number of dogwood borer infestation sites per tree on two varieties of apples in orchards located in West Virginia. Soil mound trunk treatments were removed in May 2004.
Because of the significant rootstock × trunk treatment interaction, each of the levels of rootstock (M.7 and M.26) was examined separately at each of the levels of trunk treatment (bare trunk, tree guard, and soil mound). The results are presented in a two-way table of treatment means for the data collected across the 18 sampling dates (Table 1). Essentially, regardless of the rootstock, the mean number of infestation sites per tree was significantly greater on trees fitted with tree guards, followed by the bare trunk treatment, and soil mound treatment. In addition, the mean number of infestation sites per tree was significantly greater on M.26 than M.7 rootstock with respect to the bare trunk (F=136.79; df=1,195; P < 0.0001) and spiral wrap tree guard (F=113.76; df=1,194; P < 0.0001) treatments. However, no significant difference between the rootstocks in the number of infestation sites per tree was observed with the soil mound treatment (F=0.006; df=1,197; P > 0.05).
Mean (± SE) number of infestation sites per tree in West Virginia apple orchards with M.7 and M.26 rootstocks and three trunk treatments
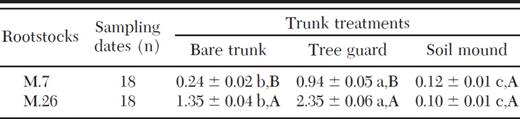
Means across each row (rootstocks) followed by the same lowercase letter are not significantly different (P > 0.05); means within each column (trunk treatments) followed by the same uppercase letter are not significantly different (P > 0.05).
Mean (± SE) number of infestation sites per tree in West Virginia apple orchards with M.7 and M.26 rootstocks and three trunk treatments
Means across each row (rootstocks) followed by the same lowercase letter are not significantly different (P > 0.05); means within each column (trunk treatments) followed by the same uppercase letter are not significantly different (P > 0.05).
The patterns of infestation by the dogwood borer across time were significantly different among the three trunk treatments on both M.7 (F=34.16; df=34, 4029; P < 0.0001) and M.26 (F=79.72; df=34, 5933; P < 0.0001) rootstocks (Fig. 4). Likewise, the patterns of infestation by the dogwood borer across time were significantly different between the two rootstocks with respect to bare soil (F=19.83; df=17, 3315; P < 0.0001) and tree guard (F=41.11; df=17, 3298; P < 0.0001) treatments, but not significantly different for the soil mound treatment (F=0.20; df=17, 3349; P > 0.05; Fig. 4).

Temporal patterns of the mean number of dogwood borer infestation sites per tree on apple trees subjected to three trunk treatments in the West Virginia orchard grown on a) M.7 and b) M.26 rootstock. Soil mound trunk treatments were removed in May 2004.
Virginia Orchard.
No significant interaction of variety × trunk treatment (F=3.42; df=2, 12; P > 0.05) was detected on the proportion of trees infested by dogwood borer during the 2002–2004 study period in the Virginia orchard. However, both variety (F=25.60; df=1, 12; P < 0.05) and trunk treatment (F=92.65; df=2, 12; P < 0.0001) alone had significant effects on dogwood borer infestation. The mean proportion of infested trees was significantly greater within the Idared variety (0.47 ± 0.03) compared with the Buckeye Gala variety (0.32 ± 0.03). Furthermore, the mean proportion of infested trees was significantly greater within the tree guard treatment (0.58 ± 0.03) compared with the bare trunk (0.45 ± 0.04) and soil mound (0.15 ± 0.03) treatments.
The significant time × variety (F=3.04; df=14,168; P < 0.001) and time × trunk treatment (F=17.74; df=28,168; P < 0.0001) interactions suggested that the patterns of dogwood borer infestation across time within the Virginia orchard differed with respect to the levels of the two main factors (Fig. 5).
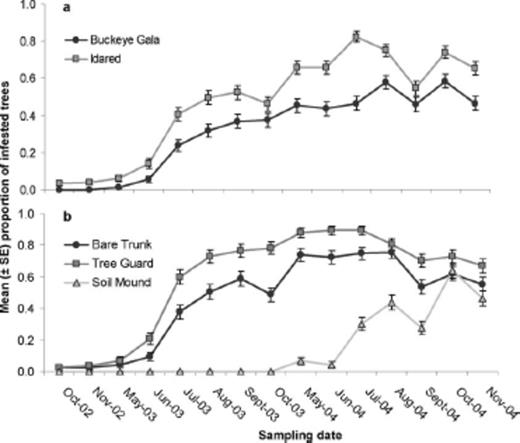
Temporal patterns of the mean proportion of trees infested by dogwood borer in the Virginia orchard in relation to a) variety and b) trunk treatment. Soil mound trunk treatments were removed in May 2004.
Spatial Pattern of Infestation
West Virginia Orchard.
The semivariograms and kriging surfaces for the median-polished residuals of dogwood borer infestation within the West Virginia orchards are shown in Figs. 6 and 7. A spherical model provided the best fit to the semivariance in both the M.7 and M.26 plots (Table 2) indicating some degree of aggregation of infestation within the orchard. No model was fitted to the M.7 2002 data because of insufficient data points. The range of spatial autocorrelation of infestations in the M.7 and M.26 plots varied from 10.2 to 12.2 m and 13.7–17.0 m, respectively (Table 2). This data suggests that the farthest distance at which infestation levels remained spatially dependent or autocorrelated was ≈13.0 and ≈17.0 m for the M.7 and M.26 plots, respectively. The nugget-to-sill ratio, C0 /(C0 +C), which provide a measure of spatial dependence ranged from 0.13 to 0.50 (Table 2), indicates strong to moderate spatial aggregation in infestation among trees at the distances and directions tested.

Omnidirectional semivariograms and kriged surfaces for the median-polished residuals of the mean number of dogwood borer infestation sites per tree in the West Virginia M.7 plot for 2003 and 2004.
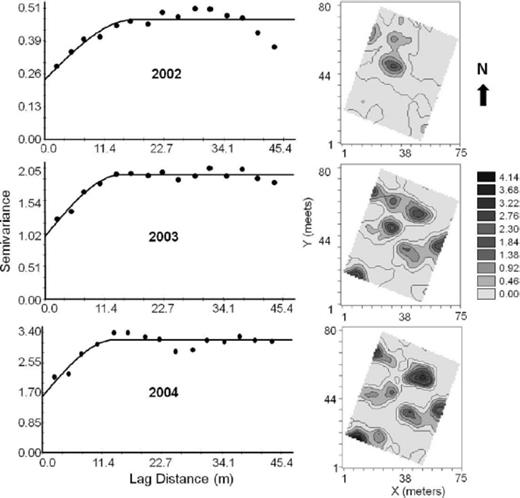
Omnidirectional semivariograms and kriged surfaces for the median-polished residuals of the mean number of dogwood borer infestation sites per tree in the West Virginia M.26 plot for 2002, 2003, and 2004.
Geostatistical description for the median-polished residuals of dogwood borer larvae infestation data in West Virginia and Virginia orchards from 2002 to 2004

Geostatistical description for the median-polished residuals of dogwood borer larvae infestation data in West Virginia and Virginia orchards from 2002 to 2004
Virginia Orchard.
The semivariograms and kriging surfaces for the median-polished residuals of the probability of trees becoming infested by dogwood borer larvae within the Virginia orchards are shown in Fig. 8. An exponential semivariogram model provided the best fit to the data, with spatial dependence in 2003 and 2004 ranging from 2.8 to 3.0 m, respectively (Table 2; Fig. 8). The nugget-to-sill ratio in both years was <0.25 indicating a strong degree of spatial aggregation in infestation among trees (Table 2).
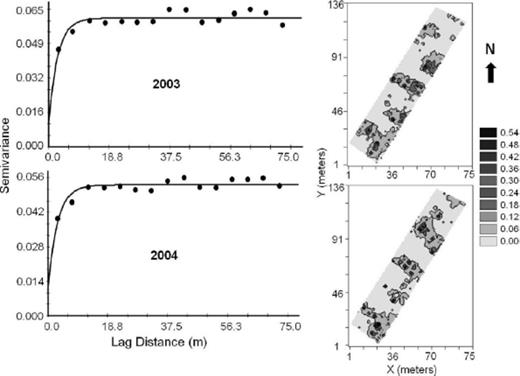
Omnidirectional indicator semivariograms and kriged surfaces for the median-polished residuals of the probability of trees becoming infested with dogwood borer in the Virginia orchard for 2003 and 2004.
Discussion
Rootstock, tree variety, and cultural management practices were significantly associated with the presence and extent of dogwood borer infestation in the apple orchards throughout the study period. In West Virginia, except for the soil mound treatment, infestation was significantly higher within the plot containing trees on M.26 rootstock compared with the M.7 plot. The number of infestation sites also was significantly greater on trees fitted with tree guards compared with other trunk treatments (Table 1). These overall levels of dogwood borer infestations of burr knot and rooting tissue also are reflected in the patterns of infestations across time (Fig. 4). In Virginia, the proportion of infested trees was significantly greater for Idared compared with Buckeye Gala varieties and for trees fitted with spiral wrap tree guards compared with other trunk treatments (Fig. 5). All of these results are consistent with previous research, which suggest that female dogwood borer preferentially oviposit near areas associated with apple burr knot tissue (Riedl et al. 1985, Warner and Hay 1985, Kain and Straub 2001, Leskey and Bergh 2005). Also, as reported by Leskey and Bergh (2005), different types of rootstock, tree variety, and management regime can affect the amount of burr knot and rooting tissue and significantly increase the levels of infestation by dogwood borer.
A feature in the patterns of dogwood borer infestation in the West Virginia orchards that should be highlighted was the rapid buildup of infestation sites during the first season in the M.26 plot on trees that received the bare trunk and tree guard treatments, and the delayed infestation until the second season in the M.7 plot (Fig. 4). It has been shown that rootstock is one of the determining factors in the formation and number of burr knots per tree (Marini et al. 2003, Leskey and Bergh 2005). A likely explanation for the difference in infestation between the rootstocks during the first season, therefore, is that trees on the M.26 rootstock not only develop more burr knots, but have the propensity to do so more quickly than do trees on M.7 rootstock. Trees on M.26 rootstock, therefore, appear to be susceptible to dogwood borer attack much earlier than trees on M.7 rootstock. Other factors, such as tree variety, also should be considered. For example, although the analysis detected no interaction between variety and rootstock in the West Virginia orchard, we might speculate from Fig. 3 that burr knots on Sun Fuji trees planted on M.26 rootstock were more susceptible initially to dogwood borer infestation than burr knots on Gale Gala trees on the same rootstock.
Another factor that may have resulted in the difference in number of infestation sites per tree between the M.7 and M.26 rootstocks in the West Virginia orchard during the first season is the location of the plots. Infestation in the M.26 plot may have been caused by the early movement into and build up of dogwood borer population from the south (Fig. 1). As such, it is possible that if the locations of the plots of the two rootstocks were reversed, with the M.7 rootstock located to the south of the orchard, the temporal patterns of infestations might be different. No data, however, are available to verify the movement pattern of dogwood borer adults into the orchards during the first season after planting.
Median polishing of the infestation data were carried out to remove the large-scale trend as a result of the different management treatments (Bakhsh et al. 2000), and to produce a new data set (the residuals), which were subjected to variogram analysis to model the small-scale spatial structure of infestation within the orchards. The range of spatial dependence or autocorrelation in infestation among the orchards was found to vary from 2.8 to 17.0 m, with a mean (±SE) of 10.24 (±1.86) m. Based on the nugget-to-sill ratios, there was a high degree of spatial dependence in infestation within the Virginia orchard (<0.25) and a moderate degree of spatial dependence within the West Virginia M.26 orchard (0.25–0.75) during the second and third seasons. Spatial dependence in infestation in the West Virginia M.7 orchard varied from strong to moderate between the two seasons (Table 2). The difference in the degree of spatial dependence between the Virginia and West Virginia orchards may be because of differences between the regions in the level of dogwood borer populations, the design of the orchards, and the susceptibility of the varieties tested to the development of burr knots and dogwood borer infestation.
Nevertheless, it appears that there was some level of aggregation of dogwood borer infestation within the orchards, which might be explained by the close proximity of susceptible trees and female moth postmating behavior. Although dogwood borer females are normally swift and active fliers, Frank et al. (2009) found during behavioral observations in the field that mated females were often observed searching for oviposition sites and ovipositing on individual rather than on multiple trees. Similar observations have been reported for other Synanthedon species. For example, Barry and Nielsen (1984) reported that S. exitiosa (Say) females generally oviposited on the same peach trees on which they were found mating, but later flew to nearby trees within the orchard. In addition, S. pictipes (Grote and Robinson) females often oviposited numerous eggs within close proximity to each other on a single peach tree host (Bobb 1959).
No directionality was observed in the spatial autocorrelation of infestation among neighboring infested trees within the orchards. This information suggests that dogwood borer females are able to locate suitable oviposition sites equally well along and across orchard rows (i.e., infestations are equally likely to spread along and across rows). In addition, the interpolated surface maps of the median-polished residuals for each orchard revealed local hot spots for each year of the study. Not unexpectedly, hot spots were generally more prevalent within tree guard treatments and were typically found where dogwood borer infestations appeared to have originated. Tree guards likely led to increased infestation rates by promoting burr knot development (Leskey and Bergh 2005) and perhaps by offering developing larvae protection from desiccation and natural enemies (Bergh and Leskey 2003). As expected, areas with the lowest levels of infestation throughout the study occurred in the vicinity of the soil mound treatments. Leskey and Bergh (2005) indicated that soil mounds appeared to promote undesirable horticultural effects in these trees as a result of scion rooting and that mounds were difficult to maintain. Furthermore, after the removal of soil mounds in 2004, the trees developed a large amount of rooting tissue, which provided a suitable habitat for subsequent infestation by larvae.
An understanding of the spatial dependence of dogwood borer infestations is an important first step for developing accurate and efficient sampling plans for larvae and for developing the design of experiments (Williams et al. 1992). To obtain unbiased estimates of population totals, independent samples must be taken at random so that every sample location has an equal chance of being selected (Pedigo 1999). Because of the aggregated nature of dogwood borer infestations, random, independent samples only can be obtained at distances greater than the range of spatial dependence to ensure that these samples are not autocorrelated. It is clear from the results that the distance between sample points will vary depending on the age of the orchard at which sampling is conducted.
Alternatively, an efficient sampling program for mapping dogwood borer infestation can be achieved by limiting sample points to distances within the calculated range of spatial dependence. An understanding of the sampling distances required to assess larval populations can lead to a reduction in the number of samples needed within an orchard while maintaining the accuracy and precision of sample data. The sample points also can be used in interpolating algorithms, such as kriging, to predict infestation at unsampled locations in space. The interpolated surface maps could then be used in a dogwood borer management program to indicate areas where larval infestations are more likely to occur, where scouting should begin, and where management intervention is necessary. Currently, dogwood borer populations in apple orchards are mainly controlled using truck drench applications of the organophosphate insecticide chlorpyrifos. The development of this type of site-specific management (Weisz et al. 1995, Midgarden et al. 1997) offers the advantage of limiting the amount of insecticide used within an orchard, as well as the time and labor involved with its application, by targeting sprays at potential hot spots or aggregated infestation sites. Furthermore, understanding the arrangement and pattern of infestations may offer clues for development of alternative management strategies for dogwood borer control.
We thank the technical support provided by S. Wright, T. Hancock, and J. Engelman. This research was supported in part by a grant from the Virginia Agricultural Council.
References
