


Abstract
The temporal and spatial patterns of adult stable fly, Stomoxys calcitrans (L.), emergence from six sites where large round baled hay had been provided to pasture cattle as winter feed were studied using emergence traps. The substrate at these sites, consisting of waste hay mixed with bovine manure and urine, provided an excellent developmental habitat for immature stable flies. Stable flies were the most frequently collected fly emerging from these sites with a yearly average of 1,581 emerging per square meter. Stable fly emergence from these sites began in early May (235 annual accumulated Day-Degree 10°C [DD10]), peaked in late June and early July (400-900 DD10) and then dropped to very low levels in late July (>900 DD10). The temporal pattern of stable fly emergence from the hay feeding sites differed from that of adult populations measured with sticky traps. Adult populations increased in the spring before significant emergence from the hay feeding sites was observed, dipped in midsummer soon after the hay feeding sites became nonproductive, and then rebounded in the late summer when emergence from the hay feeding sites was very low. The drop in productivity of the hay feeding sites appeared to be because of endogenous factors associated with decomposition of the substrate rather than temperature or precipitation. Winter hay feeding sites appear to be primary sources of stable flies during the early summer, however, they are not responsible for late summer and fall stable fly populations. Overall, the inner most 2-m annulus of the hay feeding sites was the most productive, however, spatial variation among sites was observed. The sex ratio of emerging flies did not differ from 1:1 and the temporal pattern of emergence was similar for males and females. Although several other species of flies were collected emerging from the hay feeding site substrate, house flies (Musca domestica L.) were notably absent.
Stable flies, Stomoxys calcitrans (L.) (Diptera: Muscidae), are primary pests of livestock, especially cattle, throughout much of the world. Their persistent blood feeding behavior and painful bites reduce the productivity of cattle in the United States by more than $2 billion per year (D.B.T., unpublished data). Traditionally, stable flies were considered to be primarily pests of confined cattle with their larval developmental sites being associated with barn yard accumulations of manure and other organic materials. During the last 25 yr, stable flies have been observed infesting pastured cattle frequently (Hall et al. 1982, Campbell et al. 2001, Broce et al. 2005).
Sites where hay has been fed to cattle during the winter are primary sources of stable flies infesting pastured livestock (Broce et al. 2005). In the central Great Plains, producers typically begin feeding hay to pasture cattle in November and December using large round bale feeders (Broce et al. 2005). Feeders are placed in locations with convenient winter access and often are not moved during a winter feeding season. As cattle feed, 40% or more of the hay can be dropped on the ground surrounding the feeder and wasted (Talley et al. 2009). As the animals congregate at the feeders, urine and manure combine with the waste hay to make an ideal substrate for stable fly larval development (Talley et al. 2009). Accumulations can exceed 25 cm in depth (Broce et al. 2005, Talley et al. 2009) and typically extend 7–10 m from the feeder (unpublished observations). As forage becomes available in the spring, the feeders are usually removed and the sites are abandoned. By the time the process is repeated the following year, decomposition and spreading, either by the producer mechanically cleaning the site or livestock activity, usually erase all remnants of the previous year's accumulations. Hay feeding sites are often relocated each year to allow the previously used sites in the pasture to recover. Because the formation of these sites is initiated after stable flies have ceased to be active in the fall, they cannot be considered overwintering sites and must be colonized by ovipositing females in the spring each year.
Broce et al. (2005) observed densities of 1,600–19,600 stable flies per m2 in hay feeding sites ranging in size from 13 to 262 m2 in northeastern Kansas and suggested that such sites were primary sources of stable flies in surrounding pastures. The purpose of this study was to examine the phenology of stable fly larval development in winter hay feeding sites in eastern Nebraska. Objectives were to characterize the temporal and spatial patterns of stable fly emergence from the hay feeding sites and relate the temporal pattern to adult stable fly populations and climatic variables.
Materials and Methods
Study Area.
Studies were conducted from 2005 through 2008 at the University of Nebraska, Agricultural Research and Development Center (ARDC) located near Ithaca, NE (Fig. 1). The center encompasses a dairy, two feedlots, and ≈4,000 ha of fields devoted to crop production and pastures for beef cattle grazing. Land use and management practices at the ARDC are representative of the central Great Plains. In winters between grazing seasons, the resident cow-calf herd is routinely fed hay from round bale feeders. This practice produces feed debris piles that consistently become stable fly larval developmental sites when the weather warms each year (Taylor et al. 2010).
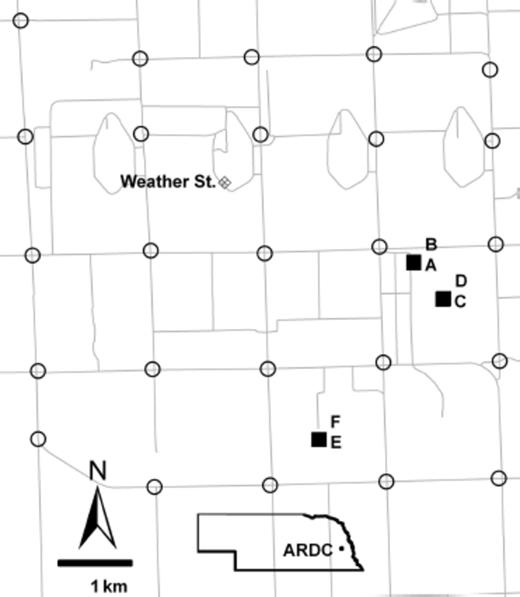
Map of the University of Nebraska, Agricultural Research and Development Center, Ithaca, NE (ARDC). Solid squares indicate the hay feeding sites sampled. A and B were sampled in 2005, C in 2006, D and E in 2007, and F in 2008. Open circles indicate locations for the 25 adult sticky traps. The cross-hatched diamond indicates the MEADAGROFARM weather station.
Emergence Traps.
Emergence traps were screen pyramids with 0.5 × 0.5 m bases constructed of 3.8 × 8.9 cm (2” × 4”) lumber. An inverted 100-ml plastic beaker with its bottom removed was attached to the apex of the pyramid with construction glue. Collection containers were made from 16-ounce (≈ 500-ml) clear plastic deli containers. A second 100-ml beaker with its bottom removed and replaced with a screen cone with a 0.8-cm hole was inserted into a hole cut into the bottom of the deli container and affixed with hot glue (Fig. 2). Collection containers were placed so that the two beakers were stacked. This design facilitated removal and replacement of collection containers.

Emergence trap collection container (above) and schematic of complete emergence trap (below).
In 2005, a skirt constructed of 10 gauge sheet metal plates 25 cm × 0.5 m welded at the corners was attached to the base of the emergence traps with screws. A spade was used to cut the hay feeding site substrate permitting us to place the traps with the metal skirt firmly seated in the ground beneath the residue. The metal skirts prevented movement of stable fly larvae into and out of the substrate enclosed by the traps once they were installed.
The metal skirts were constructed as a separate unit for 2006–2008. A shelf 5 cm below the top edge of the metal skirt was welded between adjacent sides at each corner to support the trap that fit snugly within the skirt to prevent the entry or escape of flies once traps were installed. A steel cutting tool, the same size as the metal skirts, was driven into the substrate with a post driver. The trap frame was inserted into the cut and firmly seated in the soil beneath the hay and manure residue. Frames were removed with a T-post puller and chain attached to loops welded to the corners of the frames.
Hay feeding sites were divided into three radial annuli. Annulus 1 extended 2 m from the outer edge of the hay feeder. Annuli 2 and 3 each extended an additional 2 m outward. One trap was placed in each annulus each week. Traps were left in place for a minimum of 6 wk before being rotated to new positions. Positions were randomly selected using a random number generator to determine direction and distance from the center of the hay feeding site.
Emergence traps were serviced once or twice per week by replacing the collection containers with clean ones and returning containers with flies to the laboratory for processing. In the laboratory, flies in containers were killed by freezing, then counted and sexed.
Emergence trapping was initiated each year as early as possible, but the date was dependent upon when adequate forage was available in the pastures to allow us to exclude the cattle from the hay feeding sites (Table 1).
Trapping dates for each site with number of stable flies collected and sex ratio
Degree-day 10°C (DD10) represents the middle of the 1 wk collection period.
Median > 1.
1 stable fly was collected on 29 April (65 DD10) during first collection after trap installation. This fly may have been an adult on the surface of the substrate when the trap was installed. Because of the extremely early date and the fact that no other flies were collected during the subsequent 4 wk, this fly was excluded from further analyses.
Julian date.
Adult Traps.
Sticky traps were 30-cm-diameter and 30-cm-tall cylinders of Alsynite fiberglass (Alsynite Roofing Products Co. Ltd., Shanghai, China) (Broce 1988) staked with tops at 1 m above ground in sunny locations. Traps were arranged in a grid at 1.6 km intervals along section roads within ARDC for a total of 25 traps (Fig. 1). Traps were serviced twice per week from May through September and then once per week from October through April. Trap design and locations were the same as those used by Taylor et al. 2007.
Meteorological Data.
Records of hourly precipitation, air temperature, soil temperature at 4-in. (10-cm) depth, wind direction, wind speed, humidity, and radiation flux during the four study years were obtained from the High Plains Regional Climate Center (University of Nebraska, Lincoln, NE) MEADAGROFARM station, located approximately in the center of the ARDC property (41.17° N, 96.47 W°, Fig. 1). Degree-days-10°C (DD10) were based upon hourly temperatures. All DD10 calculations are based upon air temperature except where explicitly stated otherwise.
Statistical Analysis
Quantitative Patterns.
Preliminary analyses of trap counts indicated that the data were over-dispersed. We therefore opted to use the Negative Binomial distribution (proc Genmod, SAS Institute 2008). Week of collection, site, annulus within site, and sex were considered categorical main effects. The initial regression model included the main effects and each of their interactions. Variation in the sex ratio of emerging stable flies was evaluated by examining the interaction of sex with week, site, and annulus.
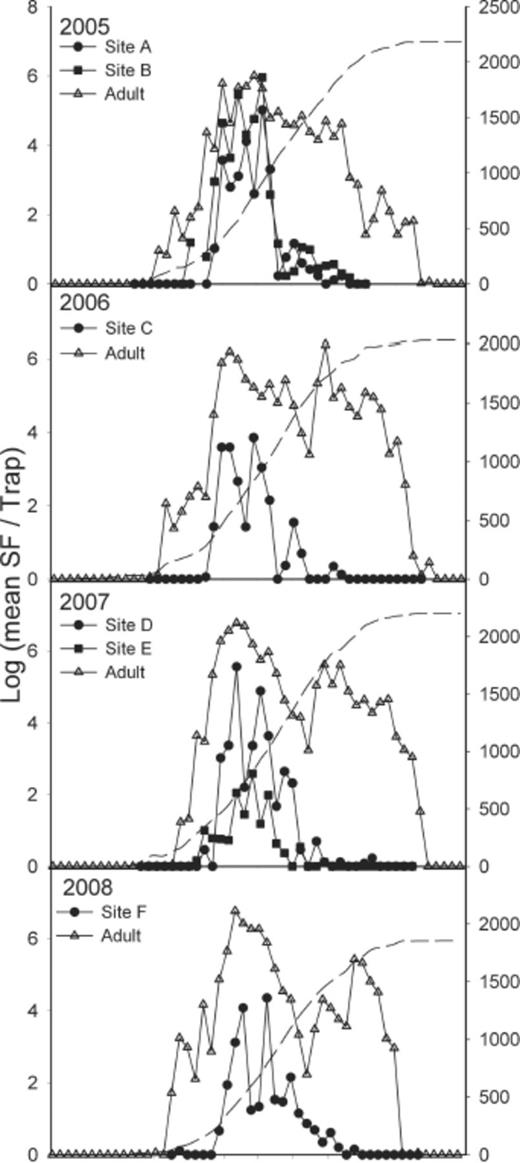
Because the emergence traps were designed to exclude ovipositing female flies and were maintained in place for longer than the 232 DD10 immature developmental period of stable flies (Lysyk 1993), those flies emerging >232 DD10 after installation took longer than expected to develop. To examine the effect of the interval between trap placement and collection on the number of emerging stable flies and their sex ratio, we divided trap collections into three classes based upon the number of DD10 between trap placement and the beginning of the collection period during which they were collected, ≤ 232, 233–464, >465 DD10. Interval was treated as a categorical variable. The effect of interval and the interaction between interval and sex were tested.
Temporal Patterns.
Temporal distribution of the adult sticky trap and emergence trap catches relative to annual cumulative DD10 were characterized as being polymodal and therefore not suitable for parametric analysis. The nonparametric Kolmogorov–Smirnov Test (Proc univariate, SAS Institute 2008) was used to evaluate differences in the empirical distribution functions of adult sticky trap and emergence trap collections as well as differences in the temporal pattern of stable fly emergence relative to years, sites, sex, and annuli.
Climatic Models.
Degree-day models based upon 0, 5, 10, and 15° thresholds for air temperature and soil temperature four inches (10 cm) below the surface were compared for their ability to predict the dates of the first stable fly emergence, start of significant emergence, and peak emergence. Significant stable fly emergence was defined as the median trap collection exceeding one fly (more than one-half of the traps collecting ≥1 stable fly). The date of the first peak was considered peak emergence even though a second higher peak was observed later in the season some years. Goodness-of-fit for the degree-day models was evaluated by comparing the mean squared deviations (Kobayashi and Salam 2000, Faust and Weston 2009) between the actual and predicted Julian dates for each event on each of the six sites. Day-degree accumulations and Julian dates for the midpoints of the 7-d collection periods during which the events occurred were used to develop and test the models.
The effects of climatic variables on the temporal pattern of emergence trap collections were examined on two timescales, Julian weeks and DD10 intervals. Counts were allocated to DD10 intervals and Julian weeks by equally partitioning them among days within the trapping interval and then resummarizing by DD10 interval or Julian week. Log transformed counts (log[c+1]) were averaged across sites, annuli, and traps for each interval. For weekly summaries, week 1 began on 2 January 2005, 1 January 2006, 31 December 2006, and 30 December 2007. Fifty and 100 DD10 intervals were used for the degree-day summary.
Climatic relationships were evaluated with cross-correlation maps (Curriero et al. 2005, Taylor et al. 2007) and regression models (Taylor 2007). Cross-correlation maps were constructed with the same methodology as Taylor et al. (2007). Pearson Product Moment correlations were calculated for mean-log trap counts and mean temperature or daily precipitation during intervals lagged 0–15 interval periods before the collection interval (Y axis). For the X-axis, the initial lagged interval plus 0–15 subsequent intervals were averaged for the calculation of the correlation coefficients. Cross correlation maps were used to identify the lag period and duration of climatic conditions with the highest correlation with emergence trap collections.
A regression model was developed to explain the relationships between climatic variables and the temporal pattern of stable fly emergence trap collections by regressing mean log(c+1) against mean temperature and precipitation for the intervals identified to have the greatest correlation with trap catch in the cross-correlation mapping analysis. Preliminary analyses indicated that the serial trap catch data were positively auto-correlated (Proc Autoreg, SAS Institute 2008). The appropriate order level for the autoregressive model was determined with stepwise autoregression (Proc Autoreg).
Results
During the 4 yr of this study, 57,112 stable flies were collected in emergence traps on six winter hay feeding sites representing 3,435 trap weeks (Table 1). Overall collections averaged 16.63 stable flies per trap per week (range, 0–1,456). Adjusting for the unequal number of traps employed each week, the weekly average trap collection was 11.98. Based upon this figure and that traps were monitored for a total of 132 wk or ≈33 wk per year, the hay feeding sites produced an average of 1,581 stable flies per square-meter per year.
Stable flies were the most frequently collected flies in the emergence traps making up 80% of the total. Other flies collected in order of decreasing abundance were Syritta pipiens (L.) (Syrphidae) 11.5%, Scathophaga stercoraria (L.) (Scathophagidae) 2.9%, Adia cinerella Fallén (Anthomyiidae) 1.6%, Eristalis tenax (L.) (Syrphidae) 1.5%, Sepsis spp. (Sepsidae) 1.0%, Euxesta sp. (Otitidae) 0.9%, Psychoda sp. (Psychodidae) 0.6%, Leptocera vagans (Haliday) (Sphaeroceridae) 0.2%, and unidentified Muscidae 0.2%. Most notable was the absence of house flies, Musca domestica L., in the emergence trap collections. Among the 136 muscid flies collected, none were house flies. Undoubtedly other smaller flies such as Sciaridae were present in the hay feeding site substrate, however, the emergence traps were not designed to capture them and they could have easily escaped through the screen mesh.
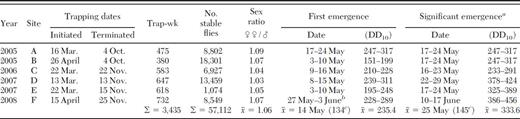
The earliest a stable fly was collected in an emergence trap was 10 May 2005 (week 18). Emergence trap collections remained low and sporadic until the third week of May (week 20, |$\bar x$|=0.35 per trap-week [range 0–58]) and then rose rapidly to a peak during the last three weeks of June and second week of July (weeks 24–28, |$\bar x$| = 55.7 per trap-week [range 0–1456]). Emergence collections declined in the second half of July through mid-September (weeks 29–37, |$\bar x$|=2.6 per trap-week [range 0–351]) when they became very low and sporadic until the latest fly was collected on 23 October in 2007 (week 43, |$\bar x$|=0.05 per trap-week [range 0–3]; Fig. 3).
Weekly emergence and adult trap collections for 2005–2008. Solid symbols indicate emergence trap collections and open triangles indicate adult collections on sticky traps. All data are weekly mean log(c+1). Dashed line indicates annual cumulative DD10.
Only weeks 20–37 were included in the negative binomial regression analyses to avoid small counts and an excess of zero values. Truncating the data set eliminated 141 stable flies or 0.2% of the total collected. Although female flies predominated in collections from all six sites, the sex ratio did not differ from 1:1 (χ2=0.03; df=1; P < 0.86; Table 1). Sex ratios were consistent among sites (χ2=0.18; df=5; P=0.99), annuli within sites (χ2=0.17; df=2; P=0.92), and among weeks (χ2=2.19; df=17; P=1.00).
Fewer stable flies emerged in traps that had been in place for >232 DD10 (χ2=203.66; df=2; P < 0.01) than in traps that had been in place for ≤232 DD10. However, significant numbers of stable flies were still collected in traps after 232 DD10 (Fig. 4). Overall, 26% of the flies were collected >232 DD10 after trap placement and 2.6% > 464 DD10 after trap placement. Sex ratio did not vary among the flies emerging in the three intervals after trap placement, ≤232, 233–464, and >464 DD10 (χ2=1.15; df=2; P=0.56). Because sex ratio did not vary in relation to the other variables, male and female flies were pooled for the remainder of the analyses.
Empirical distribution function for stable fly emergence trap catch relative to time since the trap was installed in cumulative DD10 (232 DD10=74 percentile).
Spatial Patterns of Emergence.
Because fewer stable flies emerged in traps that had been in place for >232 DD10, those collections were excluded from the spatial and temporal analyses. Stable fly emergence counts varied among the six sites monitored during the 4 yr of this study (Table 1; χ2=93.11; df=5; P < 0.01). The number of stable flies collected varied among traps located in the three radial annuli (χ2=53.85; df=2; P < 0.01), but the pattern of variation was not consistent among the six sites (χ2=42.10; df=10; P < 0.01; Fig. 5).
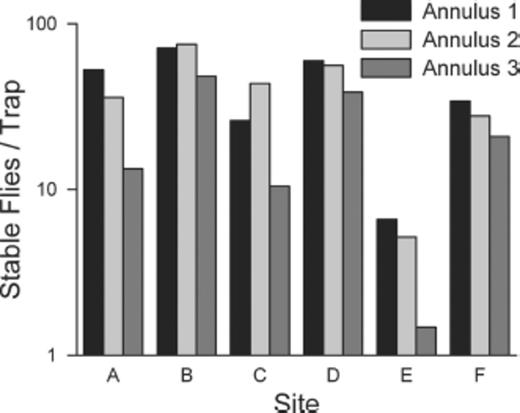
Mean number of stable flies collected in emergence traps located in concentric 2 m wide annuli radiating from center of hay feeding sites.
Initial Oviposition.
Emergence traps were designed to exclude ovipositing females and the frames were seated in the soil below the substrate interface to preclude the entry of migrating larvae. Thus, the traps were designed to sample only what was in the enclosed substrate at the time they were placed in the field. In 2005, 2006, and 2007, initial traps were placed in mid March (Table 1). Emerging stable flies were first collected on 10 May in 2005, but significant emergence (median >1) was not observed until 24 May. Traps placed before 12 April failed to collect any adult flies, but were relocated prior the initiation of significant emergence on 24 May. Eight adult stable flies were collected from the three traps placed on 12 April indicating that immature stable flies were present in the substrate at that time. In 2006 and 2007, initial traps were left in place until after median trap collections ≥1. Stable flies emerged in all of the initial traps installed those two years (Table 2). Low temperatures during the interval between trap placement and stable fly emergence dropped to well below freezing and daily high temperatures were near freezing for at least one day during the interval both years.
Mean no. of stable flies emerging in the earliest traps placed on hay feeding sites in 2006 and 2007 with high and low temperatures during the interval between trap placement and first emergence
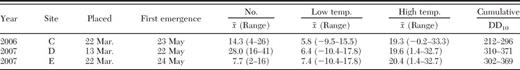
Annual cumulative DD10 for the beginning and end of the collection period during which the first flies were observed are indicated as well. 3 traps per site.
Mean no. of stable flies emerging in the earliest traps placed on hay feeding sites in 2006 and 2007 with high and low temperatures during the interval between trap placement and first emergence
Annual cumulative DD10 for the beginning and end of the collection period during which the first flies were observed are indicated as well. 3 traps per site.
Temporal Pattern of Emergence.
Emergence trap catches were bimodal relative to annual cumulative DD10. Average time for first emergence was 235 DD10 (Table 1). The primary emergence peak occurred at 419 DD10 and a secondary, smaller, peak occurred at 777 DD10 (Fig. 6). Of the total stable fly catches from the emergence traps, 93% were collected between 300 and 900 annual cumulative DD10, 2% were collected earlier, and 5% later. Male and female stable flies exhibited similar temporal patterns of emergence from the hay feeding sites (KS D=0.01; P=1).
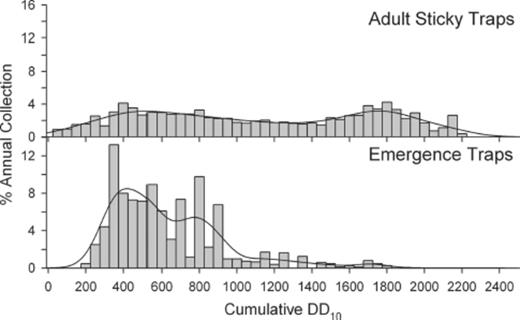
Seasonal distribution of adult sticky trap and emergence trap collections. Vertical bars indicate the percentages of annual trap collections recovered during 50 DD10 intervals for 2005–2008. Line indicates nonparametric kernel density estimate.
The temporal pattern of adult collections on sticky traps and emergence trap collections from the hay circles differed (KS D=0.44; P < 0.01). The average DD10 for collecting the first adult on a sticky trap was 40 (range, 18–95) during the 4 yr of this study. Whereas the average DD10 for the first flies to be collected in the emergence traps was 235 (range, 175–282). The timing of the first peak for the emergence trap catches preceded the first peak for the sticky trap collections by ≈100 DD10, 419 versus 519 DD10. The second smaller emergence trap peak occurred while the first adult peak was declining. Emergence trap collections from the hay circles declined to low levels around 900 DD10, whereas adult fly catches on sticky traps dipped from around 900–1300 DD10 and then rebounded with a second peak at ≈1800 DD10 before slowly declining until disappearing after prolonged subfreezing nights.
Climatic Model.
Comparison of day-degree models based upon threshold temperatures of 0, 5, 10, and 15°C for air and soil temperature at 10 cm depth indicated that the date of first stable flies emergence from hay feeding sites was best predicted by air temperature with a 5°C threshold (Table 3). First emergence occurred at 462.6 ± 63.4 DD5. The more commonly used DD10 had a value of 235.4 ± 41.2 for first emergence. The day range for the mean ± the standard deviation was ≈10 d for both models. Models with lower temperature thresholds performed better than those with higher thresholds for predicting the initiation of significant emergence and the date of peak emergence (Table 3). Cumulative day-degree models based upon soil temperature at 10 cm depth with a 0°C threshold resulted in the best fit with the observed data with 974 soil-DD0 for significant emergence and 1160 soil-DD0 for peak emergence. Equivalent DD10 values were 334 and 419 respectively.
Goodness-of-fit statistics for degree-day models estimating the dates for the first stable fly emergence from hay feeding sites, significant emergence (median trap collection > 1), and first emergence peak
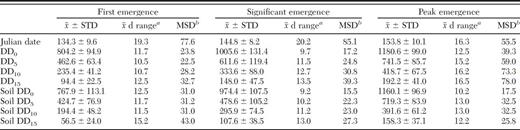
Mean no. of d within x macr;± STD range.
Mean squared deviation between actual and predicted dates.
Goodness-of-fit statistics for degree-day models estimating the dates for the first stable fly emergence from hay feeding sites, significant emergence (median trap collection > 1), and first emergence peak
Mean no. of d within x macr;± STD range.
Mean squared deviation between actual and predicted dates.
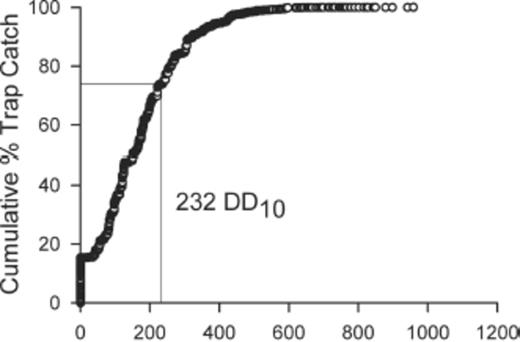
The highest levels of correlation between emergence trap collections and antecedent temperature and precipitation were achieved using 100 DD10 intervals (Fig. 7). Mean temperature 400–800 DD10 before collection exhibited the greatest correlation with mean trap-day catches (R=−0.854). A positive correlation between trap catches and mean temperature 1,000–2,300 DD10 earlier was observed (R=0.660). Relative to the time of primary stable fly emergence in early summer, the interval corresponding to 1,000–2,300 DD10 encompassed late summer and fall of the previous year. Mean daily precipitation 300–600 DD10 before collection was positively correlated with trap catches (R=0.470) whereas mean daily precipitation 1,200–2,100 DD10 before collection was negatively correlated with trap catch (R=−0.444). Again, the latter encompassed late summer and fall of the previous year. Correlations of trap catches with temperature and precipitation based upon Julian week intervals were lower than those observed with 100 DD10 intervals. Mean temperature the week of collection had the highest positive correlation with trap catches (R=0.437) and mean temperature 15–30 wk before collection had the highest negative correlation (R=−0.575). Mean daily precipitation 2–6 wk before collection had the highest positive correlation with trap catches (R=0.275) and mean precipitation 15–30 wk before collection was negatively correlated with trap catch (R=−0.474).
![Cross-correlation maps for mean emergence trap collection per trap-day (ln[c+1]) relative to temperature and precipitation 0–15 intervals before the collection interval with durations of 0–15 subsequent intervals. Lag of the starting interval is on the y-axis and number of subsequent intervals averaged with the starting interval is on the x-axis. Intervals are 50 DD10, 100 DD10, and Julian weeks.](https://oup.silverchair-cdn.com/oup/backfile/Content_public/Journal/ee/40/2/10.1603_EN10245/1/m_ee-40-2-0184-fig7.jpeg?Expires=1747968379&Signature=j6Pv8o60bK-Z7ZWL0dWBwRtEwchQxUmqjjc6DoxCWIy~95CyDQho2iUI~QHSZGCMxkXwd5iS-9iaWD2naWy3NfqVb0wfEenaH3t1vwbnsbXdYvH6rbPfYUUB9XHKCqeuqFTaxnVbrcgnx3g0foiR-hj6~gLxQcl7TNOCN~ClA3WwIwx16bRVOSQ4mX3-BTqpZdkK2skhv5zMsGxy7abwnrn9VS8l7TBDepusy3DpwKNrhuD~zMPi9vw~uv70T88NV8eKRK8xRzvdsbV2cAIKkQz3DQXpdJm-tjVuK5mYhnlUEr0k90XPw--5gRB5EaOAktafmR~zSquBz6B9OO1VkA__&Key-Pair-Id=APKAIE5G5CRDK6RD3PGA)
Cross-correlation maps for mean emergence trap collection per trap-day (ln[c+1]) relative to temperature and precipitation 0–15 intervals before the collection interval with durations of 0–15 subsequent intervals. Lag of the starting interval is on the y-axis and number of subsequent intervals averaged with the starting interval is on the x-axis. Intervals are 50 DD10, 100 DD10, and Julian weeks.
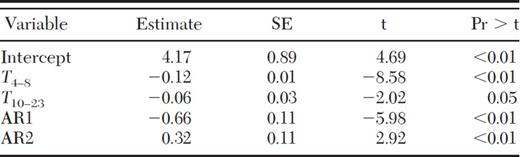
Because the highest correlations between trap catch and climatic variables were observed with 100 DD10 intervals, we used those data to develop a regression model to examine the relationships between emergence trap catch rates and antecedent temperature and precipitation. The emergence trap catch data were serially autocorrelated (Durbin–Watson [DW] Statistic=0.98, P < 0.01). During this 4-yr study, mean annual cumulative DD10 was 2,048 (SD=163.8, Range 1837–2182) resulting in ≈21–100 DD10 intervals per year. To test for autocorrelation of high order lags because of seasonality, we examined lags 1–30 using Yule-Walker method (Proc Autoreg, backstep option). Significant autocorrelation was detected in lags one and 2. Portmanteau test statistics and the Engle Lagrange multiplier tests for autoregressive conditional heteroskedasticity were not significant for lags 1–12 (Proc Autoreg, ARCH option). Four parameters, mean daily temperature 400–800 and 1,000–2,300 DD10 before collection and precipitation 300–600 and 1,200—2,100 DD10 prior, were identified in the cross-correlation maps as having the highest correlations with mean trap catch and were included in the model. The estimated coefficient for precipitation 300–600 DD10 before collection (t=−0.10, df=1, P=0.92) and precipitation 1,200–2,100 DD10 before collection (t=−0.79, df=1, P=0.43) did not differ from zero and were therefore eliminated from the final model (Total R2=0.83; Table 4).
Regression of emergence trap catches against antecedent 100 DD10 intervals for temp (T) and Precipitation (P). AR1 and 2 are autoregressive parameters. (N=100, Regression R2=0.65, Total R2=0.83, AIC=8.72)
Regression of emergence trap catches against antecedent 100 DD10 intervals for temp (T) and Precipitation (P). AR1 and 2 are autoregressive parameters. (N=100, Regression R2=0.65, Total R2=0.83, AIC=8.72)
Discussion
Winter hay feeding sites are very productive habitats for the development of immature stable flies. The six sites used for this study produced an average of 1,581 adult stable flies per square-meter. Sites varied from 150 to 250 m2 in area resulting in production levels of 200–400,000 stable flies per site. These densities are somewhat lower than those reported by Broce et al. (2005), however, their sampling was not random and we have observed much higher densities of immature stable flies in hay feeding sites as well (unpublished data). Producers frequently will have several hay feeding sites in each pasture giving these sites the potential to produce large numbers of stable flies.
Emergence of stable flies in traps placed in hay circles as early as mid March 2006 and 2007 indicated that the eggs were already present at that time. The first adult stable flies were collected on sticky traps on 5 and 19 April, 2006 and 2007, respectively. Thus, flies were active, and ovipositing, nearly a month before adult flies were detected on sticky traps. Previous studies have shown that stable flies are active in eastern Nebraska at low levels throughout the winter months (Berkebile et al. 1994). Unfortunately, we were unable to place traps on hay feeding sites earlier than mid-March because of cattle herd management issues. Although it is possible that stable fly larvae may have gained access to the substrate enclosed by the traps by burrowing under barriers, we feel this is highly unlikely. We have examined the vertical distribution of stable fly larvae in hay feeding site substrate and found 91% of the larvae to be in the upper 5 cm and no larvae were ever found below 10 cm (unpublished data). Studies incorporating periodic collection of substrate samples in late winter and early spring for laboratory detection of immature stable flies to verify dates and climatic parameters for initial oviposition in hay feeding circles are planned.
The earliest stable fly emergence from the hay feeding sites occurred at ≈235 DD10. This correlates well with the 232 DD10 required for the development of immature stable flies to adulthood (Lysyk 1993) and also substantiates the presence of the eggs in the substrate at the beginning of DD10 accumulation. Day-degree models with a lower threshold of 10°C have been used primarily for interpreting stable fly population dynamics and phenology. That choice has been based upon the lower developmental threshold for stable fly being 13°C (Larsen and Thomsen 1940, Lysyk 1993). Our results consistently indicated that day-degree models with lower thresholds were better able to predict the timing of early season phenological events. A possible explanation is that temperatures below 10°C are warm enough to permit thawing and aging of the hay feeding substrate. Even though these temperatures are too low for larval development, prior thawing and aging of the substrate may permit earlier oviposition and development once critical temperatures are surpassed. Recognition of this phenomenon may assist the development of life-history models for this species. The generality of these findings need to be verified with data from additional years and by characterizing the timing of these events in climatically different zones.
The temporal pattern of stable fly emergence from hay feeding sites correlates with the primary peak of adult abundance indicating that they are primary sources of flies in the early summer. These data support the contention of Broce et al. (2005) that winter hay feeding sites are primary contributors to the increasing numbers of stable flies observed to be infesting pastured cattle. However, adult stable fly populations begin to increase 4–6 wk (Fig. 3) or nearly 200 DD10 before emergence from the hay feeding sites begins in the spring (Fig. 6). This data indicates that early season flies are developing in locations other than hay feeding sites. The source of these flies remains unclear. Stable flies do not diapause (Greene 1989) nor do they have a freeze tolerant stage in their life cycle (Beerwinkle et al. 1978, Jones and Kunz 1997). Overwintering stable fly larvae have been observed in heat generating substrates such as silage (Scholl et al. 1981) and occasional adults have be observed on traps, even in mid winter (Berkebile et al. 1994). Continuous breeding, possibly in climate controlled environments such as dairies or heated barns (Beresford and Sutcliffe 2009), and overwintering are a potential sources for the early season flies, however, finding overwintering flies has proven to be very difficult. Jones et al. (1999) postulated that stable flies passively migrate long distances on frontal systems, permitting southern populations to recolonize the northern portions of their range each year.
The primary peak of stable fly emergence observed at 419 DD10 continues to represent the first generation because an inadequate number of DD10 passed since first emergence (<200) for a second generation to complete development. The secondary peak observed at 777 DD10 appears to represent a second generation in the hay feeding sites. The time between the primary and secondary peaks ([mac]x=358 DD10) is greater than the 258 DD10 observed between generations by Lysyk (1993). This may be because of overlapping generations with the end of the first generation obscuring the beginning of the second.
Although small numbers of stable flies continue to emerge from hay feeding sites through October, >95% of the stable flies emerge before 900 DD10. The climatic modeling portion of this study failed to identify climatic factors responsible for the nearly complete cessation of stable fly development in the hay feeding sites. Precipitation had no significant effect on emergence and the significant temperature parameters 4–8 and 10–23 100 DD10 intervals before collection date represent early spring of the current year and the previous summer relative to the decline in productivity at 900 DD10. The observed correlations between stable fly emergence levels from hay feeding sites and temperature and precipitation the previous year are probably the result of the events being seasonally consistent from year to year rather than biological interactions. This observation implies that the reduction is not because of exogenous factors such as temperature or moisture, but because of endogenous factors, most likely changes in the physical characteristics and bacterial communities in the substrate as a result of decomposition. Bacteria are required for stable fly larvae to complete their development (Lysyk et al. 1999, Romero et al. 2006) and fecal coliform bacteria concentrations are greatly reduced in hay feeding site substrates after their decline in fly productivity (Talley et al. 2009). In addition, many of the properties of bovine manure change with decomposition and aging (Broce and Haas 1999). Temporal patterns of stable fly emergence from hay feeding sites in northeastern Kansas are similar to those patterns observed in the current study, albeit about one month earlier, peaking in May and declined sharply by mid June (Broce et al. 2005).
Adult stable fly collections on sticky traps usually decreased soon after emergence rates from the hay feeding sites dropped, however, adult fly populations rebounded in late summer and early fall of each year (Fig. 3). The late season flies were not developing in winter hay feeding sites and, to date, we have been unable to identify the larval developmental sites giving rise to those flies.
Previous studies have discussed the spatial differences in the substrate of hay rings relative to the distance from the center (Broce et al. 2005, Talley et al. 2009). We observed these differences as well. The innermost annulus usually had the highest emergence density. However, this pattern in emergence levels, and presumably immature densities among annuli, was not consistent among hay feeding sites. This pattern indicates that the annuli are not reliable indicators of immature stable fly population densities within sites.
The absence of house flies developing in the hay feeding sites was unexpected. Adult house flies were numerous in the vicinity of the hay feeding sites and were observed laying eggs in pans of artificial media placed within the hay feeding sites (D.R.B., unpublished data). Female house flies are attracted to, and will readily oviposit in, bovine manure (Broce and Haas 1999). In a study of 16 developmental habitats in eastern Nebraska feedlots and dairies, Meyer and Petersen (1983) observed some partitioning of habitats between stable flies and house flies. However, the two species co-occurred in all of the habitats at varying ratios. House flies tend to occupy a broader range of habitats relative to stable flies (Guyer et al. 1956, Skoda and Thomas 1993). Further studies are needed to identify the characteristics of the hay feeding sites that preclude house flies from using them as developmental sites.
We thank Jake Cooper, Grant Evert, Staci Johnston, John Tomasevicz, B. Voelker, and T. Weinhold for technical assistance. Tim Lysyk provided assistance with statistical analyses. This work was done in cooperation with the Institute of Agriculture and Natural Resources, University of Nebraska as a contributor to multistate project S-1030.
References
