


Abstract
In social groups, competition for individual advantage is balanced with cooperation, for the collective benefit. Selection against aggression has favored cooperation and non-aggressive competitive strategies. Because social play is a behavioral system that fluctuates between cooperation and competition, selection against aggression might have especially influenced this behavior. African savannah elephants (Loxodonta africana) are a low aggressive species, therefore suitable to investigate this aspect. We collected all occurrences observational audio-video data on social play, aggression/threats, and affiliation on an African elephant colony housed in a 25-ha open space at Parque de la Naturaleza de Cabarceno (Cantabria, Spain) and composed of 4 family groups (3 immature males, 3 immature females, and 7 adult females) and 2 adult males. Anticipating the influence of reduced aggression, we found that social play decreased with age, persisting in adults, and that it was highest in males. Social play was associated with affiliation (informing cooperation). Indeed, individuals that were central in the social play network were also central in the affiliation network. For immature subjects, we found a correlation between social play and affiliation sociomatrices. However, such correlation was absent in adults and social play mostly occurred between families. Despite the limitations related to dealing with a small captive group, this study largely supports the idea that the features of social play in African savannah elephants may be related to low aggression. This investigation hints toward a non-purely cooperative use of play, possibly as a non-aggressive interaction that accommodates different levels of cooperation and competition.
Group living requires a balance between cooperation and competition because while cooperation enhances group cohesion for collective benefits (e.g., group-defence, predator avoidance, cooperative breeding, depending on the species), competition drives individual initiative to obtain singular advantages (e.g., mate and food monopolization; Dugatkin, 2002; Kitchen and Beehner, 2007). The tension between the interests of the group and the individual allowed evolutionary transitions, depending on resource availability (e.g., abundance, distribution, quality) and aggression risks (e.g., injury probability, predation exposure; Brandvain and Wade, 2007; Georgiev et al., 2013). As a possible outcome, strategies for managing conflicts of interest over resources that inevitably occur within social groups include alternatives to aggression (de Waal, 2000). In particular, resource abundance and distribution may have favored cooperation and non-aggressive competition strategies (Hare et al., 2012; Pisor and Surbeck, 2019). Several mechanisms have been proposed to explain the selection against aggression. These include, for example, the development of policing of hypercompetitive individuals, the emergence of emotion control linked to high cognition, or a self-domestication, ontogenetic-shift process causing the retention of juvenile characteristics in adulthood (such as docility and playfulness; Brandvain and Wade. 2007; Hare, 2017; Sánchez-Villagra and van Schaik, 2019; Wrangham, 2019; Shilton et al., 2020). Selection against aggression has been proposed, among other mammalian groups, for the families Hominidae (bonobos: Pan paniscus; humans: Homo sapiens) and Elephantidae, including African savannah elephants (Loxodonta africana), forest African elephants (L. cyclotis), and Asian elephants (Elephas maximus) (Hanks, 1979; Poole, 1989; Raviv et al., 2023). In African elephants—living in fission-fusion societies with core family units of related females and offspring—low aggression might stem from several strategies. Such strategies can include association between males during periods of sexual inactivity, stable social networks among older males, age-based ranking and kinship among females (Wittemyer and Getz. 2007; Goldenberg et al., 2014; Murphy et al., 2020). In this study, we focused on social play in African savannah elephants and on some play features that may have been influenced by the selection against aggression.
Social play is a polyfunctional behavioral system, consisting of a set of causally related and coordinated behavioral patterns (e.g., actions within a play session) borrowed and recombined from different contexts, such as aggression and affiliation (Pellis et al, 2019). Variable arrays of offensive (i.e., behavioral patterns aimed at attacking and pursuing the playmate) and defensive (i.e., behavioral patterns aimed at eluding the attack and pursuit by the playmate) behavioral patterns, e.g., during play fighting, can confer playful interactions more of a competitive or cooperative nature (Bauer and Smuts, 2007; Cafazzo et al., 2018; Cordoni et al, 2021; Collarini et al., 2022). The polyvagal theory proposes that the evolution of the mammalian autonomic nervous system provides the neurophysiological substrates for adaptive behavioral strategies, including the use of social play (Porges, 2009). According to such theory, social play can be viewed as a neural exercise that requires the ability to swing between a fight/flight competitive response and a cooperative social interaction (Porges, 2009, 2015). Consistently, in rats opioid, endocannabinoid, dopamine, noradrenaline, glucocorticoid, and testosterone systems—involved in motivational, pleasure (reward system), and stress and fight-flight responses—play a prominent role in the variable modulation of social play (Meaney, 1988; Vanderschuren et al., 2016; Papilloud et al., 2018). Neurobiologically, social play may arise from non-aggressive arousal, aggressive arousal suppression, and/or as a precursor of aggressive behavior (Beatty et al., 1982; Menon et al., 2022; Potegal and Nordman, 2023).
There are cases in which the predominant nature of playful interactions—cooperative versus competitive—is rather clear. For example, relatively cooperative play has been documented in species such as the squirrel monkeys (Saimiri sciureus), where dominant males playing with females allow role-reversal, which facilitates the continuation of play (Biben 1998). Similarly, in red-necked wallabies (Macropus rufogriseus), older individuals often employ defensive maneuvers over counter-attacks when interacting with younger ones, thus maintaining the playful interaction (Watson and Croft, 1996,1996). In other cases play appears to be more competitive, as it occurs in species like the Visayan warty pigs or domestic pigs (Sus cebifrons and Sus scrofa) where the play fights can be similar from serious ones, with scarce defensive or self-handicapping behavior (Pellis and Pellis, 2016; Cordoni et al, 2021). Among rats (Rattus norvegicus), adult and juvenile play rarely involves role reversal to the benefit of the younger participants (Pellis et al., 2023). In the case of gray mouse lemurs (Microcebus murinus), play bouts can be performed to compete for grooming or mounting (Pellis and Pellis, 2018). In chimpanzees, the ranking positions obtained by winning real fights can correlate with the ranking position obtained by winning play fights (Cordoni et al., 2023). However, the competitive or cooperative nature of playful interactions that are used to assess or reassess social relationships may not be obvious. On one hand, individuals can adjust their playful maneuvers to maintain reciprocity and prevent escalation into aggression (Smith, 1997; Palagi et al., 2016; Pellis & Pellis, 2017) and on the other hand individual and social factors (such as age, sex, social structure, and dominance relationships) can give play a more competitive edge (Fagen, 1981; Burghardt, 2005; Bauer and Smuts, 2007; Pellis et al., 2010; Cordoni and Palagi, 2011).
By specifically affecting competition and cooperation levels, the selection against aggression may have influenced social play more than other behaviors that do not show both cooperative and competitive sides (i.e., aggressive and affiliative interactions). Such selection might have favored the use of social play not just as a cooperation enhancer but also as an aggression reducer, by influencing individual modulating factors (age, sex, and group membership) and social function (more or less competitive; e.g., Antonacci et al., 2010; Hare et al., 2012; Palagi and Cordoni, 2012; Behncke, 2015; McLean, 2016; Gallo et al., 2021; Caselli et al., 2023). These points are elaborated in the following sections.
As concerns age, social play can decrease over the ontogenetic development but not completely disappear during the transition to adulthood, as a possible result of decreased aggression (Palagi and Cordoni, 2012; Cordoni et al., 2016; Hansen Wheat et al., 2018; Raviv et al., 2023). In human adults such as hunter-gatherers, social play persists (even when expressed via more structured and/or verbal forms of interaction), and can be a reducer of aggression (Gray, 2009). Similarly in bonobos, play is present in adults and it is more frequent than in chimpanzees as a possible trait selected against aggression (Hare et al., 2012; Palagi and Cordoni, 2012). Social play in adults has been also observed in primate species that show low aggressive levels (e.g., Verreaux’s sifaka, Propithecus verrauxi: Antonacci et al., 2010; geladas, Theropithecus gelada: Mancini and Palagi, 2009). In elephants (both African and Asian species) social play is enhanced in calves and juveniles, and persists in adulthood (Lee 1987; Lee and Moss, 2014; Raviv et al., 2023).
With respect to sex, social play may be enhanced in males to reduce aggressive interactions. In immature males, increased testosterone may lead to play fighting rather than aggression (e.g., in rats and certain human cohorts; Meaney, 1988; Hines and Kaufman, 1994). On the other hand, in subadults and adults low androgen activity may be linked with enhanced affiliation and social play (e.g., in bonobos compared with chimpanzees; Hare et al., 2012; McLean, 2016). Such activity may not increase during in-group competition in males, reducing aggression and possibly promoting social play (e.g., in humans and bonobos; Wobber et al., 2010; Behncke, 2015; Gray et al., 2017). In primate species with low aggressive levels, males can play with others to overcome xenophobia and bond with others (e.g., Verreaux’s sifaka: Antonacci et al., 2010; bonobos: Behncke, 2015). Male bonobos can engage in social physical play—balancing risk and trust—and play with infants relatively more than chimpanzees (Enamoto, 1990; Palagi, 2006; Behncke, 2015). In African savannah elephants, adult males range either alone or with other males (occasionally joining females) and show low testosterone levels outside musth (Jainudeen et al., 1972; Hall-Martin and Van der Walt 1984; Poole et al. 1984; Lincoln and Ratnasooriya, 1996; Archie et al., 2006; Evans and Harris, 2008; de Silva and Wittemyer 2012). As adults, males can socially interact via escalated contact play and sparring whereas as juveniles they can engage in play for physical and social assessment (Lee and Moss, 2014; Webber and Lee, 2020).
Although social play is mostly observed among group members, in some species with low aggressive levels it can also occur between individuals of different groups. In several primate species characterized by low levels of aggression, for instance, social play can be used to relate with non-group members or strangers (e.g., Itani, 1990; Antonacci et al., 2010; Behncke, 2015; Gallo et al., 2021; Caselli et al., 2023). Social play can be used by elephants both within and between matrilineal families to socialize with others and assess the physical capacities and trustworthiness of others (Poole and Granli, 2004; Vicino and Marcacci, 2015; Webber and Lee, 2020).
Based on the above framework, we formulated different predictions on social play in African savannah elephants. We used affiliation and agonistic interactions as reference behaviors to test whether social play—and not other behaviors—was influenced by individual and social factors.
Prediction 1—Individual and social factors affecting social play
In species with low levels of overt aggression—including elephants—social play can be enhanced especially in the juvenile phase although persisting in adulthood, whereas affiliation should remain high and aggression low even in adulthood (e.g., Hare et al., 2012; Lee and Moss, 2014; Hansen Wheat et al., 2018; Raviv et al., 2023). Hence, in African savannah elephants, we expected that social play levels—and not other behaviors (affiliation and aggression)—would decrease with age—although persisting in the adult phase (prediction 1a). Moreover, social play can be particularly enhanced in males in relation to low aggressiveness and in African savannah elephants males may especially engage in contact social play (Enamoto, 1990; Lee and Moss, 2014). Thus, we expected that in African savannah elephants social play levels—and not other behaviors—would be higher in males than in females (Prediction 1b).
In social species, affiliation is especially enhanced within groups to favor cooperation (Dale et al., 2020; Samuni et al., 2021). Aggression—although common within groups (de Waal, 1996, 2004)—can be particularly exacerbated between groups (Bornstein, 2003; Bruintjes et al., 2016; De Dreu et al., 2016; Pusey, 2022). Spanning strepsirrhines, monkeys and apes, in low-conflict social groups, social play may be observed between individuals of different—other than the same—social groups (Antonacci et al., 2010; Behncke, 2015; Gallo et al., 2021). In African savannah elephants, juveniles seek playmate peers also outside their family to socialize, assess others’ skills, and establish relationships (Lee 1987; Raviv et al., 2023). Hence, in African savannah elephants we expected that although affiliation would mostly occur within family units and aggression between family units, social play would not show significant differences (Prediction 1c).
Prediction 2—Relation between social play, aggression and affiliation
As outlined above, the characteristics of social play related to selection against aggression might involve, even in African savannah elephants, its persistence in adults, its use especially by males and also with potential competitors from other groups (Poole and Granli, 2004; Lee and Moss, 2014; Vicino and Marcacci, 2015; Webber and Lee, 2020; Raviv et al., 2023). On the other hand, social play may be at the same time used by elephants of all ages with both family and non-family members for physical assessment, to maintain relationships with conspecifics and create new social bonds (Poole and Granli, 2004; Lee and Moss, 2014; Vicino and Marcacci, 2015; Webber and Lee, 2020). In the former case social play would reduce aggression by replacing it under certain circumstances (non-aggressive competition) whereas in the latter case social play would be used to affiliate with others (cooperation). Because at the present stage there are not enough elements to provide a prediction with a single direction, we present 2 alternative possibilities: (2a) if social play is mostly used in a cooperative way, it should correlate with affiliation and not with aggression; (2b) if social play is mostly used in competitive way, it should correlate with aggression and not with affiliation.
Materials and Methods
Study site and group, and data collection
This study was carried out on 15 African savannah elephants (Loxodonta africana) housed at the Parque de la Naturaleza de Cabárceno (Santander, Cantabria, Spain), in an outdoor grassland habitat of 25 ha. The elephants would stay outside from morning to evening and would spend the night in an indoor facility. The study group included individuals of different age classes (as perEvans and Harris, 2008): 6 immature subjects (2–5 years old, 2 females and 2 males; a 10 years old male and a 11 years old female at pre-pubertal stage), 2 late adolescents or young adults (2 females, 17 and 19 years old), and 7 adults (2 males and 5 females, 21–45 years old). There was no correlation between sex and age (Spearman’s rank, n = 15, r = 0.131, P = 0.641; see below for the explanation of the statistical tests). The complete group composition, families and information are included in Table 1 and the outdoor facility is shown in Figure 1. Around the outdoor facilities, different elevated viewpoints allowed the observation of most or all individuals of the group at any time.
Details of group composition, family matriarchs, and individual information of the study group.
| Individual | Sex | Age | Father (in the colony) | Mother (in the colony) | Offspring | Family matriarch |
|---|---|---|---|---|---|---|
| Jums | M | 45 | N/A | |||
| Penny | F | 42 | Penny | |||
| Zambi | F | 41 | Kenia, Infinita | Zambi | ||
| Kira | F | 27 | Penny | Africa (Pamba) | Penny | |
| Kenia | F | 21 | Zambi | Zambi | ||
| Infinita | F | 17 | Zambi | Toranzo | Zambi | |
| Brisa | F | 19 | Toribio | Brisa | ||
| Hilda | F | 21 | Martin, Saja, Maruca | Hilda | ||
| Africa (Pamba) | F | 11 | Kira | Penny | ||
| Toranzo | M | 4 | Jumar | Infinita | Zambi | |
| Toribio | M | 4 | Jumar/Jums | Brisa | Brisa | |
| Saja | F | 5 | Jumar/Jums | Hilda | Hilda | |
| Maruca | F | 2 | Jumar | Hilda | Hilda | |
| Martin | M | 10 | Hilda | Hilda | ||
| Jumar | M | 25 | Jums | N/A |

The figure shows the grassland outdoor facilities, with elephants roaming in the area. Top: 25 ha outdoor space where the study group was housed at Parque de la Naturaleza de Cabarceno, Cantabria (Spain). Bottom: space detail with some elephants ranging in the area. Photo credits: Ivan Norscia.
Behavioral data were collected over 230.5 h although elephants were outdoors on a daily basis (4–6 days/week) from April 2022 to July 2022, from 9:00 to 18:00 h (alternating morning and afternoon). Via all occurrences sampling method (Altmann, 1974), on the visible individuals, we collected data on social play, affiliation, and aggression (including threats and subordination signals) behavioral bouts. We gathered 897 affiliation bouts, 52 aggressive bouts, and 391 social play bouts (with play bouts separated by 30s in case of consecutive sessions; individual bouts in Supplementary Table S1). The interaction started with the start of the first pattern and ended at the end of last pattern for the type of interaction considered (affiliation, aggression, social play); the ethogram used to define these categories is summarized in Supplementary Table S2. The individual and dyadic observation time was obtained via scan sampling (Altmann, 1974) every 10 min. Observations were carried out live (audio recordings) and with the support of full HD videos (via Panasonic HC-V180). Family units were composed by the matriarch, kin-related females and offspring (Table 1). M.H. performed the behavioral coding after training with I.N. and G.C. The training was ended when inter-observer reliability, measured by Cohen’s kappa, reached a threshold of 0.80 for social play, aggression and affiliation behaviors (good agreement; sensuMcHugh, 2012).
Operational definitions and statistical elaboration
We carried out analyses at the individual level (on the frequencies recorded in the entire study period) and at daily, dyadic levels (presence/absence of aggression, affiliation, or social play). For the analyses at the dyadic level, we identified as 'actor' the individual initiating the interaction and as ‘receiver’ the recipient of the interaction. As concerns the analyses at the individual level, in the case of non-normal distribution of one of the tested variables (Kolmogorov–Smirnov test: from P < 0.001 to P = 0.030) or reduced sample size (N < 10) we applied non-parametric tests (Siegel and Castellan, 1988). Specifically, we used 1) the Spearman’s test to correlate—at the individual level—sex and age, the frequencies of social play with age and for pairwise correlations across social play, affiliation, and aggression modularity (from social networks), 2) the Mann–Whitney U test to compare social play, affiliation, and aggression frequencies between sexes, and 3) the Wilcoxon signed-rank test to compare social play, affiliation, and aggression frequencies within families and between individuals of different family units. Exact values were selected after Mundry and Fischer (1998). In the case of normal distributions (Kolmogorov–Smirnov test: P ≥ 0.05) we used parametric statistics and specifically the Pearsons’s test to correlate—at the individual level—age and rank (via Normalized David’s Scores, NDS, determined as explained below), affiliation and aggression frequencies with age, and eigenvector centrality values between different combinations involving aggression, affiliation, and social play. For the analyses comparing behavioral frequencies within and between families we did not include adult males as they did not form any family aggregation.
We also ran 3 Generalized Linear Mixed Models (GLMMs) for the analyses at the daily, dyadic level. The binomial target variable was the daily presence/absence of aggression (in GLMM1), affiliation (in GLMM2), and social play (in GLMM3). The fixed factors included in each model were: 1) actor’ and receiver’s age (numeric); 2) actor’ and receiver’s sex (binomial); and 3) family (binomial: same/different). The identity of the dyad was included as random factor in all models.
We fit the GLMMs in R (R Core Team, 2022; R version 4.2.3.; Posit team, 2023, RStudio version 2023.3.0.386) by using the function “glmer” of the R-package lme4 (Bates et al., 2015). We determined the significance of the full model via comparison to a null model that only included the random effects (Forstmeier and Schielzeth, 2011). We used a likelihood ratio test (Dobson and Barnett, 2018) to test this significance (ANOVA with argument “Chisq”). We calculated the P values for the individual predictors based on likelihood ratio tests between the full and the null model by using the R-function “drop1” (Barr et al., 2013). As the target variables were binomial, a binomial error distribution was used.
Hierarchy linearity—which refers to the extent to which established dominance relationships are transitive—was tested on the aggression sociomatrix via Matman 1.0 (10,000 randomizations) by calculating the Landau’s corrected linearity index hʹ (which also considers the number of unknown relationships and ties) and its statistical significance (Landau, 1951; de Vries et al., 1993; de Vries, 1995, 1998). Hierarchy steepness was determined from a sociomatrix including aggressive and submissive patterns via Steepness 2.2 (Leiva and de Vries, 2011). Steepness measures the absolute slope (values in the range 0–1) of the straight line fitted to the Normalized David’s Scores (NDS) plotted against the subjects’ ranks (de Vries et al., 2006). Normalized David’s scores (NDS) were derived from the dyadic dominance index (Dij) in which the proportion of wins (Pij) is corrected for the probability that the observed outcome occurs. This probability is calculated on the basis of a binomial distribution, assuming that each individual has an equal chance of being the winner or the loser of each agonistic interaction (de Vries et al., 2006).
Owing to non-normality of dyadic frequencies (Kolmogorov–Smirnov test via Monte-Carlo randomization: N = 210, P < 0.001), we carried out pairwise correlations—at the dyadic level—across frequencies of social play, aggression, and affiliation squared socio-matrices via a Kendall’s row-wise correlation test between matrices (via software Matman 1.0; 10,000 permutations). This test makes no underlying assumptions and only compares values within the same row, thus overcoming data partial dependency (recurring observations concerning the same individual). The calculation of Kr row-wise matrix correlation coefficient is based on a weighted sum of the correlation between all dyads of corresponding rows in the 2 sociomatrices and is defined via Kendall’s rank order correlation coefficient (de Vries, 1993).
Via the corrplot package (Wei and Simko, 2021) in the statistical environment R, we obtained graphical representations of pairwise socio-matrix correlations across social play, affiliative, and aggression behaviors. The behavioral frequencies used in the analyses were obtained by normalizing the absolute behavioral bouts recorded over the observation time of the individual (for analyses at the individual levels) or the dyad (for analysis at the dyadic levels).
The social networks (measures and representations) of social play, affiliation, and aggression, were obtained via the freeware Gephi 0.9.7 (www.gephi.org/; dual license CDDL 1.0 and GNU General Public License v3). The network is composed of individuals (nodes) and inter-individual relations (edges) derived from the frequency of dyadic directional interactions. Directionality (directed edges) was determined based on the interaction initiation (A→B if A was the initiator and B the recipient of the interaction; B→A if the other way around). Through the social network analysis, we calculated the Eigenvector centrality, which evaluates a node impact by accounting for not only its immediate links but also the centrality of its adjacent nodes. Such evaluation is carried out via an equation that iteratively determines the centrality of each node, and it continues until the centrality scores converge (Ruhnau in 2000). Consequently, the nodes that possess high eigenvector centrality are those connected to other nodes with high centrality within the network.
The statistical significance threshold was set at α = 0.05 but in case of repeated tests involving the same data we considered the Bonferroni correction and adjusted the significance threshold accordingly.
Results
Hierarchy
As a preliminary analysis, we determined group hierarchy which was not linear (hʹ = 0.185, P = 0.436) and showed a low degree of steepness (steepness = 0.095, with P = 0.902 that the simulated values are ≤0.095, NDS min–max range = 6.21–7.90). NDSs were positively correlated with age (Spearman’s correlation: n = 15, r = 0.647, P = 0.009). Hence, there was low transitivity in dominance relationships and small NDS rank differences between individuals, and rank increased with age. Figure 2 shows hierarchy steepness based on NDS.
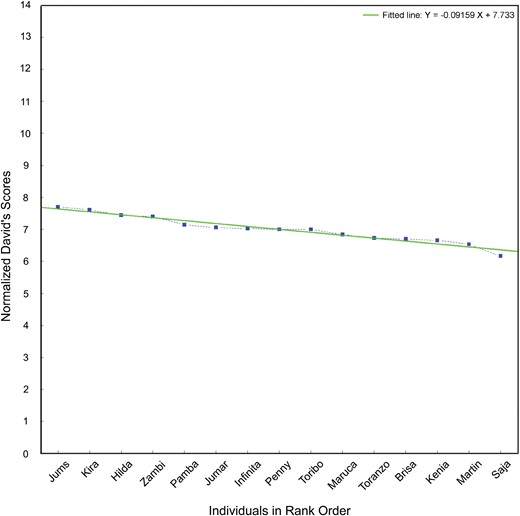
—The figure shows Cartesian axes with individuals' names on the X-axis and NDS values on the Y-axis. The points corresponding to the NDS of different individuals are shown in the figure along with the steepness line that interpolates the NDS points. The steepness is based hierarchy on NDS in the African elephant study group.
Prediction 1—Individual and social factors (age, sex, family)
Social play frequencies inversely correlated with age (Spearman’s correlation: N = 15, r = −0.738, P = 0.002, Bonferroni corrected threshold α = 0.016, Figure 3) whereas no correlation was detected between age and either affiliation or aggression rates (Pearson’s correlation, affiliation/age: N = 15, r = −0.363, P = 0.183; aggression/age: N = 15, r = 0.338, P = 0.217). Social play was more frequent in males than in females (Exact Mann–Whitney’s test: Nmales = 5, Nfemales = 10, U = 7.00, P = 0.028, Figure 4A) whereas no differences between sexes were found in affiliation (Exact Mann–Whitney’s test: Nmales = 5, Nfemales = 10, U = 25.00, P = 1.000, Figure 4C) and aggression levels (Exact Mann–Whitney’s test: Nmales = 5, Nfemales = 10, U = 20.50, P = 0.594, Figure 4E).
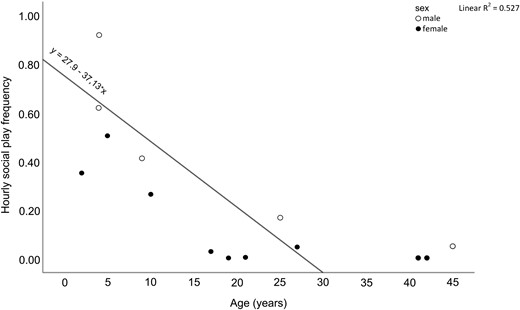
The figure shows a scatterplot of age (years) on the X axis and hourly social play frequency on the Y axis, with indication of sex (males: white circles; females; black circles). Individual frequencies of social play inversely correlated with age (Spearman’s correlation: N = 15, r = −0.738, P = 0.002).
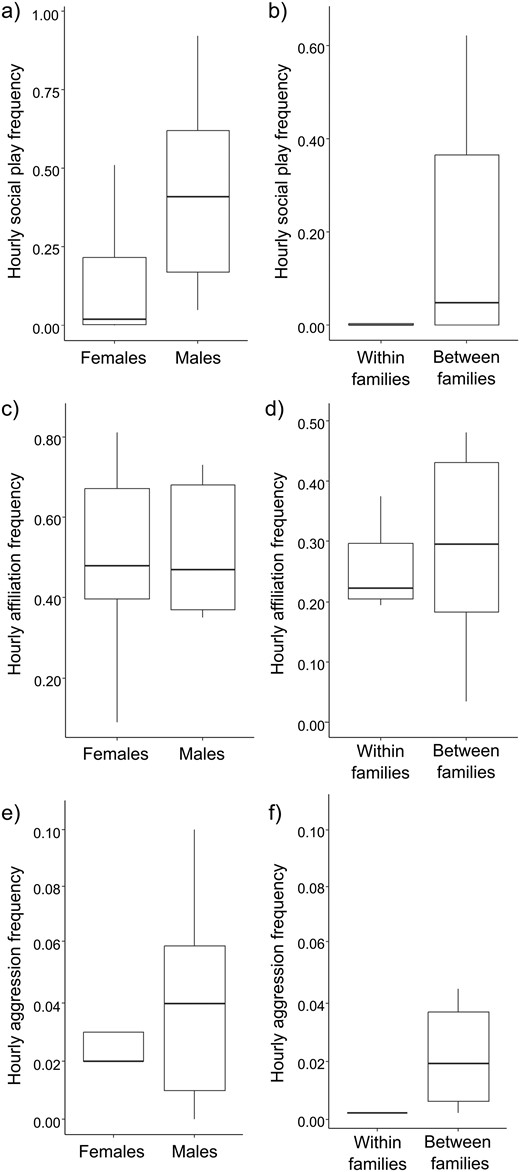
The figure shows six boxplots. The two top boxplots show social play hourly frequencies (on the Y axis) as a function of sex (females/males, X axis) on the left, and family (within/between families, X axis) on the right. Social play hourly frequencies were a) higher in males than in females (Exact Mann-Whitney’s test: Nmales = 5, Nfemales = 10, U = 7.00, P = 0.028) and b) within than between families (Exact Wilcoxon’s test, N = 13, T = 0, z = -2.666, P = 0.004). The two middle boxplots show affiliation hourly frequencies (on the Y axis) as a function of sex (females/males, X axis) on the left, and family (within/between families, X axis) on the right. Affiliation hourly frequencies were comparable (c) between males and females (Exact Mann-Whitney’s test: Nmales = 5, Nfemales = 10, U = 25.00, P = 1.000) and (d) within and between families (Exact Wilcoxon’s test, N = 13, T = 27.00, z = -1.293, P = 0.216). The two bottom boxplots show aggression hourly frequencies (on the Y axis) as a function of sex (females/males, X axis) on the left, and family (within/between families, X axis) on the right. Aggression hourly frequencies were (e) comparable between males and females (Exact Mann-Whitney’s test: Nmales = 5, Nfemales = 10, U = 20.50, P = 0.594) but (f) were higher within than between families (Exact Wilcoxon’s test, N = 13, T = 0, z = -2.803, P = 0.002). Circles and asterisks indicate outliers (out and far out values, respectively).
Social play and aggressive events (including threats) were more frequent between than within families (Exact Wilcoxon’s test, social play: N = 13, T = 0, z = −2.666, P = 0.004, Figure 4B; aggression: N = 13, T = 0, z = −2.803, P = 0.002, Figure 4D) whereas affiliation was performed at comparable levels within and between families (Exact Wilcoxon’s test: N = 13, T = 27.00, z = −1.293, P = 0.216, Figure 4F).
GLMM1 was carried out on the daily presence/absence of aggression at the dyadic level. The full model (including all fixed factors) and the null model (only including the random factor) did not significantly differ (likelihood ratio test: χ2 = 7.452, df = 5, P = 0.189; Table 2). Hence, none of the tested variables (actor/receiver sex and age, family) explained the presence/absence of aggression.
GLMMs results
| Predictors | Estimates | SEM | CI95 | Effect size | χ2 | P |
|---|---|---|---|---|---|---|
| GLMM1 | Full versus null model: χ2 = 7.452; df = 5; P = 0.189 | |||||
| GLMM2 | Full versus null model: χ2 = 23.056; df = 5; P < 0.001 | |||||
| (Intercept)a | 0.913 | 0.341 | 0.243; 1.582 | a | a | a |
| Actor age | 0.012 | 0.011 | −0.009; 0.034 | 0.840 | 1.108 | 0.268 |
| Receiver age | 0.013 | 0.011 | −0.009; 0.035 | 0.837 | 1.123 | 0.262 |
| Actor sex (male)b | −0.689 | 0.269 | −1.215; −0.162 | 0.840 | −2.564 | 0.010 |
| Receiver sex (male) b | −0.176 | 0.273 | −0.711; 0.359 | 0.804 | −0.646 | 0.518 |
| Family (same) b | 1.058 | 0.342 | 0.387; 1.730 | 0.879 | 3.090 | 0.002 |
| GLMM3 | Full vs. null model: χ2 = 55.038; df = 5; P < 0.001 | |||||
| (Intercept)a | −0.252 | 0.467 | −1.167; 0.663 | a | a | a |
| Actor age | −0.077 | 0.019 | −0.113; −0.040 | 0.209 | −4.135 | <0.001 |
| Receiver age | −0.077 | 0.018 | −0.113; −0.041 | 0.242 | −4.196 | <0.001 |
| Actor sex (male) b | 0.879 | 0.394 | 0.107; 1.652 | 0.142 | 2.231 | 0.026 |
| Receiver sex (male) b | 1.417 | 0.388 | 0.656; 2.177 | 0.199 | 3.651 | <0.001 |
| Family (same) b | −1.414 | 0.486 | −2.366; −0.462 | 0.152 | −2.911 | 0.004 |
aNot shown as not having a meaningful interpretation.
bThese predictors were dummy-coded, with the reference category as follow: actor sex: “female”; receiver sex: “female”; family: “different”. Significance (bold values) is set at P < 0.05.
GLMM2 was carried out on the daily presence/absence of affiliation at the dyadic level. The full model (including all fixed factors) and the null model (only including the random factor) significantly differed (likelihood ratio test: χ2 = 23.056, df = 5, P < 0.001). Because at least one predictor had a significant effect on the target variable, we applied the drop1 procedure. We found that affiliation was influenced by sex (Table 2, Figure 5A) and, specifically, it was initiated more by females than males and by family members, as affiliation occurred mostly within family (Table 2; Figure 5B).
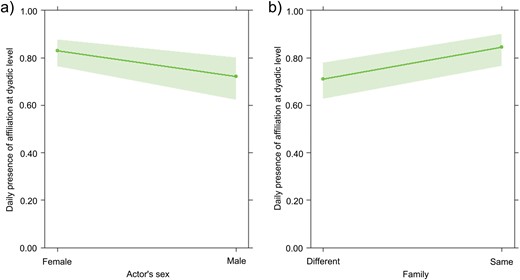
The figure shows to effect plots referring to daily presence of affiliation at the dyadic level (Y axis) as function of either actor’s sex (female/male, X axis, on the left) of family (different/same, X axis, on the right). In particular, the effect plots show: a) on the left: the significant effect of sex variable (X axis) on daily presence of affiliation at dyadic level (Y axis); b) on the right: the significant effect of family variable (X axis) on daily presence of affiliation at dyadic level (Y axis).
GLMM3 was carried out on the daily presence/absence of social play at the dyadic level. The full model (including all fixed factors) and the null model (only including the random factor) significantly differed (likelihood ratio test: χ2 = 55.038, df = 5, P < 0.001). Because at least one predictor had a significant effect on the target variable, we applied the drop1 procedure. We found that social play decreased as the age of the actor and receiver increased (Table 2; Figure 6A, B). Moreover, social play was mostly directed to males and mostly initiated by males (Table 2; Figure 6C, D). Social play also occurred more between than within families (Table 2; Figure 6E).
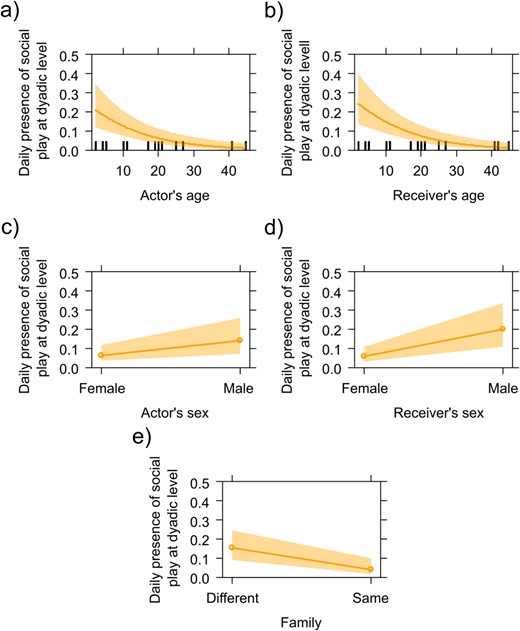
The figure shows five effect plots of the daily occurrence of social play at dyadic level (Y axis) as a function of actor’s and receiver’s age (X axis; top two plots, left and right, respectively), actor’s and receiver’s sex (female/male, X axis; middle two plots, left and right, respectively), and family (different/same, X axis; bottom plot). The daily occurrence of dyadic social play was influenced by a) the actor’s age and b) the receiver’s age (social play occurrence decreased as the age increased); c) was influenced by the actor’s sex and d) the receiver’s sex (social play mostly involved males); and e) was influenced by family variable (social play occurred more between than within families).
Because both at the individual and at the daily dyadic level, social play occurrence was inversely correlated with age, prediction 1a can be considered as supported by our results. Moreover, both at the individual and at the daily dyadic level males showed the highest levels of social play. Thus, prediction 1b was also supported by our results. Finally, our findings offer only partial support for prediction 1c. Although we anticipated no distinction in social play levels according to family membership, our data reveals that social play was more frequent between than within families, both at the individual and daily dyadic levels. In contrast, affiliation and aggression did not display a consistent difference in this respect.
Prediction 2—relation between social play, affiliation, and aggression
When considering the Eigenvector centrality values obtained via social network analysis, we found a positive correlation between social play and affiliation (Pearson correlation: N = 15, r = 0.877, P < 0.001, Bonferroni corrected threshold α = 0.016) whereas no correlation was found between other variable combinations (Pearson correlation, affiliation/aggression: N = 15, r = 0.319, P = 0.246; aggression/play: N = 15, r = 0.162, P = 0.564).
No sociomatrix correlation was found for adults (Kendall’s row-wise correlation test, social play/affiliation: N = 9, Kr = 19, τ = 0.21, P = 0.067; affiliation/aggression: N = 9, Kr = −15, τ = −0.11, P = 0.821; aggression/social play: N = 9, Kr = 3, τ = 0.05, P = 0.371). We found a positive correlation between social play and affiliation (and not between other variables) sociomatrices for immature subjects (Kendall’s row-wise correlation test, social play/affiliation: N = 6, Kr = 27, τ = 0.47, P = 0.015, Bonferroni corrected threshold α = 0.016: affiliation/aggression: N = 6, Kr = 2, τ = 0.09, P = 0.350; aggression/social play: N = 6, Kr = −3, τ = −0.14, P = 0.813). Correlation results are summarized in the correlograms shown in Figure 7 and social networks obtained via SNA are shown in Figure 8, with node sizes based on Eigenvector centrality values.
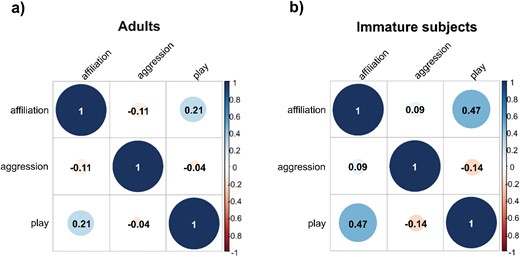
The figures show two tabular displays (correlograms) of variables included in the matrix correlations for adults on the left (a) and immature subjects on the right (b). A positive correlation was found between social play and affiliation in immature subjects (Kendall’s row-wise correlation test, N = 6, Kr = 27, τ = 0.47, P = 0.015). No other correlation was significant. In the squared correlograms, divided into 6 sub-squares, numerical values indicate the value of the Kendall’s row-wise correlation coefficient ( τ ). The size of the value of the correlation coefficient in the correlation matrix graph varies from -1 to 1 (0 indicates that there is no linear relationship; 1 or +1 indicates a completely linear relationship). Colour and shading (from pink for lower values to light blue and blue as the value increases) indicate the level of correlations.
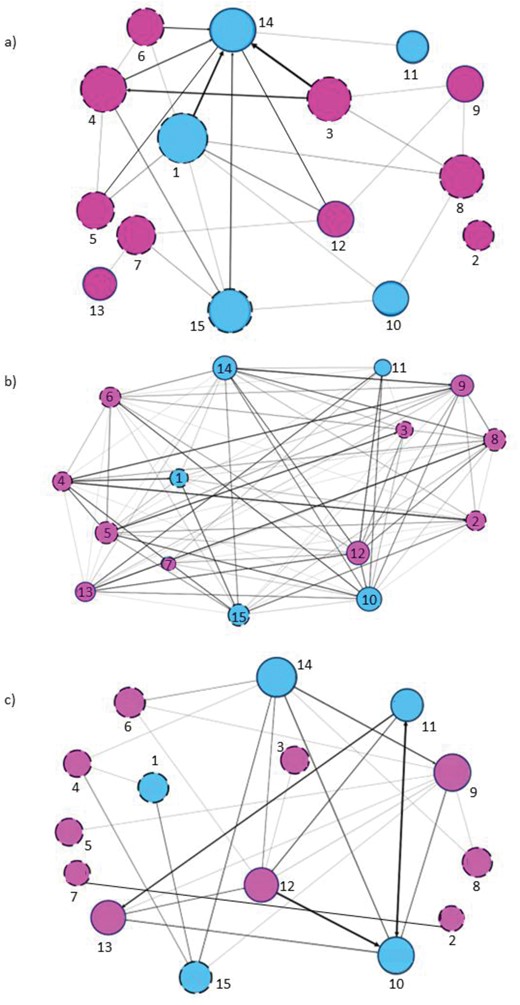
The figure shows three social networks with nodes (circles) and edges (directional lines with arrows connecting the nodes). The social networks refer to a) aggression (top), b) affiliation (middle) and c) social play (bottom). Blue nodes indicate males, purple node indicates females. Dashed circles indicate adults and solid circles indicate immature subjects . Node size is based on Eigenvector centrality. Numbers identify the study subjects as follow: 1 = Jums, 2 = Penny, 3 = Zambi, 4 = Kira, 5 = Kenia, 6 = Infinita, 7 = Brisa, 8 = Hilda, 9 = Africa (Pamba), 10 = Toranzo, 11 = Toribio, 12 = Saja, 13 = Maruca, 14 = Martin, 15 = JumarGolbeck, 2013; Saqr, 2018.
Hence, overall the individuals that were more central in the social play network were also more central in the affiliation network but playful dyadic interactions correlated with affiliation exchanges only in immature subjects and not in adults. Thus, neither of the alternative predictions (2a and 2b) is fully supported.
Discussion
Our results indicate that social play dynamics may be overall consistent with selection against aggression in African savannah elephants (Hanks, 1979; Poole, 1989; Raviv et al., 2023). Indeed, we found that social play (and not affiliation and aggression) decreased with age, and that it persisted (as affiliation and aggression) in adulthood (Prediction 1a confirmed; Table 2; Figures 3, 6A and 6B). Although the peak of social play rates during the immature phase is common in mammals (Fagen, 1981), the persistence of social play in adults may be linked to two factors: the necessity to limit the excessive use of aggression as it occurs in chimpanzees (Yamanashi et al., 2018; Cordoni et al., 2023) and wolves (Cordoni, 2009) which show formal linear hierarchies (Wittig and Boesch, 2003; Cafazzo et al., 2016) or as a consequence of generally low aggression levels, as it occurs for example in bonobos (Behncke, 2015) and Verreaux’s sifaka (Antonacci et al., 2010). Our study group of African elephants exhibited a shallow hierarchy with age-related ranking, consistent with findings from earlier research (Archie et al., 2006; Wittemyer and Getz, 2007). The presence of several peers, and the small number of elephants (including some non-interacting dyads), in our study colony may have dampened the transitive relationships (informed by linearity), which have been reported in the wild both within and across families (Archie et al., 2006; Wittemyer and Getz, 2007). Overall, low aggressiveness stands as one of the possible drivers of adult social play, as it characterizes dominance relationships among African elephants (Wittemyer and Getz, 2007).
Another interesting feature of the social play of our study group of African elephants is in line with selection against aggression. Indeed—contrary to affiliation (mostly initiated by females, Figure 5A) and aggression—social play mostly involved males (prediction 1b confirmed; Figure 4A, 6C, 6D). Although the availability of play partners close in age and/or of the same sex may have influenced play frequencies (especially for late adolescent females), sexually immature subjects were balanced in sex and age. Our result is consistent with previous studies on wild and captive African elephants, showing that immature and adult males show increased levels of play (Lee and Moss, 2014; Webber and Lee, 2020). In the wild, immature males play with peer males for physical and social assessment whereas adult males can associate—during the dispersal phase—with peer males of other families and engage in frequent play interactions with them to establish long-term cooperative bonds (Lee and Moss, 2014). Overall, as a result of reduced aggressiveness, in African savannah elephants males might prefer the use of low risk playful interactions to compete in the short term and to create supportive relationships.
For our study group, we did not obtain entirely consistent results across analyses (spanning individual behavior rates and the daily dyadic levels) with respect to aggression and affiliation. As concerns aggression, it was highest toward individuals of other families when considering the individual rates but showed no family effect at the daily dyadic level (Table 2, Figure 4f). With respect to affiliation, no family effect was found at the individual level although affiliation was highest within families at the daily dyadic level (Table 2, Figure 5b). These inconsistencies might indicate fluidity in the use of aggression (also informed by the shallow hierarchy) and affiliation. However, the overall scenario suggests a tendency toward increased competition between families and increased cooperation within families as it occurs—under certain ecological conditions—in human and non-human animal multilevel societies (e.g., Smith et al., 2010; Cuhadar and Dayton, 2011; Grueter et al., 2012; Caselli et al., 2021). Contrary to agonistic and affiliative interactions, social play was consistently highest between than within families (Prediction 1c not confirmed) at both the overall individual rates (Figure 4B) and the daily dyadic level (Table 2; Figure 6E). This finding may be the mere result of the fact that peers could be mostly found across—rather than within—families in our study group. However, considering the results altogether, there may be more than just this explanation. On one hand, our results are consistent with previous literature showing that social play—more than other behaviors—can be used to form bonds, test the abilities of future peers and increase tolerance not only within the same group but also with individuals of other family units or groups (e.g., gelada monkeys, Theropithecus gelada: Gallo et al., 2021; sifaka lemurs, Propithecus verreauxi: Antonacci et al., 2010; bonobos, Pan paniscus: Behncke, 2015). Wild African savannah elephants progressively increase their playful interactions with unfamiliar individuals after the first year of life to enhance the self- and social-assessment process and the training for the unexpected (Lee and Moss, 1999, 2014; Spinka et al., 2001; Kuczaj et al., 2006). On the other hand, the use of social play preferentially with individuals of other families, by males and also by adults—as expected—may inform that this behavior has not just an affiliative but also a competitive nature.
Our inability to fully confirm either of the alternative predictions (predictions 2a or 2b) on the relation between social play, affiliation and aggression supports the double nature of social play in elephants. The fact that the individuals that were prominent in the social play network were also central in the affiliation network suggests a cooperative function of play. However, the observation that only for immature subjects—and not for adults—dyadic social play interactions correlated with affiliative interactions, hints toward the possibility that in adults social play may not be purely cooperative or competitive (Figure 7). Further investigation on a larger sample is necessary to either corroborate or reject this possibility. Overall, our results are in line with previous findings showing that in African savannah elephants social play, especially in subadult–adult males, can move from non-aggressively testing others’ physical abilities and establish/reinforce dominance to cementing social bonds (Poole, 1989; Lee and Moss, 2014). The flexible use of social play in African savannah elephants is consistent with selection against aggression, as neurobiologically and ecologically, social play be used in subadult/adult mammals as a non-aggressive coping mechanism when aggression is reduced or inhibited, in response to arousal or stressful situations, or as substitute for aggression (Beatty et al., 1982; Behncke, 2015; Blois-Heulin et al., 2015; Cordoni et al, 2021; Potegal and Nordman, 2023). In elephants, social play can be used in absence of physical and social challenges to create them (Wobber and Lee, 2020).
Because this is a short term captive study on a small group with limited partner choices, long-term investigation on the wild populations is awaited to validate this scenario. Indeed, the ecological validity of this study is constrained not only by the non-wild setting but also by the fact that our study group, although one of the largest in captivity, may represent a small tier-3 group (sensuWittemyer et al., 2009), comprising one small tier-2 group (associations of breeding females with offspring) and 3 tier-1 units (breeding female with offspring). The inability to reach the clan level (with a higher number of units and individuals within them) and the absence of late-adolescent males, make further investigations necessary to generalize the results presented here. Nonetheless, this study can be considered as a pilot study that has the merit of introducing a quantitative approach useful for investigating—in African savannah elephants—different aspects of the dual nature (competitive/cooperative) of social play in relation to other behaviors and the selection against aggression.
Supplementary Material
Supplementary material can be found at https://dbpia.nl.go.kr/cz.
Acknowledgements
The authors wish to thank the staff of Parque de la Naturaleza de Cabárceno for their welcoming and support.
Funding
Funding was provided to I.N. by Department of Life Sciences and Systems Biology (DBIOS), University of Torino, Italy (Grant No. NORI_RILO_22_01).
Conflict of Interests
The authors declared that they have no conflict of interest to this work.
Authors’ Contributions
Conceptualization, I.N.; methodological approach, G.C. and I.N.; training, G.C. and I.N; data collection and sort-out: M.H.; formal analysis, I.N.; writing—original draft preparation, I.N.; G.C., E.C., M.C.; review and editing; S.B., B.G: facilities and data collection facilitation. All authors have read and agreed to the published version of the manuscript.
Ethical Statement
This study is purely observational and non-manipulative, so no approval was required from the authors’ institutions.

