


Abstract
Eastern Purple Martins (Progne subis subis) have an unusually close relationship with humans, as they nest exclusively in man-made nest boxes. Current conservation policy directly promotes further interaction with this species by advocating regular replacement of nest materials during the nestling phase to reduce ectoparasite load and increase nestling fitness. We conducted the first test of the efficacy of this recommendation and found that it was partially effective in reducing parasite abundance, but had no effect on nestling fledging success, body mass, leukocyte count, or triglyceride or uric acid concentration. We found a small but significant increase in nestling hematocrit associated with nest material replacement, implying that parasites may induce nestling anemia. Contrary to our expectations, we also found elevated heterophil/lymphocyte ratios in nestlings with replacements, possibly indicating elevated physiological stress associated with nest replacements. Based on our results, we do not recommend nest material replacements to combat routine parasite infestations.
Resumen
Progne subis subis tiene una relación inusualmente cercana con los humanos, ya que nidifica exclusivamente en cajas nido hecha por humanos. La política actual de conservación promueve directamente una mayor interacción con esta especie, recomendando el reemplazo regular de materiales del nido durante la fase de polluelo para reducir la carga de ectoparásitos y aumentar la adecuación biológica de los polluelos. Realizamos el primer test sobre la eficacia de esta recomendación y encontramos que fue parcialmente efectiva en reducir la abundancia de parásitos, pero no tuvo efecto en el éxito de emplumamiento del polluelo, en la masa corporal, en el recuento de leucocitos, o en las concentraciones de triglicéridos o de ácido úrico. Encontramos un aumento pequeño pero significativo en el hematocrito de los polluelos asociado con el reemplazo del material del nido, implicando que los parásitos pueden inducir anemia en los polluelos. Contrariamente a nuestras expectativas, también encontramos cocientes elevados de heterófilos/linfocitos en los polluelos con reemplazos, indicando posiblemente un estrés fisiológico elevado asociado con los reemplazos del nido. Basados en nuestros resultados, no recomendamos el reemplazo de los materiales del nido para combatir las infestaciones rutinarias de parásitos.
Lay Summary
• Purple Martins are believed to have a high abundance of blood-feeding parasites (fleas, mites, and blowfly larvae) in their nests.
• A current conservation policy recommends that nest box managers regularly remove and replace nest materials during the nestling phase to reduce parasite abundance. We tested the efficacy of this policy.
• Nest replacements reduced flea and blowfly larvae abundance, but mite abundance rebounded quickly.
• There was no difference in fledging rate, body mass, white blood cell count, or triglyceride or uric acid levels for nestlings with or without nest replacements.
• Nestlings with nest replacements were less anemic and had a higher ratio of heterophils to lymphocytes.
INTRODUCTION
Humans often encourage interactions with birds through nest box provisioning, or bird feeding, through which birds can benefit (Robb et al. 2008, Libois et al. 2012), and humans report reduced stress through an increased connection to nature (Cox and Gaston 2016). Even these seemingly positive interactions may, however, have unintended negative consequences; supplemental feeding can spread wildlife disease (Dhondt et al. 2007, Becker and Hall 2014, Murray et al. 2016) and poorly situated nest boxes could become ecological traps (Mänd et al. 2005, Klein et al. 2007). From a conservation perspective, understanding which human–wildlife interactions are truly beneficial, and which pose risks to either humans or wildlife, is an essential step in defining practical policy.
Purple Martins (Progne subis) are migratory aerial insectivores. Like many species in their guild, their populations are in decline across their range (Tautin et al. 2008, Nebel et al. 2010, Sauer et al. 2017). The species has an unusually close association with human settlements, with the eastern subspecies (P. subis subis) having shifted from nesting in natural cavities to provisioned nest boxes (Raleigh et al. 2019, Brown and Tarof 2020). The abundance and impact of hematophagous ectoparasites in nest boxes are generally thought to be high (Moss and Camin 1970, Hill 1994) and possibly exacerbated by the derived colonial habit of P. subis subis. Also, their relatively long nestling period and cavity nesting itself lead to a favorable microclimate for parasite population growth and transmission between individuals (Møller et al. 1990). Parasite species and abundances likely vary across the range of the Purple Martin, but nest-associated hematophagous ectoparasites commonly include bird blowfly larvae (Protocalliphora spp.), mesostigmatid mites (Dermanyssus spp.), and fleas (Ceratophyllus spp.) (Moss and Camin 1970, Kostka and Hill 1994).
The emergence of human-dependence in Purple Martins implies that effective conservation management during the breeding season has a high potential to affect nesting success (Raleigh et al. 2019). The Purple Martin Conservation Association (PMCA) is the leading conservation group for the species and is dedicated to using scientific research, public education, and management techniques to increase Purple Martin populations across North America (http://www.purplemartin.org/). To mitigate a perceived fitness cost of nest ectoparasites on martin nestlings, the PMCA advises martin “landlords” to replace nest material when nestlings are 10 days old (or earlier in the case of severe infestations) and again at 20 days old (nestlings fledge at 28 days on average) (Kostka and Hill 1994). To complete a nest replacement, landlords must carefully remove nestlings from their cavity, remove all nesting material and scrape the base of the nest box to remove parasite larvae and eggs, replace nesting material with wood shavings or dry pine needles, and replace the nestlings.
Uptake of this policy has been relatively high with almost 20% of respondents to a recent PMCA member survey (n = 1,694; http://www.purplemartin.org/) stating that they both perceived a high parasite load in their colonies and undertook regular nest changes to combat them. This policy of manual parasite removal is easily achieved by Purple Martin landlords and has intuitive appeal, especially since heavy nest parasite infestations have often been associated with fitness costs for nestlings, particularly in cavity-nesting species (Møller et al. 1990). High abundance of ectoparasites has been associated with decreased hatching success (Oppliger et al. 1994), decreased nestling survival (Merino and Potti 1995, Edworthy et al. 2018), and decreased nestling mass (Moss and Camin 1970, Fitze et al. 2004). Beyond the relatively coarse survival and mass metrics, researchers have also often used blood-based measures to show an effect of nest-dwelling invertebrates on birds. Ectoparasitism has been associated with decreased hematocrit levels indicative of infection, anemia, and nutritional deficiency (Potti et al. 1999), and with elevated leukocyte counts (Dufva and Allander 1995) and heterophil/lymphocyte (H/L) ratios (Gross and Siegel 1983, Maxwell and Robertson 1998, Moreno et al. 2002, Owen 2011), indicative of immunological challenge. Parasitism may also result in altered nutritional status of nestlings, which can be determined through plasma metabolites, such as triglycerides and uric acid; high concentrations are associated with fat and protein absorption in the hours prior to blood sampling (Jenni-Eiermann and Jenni 1991, Lopez-Arrabe et al. 2015) and often positively correlate with other body condition metrics (Masello and Quillfeldt 2004, Quillfeldt et al. 2004, Lopez-Arrabe et al. 2015). Plasma metabolites can also provide an index of feeding rate (Zajac et al. 2006), and as such may also reflect an adult’s provisioning rate in response to nest ectoparasitism, whether that be through a compensatory increase in feeding (Johnson and Albrecht 1993) or through a reduced rate associated with their own parasite-induced decline in body condition (Wagner et al. 1997, Tomas et al. 2007).
However, while nest ectoparasites often have a deleterious effect on their nestling hosts, results of other investigations are equivocal or do not show negative effects on nestlings (Møller et al. 1990, Rogers et al. 1991, Sanchez et al. 2018), raising the possibility that nest changes for Purple Martins are an unnecessary intervention. In the absence of a fitness cost of parasitism, nest changes may represent an unnecessary stressor to nestlings, as handling of wildlife by untrained individuals is generally not advised because of the potential for causing stress or injury (Sockman and Schwabl 2001). Finally, the humans undertaking nest changes may be exposed to potential avian-associated zoonoses such as avian influenza, Salmonella, West Nile Fever, Lyme disease, Campylobacter (Abulreesh et al. 2007), and Bartonella (Williams and Dittmar 2020), which may be transmitted while handling the birds or their nesting materials, or when bitten by nest fleas or mites (du Feu 1987, George et al. 2015, Kavallari et al. 2018).
We evaluated the efficacy of Purple Martin nest replacements during the nestling stage through a controlled experiment over a 3-yr period. Parasite load in nests with and without nest replacements was assessed to test the hypothesis that replacements significantly reduce the in-nest abundance of the 3 most prevalent and abundant hematophagous ectoparasites in this system, namely, Ceratophyllus idius, Dermanyssus prognephilus, and Protocalliphora sialia (fleas, mesostigmatid mites, and bird blowfly, respectively). We also tested the hypothesis that nest changes are associated with increased fledging rate or improved body condition through a wide variety of metrics (body mass, hematocrit, leukocyte count, H/L, triglyceride concentration, and uric acid concentration). By conducting a multi-year study, assessing multiple condition metrics, and obtaining a relatively large sample size, we provide a powerful and rigorous test of an active conservation policy and evaluate the case for promoting human–wildlife contact in this context.
METHODS
Field Site
Fieldwork was carried out at Iroquois National Wildlife Refuge and Tonawanda and Oak Orchard Wildlife management areas in Genesee County, New York State, in the summers of 2016, 2017, and 2018 (Figure 1A,B). Nine Purple Martin colonies, with a total of 140 individual nest sites, were included in each study year. Nest box designs included wooden houses (Troyer T14) (n = 84) and artificial gourds (Troyer horizontal gourds, McKean, Pennsylvania, USA) (n = 56) (Figure 1C). All nest boxes had predator guards and modified entrance holes to exclude European Starlings (Sturnus vulgaris) and were managed for other local nest site competitors including House Sparrows (Passer domesticus). All colonies in the study were used by Purple Martins for at least 2 yr prior to the start of the study and have been maintained and managed by Fish and Wildlife Service and Department of Environmental Conservation staff and volunteers. Nest boxes were cleaned out at the end of each nesting season and were washed with diluted bleach, then rinsed and dried before the following season.
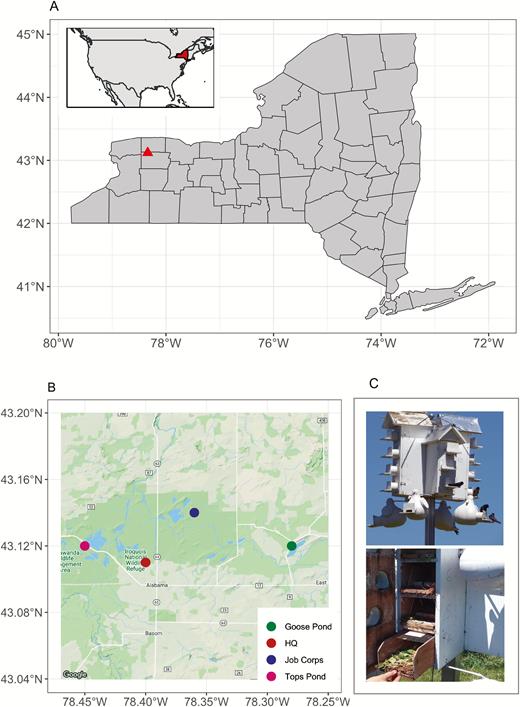
(A) Map showing the of the study site (Iroquois National Wildlife Refuge and Tonawanda and Oak Orchard Wildlife Management Areas) within New York State. The inset map shows the location of New York State within North America. (B) Map showing the location of Purple Martin (Progne subis) colonies within the study site. (C) View inside the multi-unit T-14 trays with the door opened (upper) and Purple Martin housing with the single-unit artificial gourds and the multi-unit T14 wooden houses (lower).
Nest Replacement Protocol
Individual nests were assigned to a control group (no nest replacements) or an experimental group (nest replacements) in a within-colony alternating pattern such that each control nest was neighbored by an experimental nest on either side. This applied to both the individual gourds and to the multi-unit boxes. We sealed small gaps between nest boxes in the multi-unit boxes with caulk before the first field season began to prevent parasites moving between cavities, and we coated the open edge of each nest box with petroleum jelly to prevent them moving between the hinged door and the edges of nest box trays (Figure 1C).
Nest material in experimental nests was replaced every 6–8 days while nestlings were aged between 5 and 21 days old, resulting in 2 or 3 replacements per nest depending on the exact age of nestlings at the first change (range: 5–11 days old). Handling nestlings older than 21 days is not recommended as it can result in premature fledging. In a nest change, all loose nest material was removed and placed into a sealable polythene bag. We used paintbrushes and scrapers to remove the remaining nest material and parasites into our collection bag. Nest material was replaced with ~50 g of dried pine needles. Samples of pine needles were examined prior to each field season for the presence of parasites, but none were ever found. Due to the alternating study design, all nests within a colony were disturbed and prevented from feeding for the same duration regardless of whether they received nest replacements. Although all nestlings in the study were handled (for banding, mass measurement, and blood draw), nestlings in the experimental group were handled more extensively than the control nestlings during nest replacements as part of the experimental protocol. We collected nest material from both experimental and control nests as soon as possible after the birds fledged using the same protocol.
All collected samples of nest material were processed using Berlese funnels. Nest material was placed under a heat lamp for 2–3 hr, and parasites were collected in ethanol. Preliminary work indicated that 3 hematophagous parasite species were by far the most abundant and prevalent: Ceratophyllus idius (hereafter “flea”), Dermanyssus prognephilus (hereafter “mite”), and Protocalliphora sialia (hereafter “blowfly larva”). Parasites were identified via morphology following Traub et al. (1983), Sabrosky et al. (1989), and Moss (1968), respectively, using a Zeiss microscope, White Plains, New York, USA. Using a dissecting microscope, we counted adult fleas, blowfly larvae, and adult mites in each ethanol sample. When counts of a single species in a single nest reached 200 individuals, we stopped counting individuals and estimated total abundance based on the proportion of nest material processed. We sorted through the dry nest materials to recover blowfly pupal cases. Other hematophagous parasite species such as chewing lice and biting midges did occur in some nests but had low prevalence and abundance in comparison with the fleas, mites, and blowfly, and were omitted from analysis.
Nestling Measurements
Nest checks were conducted weekly at each colony and the progress of each nest noted in terms of the number and age of nestling present, number of fledged nestlings, and number of dead nestlings. Nestlings were considered to have successfully fledged when missing from the nest after day 25 (Purple Martins usually fledge between day 26 and day 32; Allen and Nice 1952, Brown and Tarof 2020). Dead nestlings were removed from nests. Nestlings were banded to allow individual identification between 12 and 20 days old (mean = 14). We weighed each nestling at the time of banding on a digital scale. In 2017 and 2018 we also took scaled digital photographs of nestling tarsi to enable accurate measurement (Williams et al. 2020) and calculation of scaled body mass (Brown 1996). A subset of nests was fitted with in-nest video cameras as part of a parallel study (Williams and DeLeon 2020). Using footage from these cameras we determined the time in minutes prior to blood sampling that all nestlings in a brood were fed (e.g., the time for 5 provisioning events in a brood of 5 nestlings with the assumption that all nestlings are fed one prey item before a second round of provisioning begins).
Blood Sampling
Blood was drawn from a subset of nestlings in 2017 and 2018 when nestlings were between 16 and 20 days old. We aimed to sample the largest and smallest nestling from each nest selected for blood sampling. In each case blood was drawn from the brachial vein using a 27.5-gauge needle to collect a maximum of 140 µL of blood in heparinized microhematocrit capillary tubes. Blood samples were kept on ice in the field until being stored at –70°C later in the day until samples were processed. Blood samples were used to determine hematocrit, triglyceride, and uric acid concentrations, leukocyte count and H/L ratio. Not all assays were performed with all samples due to limited blood volumes.
We measured hematocrit by centrifuging one microhematocrit capillary tube full of blood at 12,000 revolutions per minute for 8 min (Potti et al. 1999). We used digital calipers to measure the total height of the sample and the height of the packed cell layer. Hematocrit was then calculated as the proportion of packed cells to total blood volume.
Plasma metabolites (triglyceride and uric acid concentrations) were measured using a colorimetric endpoint assay using a microplate spectrophotometer (Bio Tek EON and Gen5 2.01 software). Sample concentrations were measured alongside known standard concentrations following Guglielmo et al. (2005) and Smith and McWilliams (2009) for triglyceride and uric acid concentrations, respectively. Measurements were repeated until the coefficient of variation was <10% between all duplicates, except for 3 samples for uric acid and 5 triglyceride samples, which were <15% (Seewagen et al. 2015).
Finally, we used one drop of blood from each nestling sample to make a smear slide. Slides were stained with Wright-Giemsa 3-step stain (VWR Hematology Quick Stain Category No. 10143–224). Using the oil immersion lens of a compound microscope at 1,000x magnification, we counted the total number of leukocytes per 100 fields of view (Horak et al. 1999) with separate counts of heterophils and lymphocytes to estimate the H/L ratio.
Analysis of Parasite Load
Comparison of parasite load between experimental and control nests is not straightforward due to differences in collection regimes. For example, there are likely to be unquantified differences between the study groups in how long a parasite has been in the nest at the time of collection and how many parasites have escaped the nests prior to collection.
To allow comparison of flea and mite loads across experimental conditions over a controlled duration, in 2018 we put a 125 × 75 mm sticky insect sheet (BioQuip Products, Item 2872) into a subset of nest cavities such that fleas and mites might adhere to the surface, but it should not have come into contact with the birds. We left these strips in the nests for 1 week from the time the nestlings were old enough for nest replacements (≥5 days) and continued to replace them weekly until each nest had fledged. By counting the parasites stuck to these strips we were able to directly compare parasite loads between control and experimental nests with a controlled exposure duration.
We log-transformed the daily counts of mites and fleas from each insect sheet to improve their adherence to a normal distribution. In addition to experimental condition, these counts could be affected by factors intrinsic to each nest, including the number of hatchlings (4–6), the age of nestlings during the collection, and the collection date. To include these factors, we used general linear mixed models to predict the number of fleas and mites with nest box as the random factor to account for the repeated collections from the same nest. We used backwards stepwise regression for model selection and considered an experimental effect to be significant when experimental condition was included in the final model with P < 0.05.
Unlike mites and fleas, blowfly abundance can be directly compared between experimental and control nests (despite the differences in collection regimes), because of its life cycle and using counts of pupal cases. The blowfly life cycle begins when adult females oviposit in a bird’s nest, generally soon after bird eggs hatch (Sabrosky et al. 1989). Development is temperature-dependent (Dawson et al. 2005), but larvae (the only blood-feeding life stage) typically emerge from eggs after 2 days and remain in the blood-feeding larval stage for 11 days before pupating (Gold and Dahlsten 1983, Bennett and Whitworth 1991). After adults emerge from these pupae, pupal cases remain in the nests. This means that a pupa or pupal case counted in our collection implies an 11-day impact on nestlings, whereas a larva may have affected nestlings for a maximum of 11 days depending on its age at the time of collection. This window of larval action can be further constrained where a nest change or eggs have hatched less than 11 days ago (under the assumption that all larvae, but not necessarily eggs, are removed during nest changes and female blowfly only oviposit after bird eggs have hatched). We measured each blowfly larva to estimate its body volume and combined this with a growth curve to estimate their age in days (Williams and DeLeon 2020). The number of blowfly larvae in each nest collection was then scaled by their age, such that a 5-day-old blowfly was considered to have caused 5/11 of the impact of a blowfly pupae as it had only completed 5 of its 11 blood-feeding days. We then compared total estimated blowfly larval equivalents (sum of pupae and pupal cases + scaled sum of blowfly larvae) between experimental and control nests using a Mann–Whitney U-test (due to a non-normal distribution).
Analysis of Nestling Fitness
Fledging rate
Fledging rate was defined as the proportion of nestlings per nest which successfully fledged out of the number of nestlings still alive when nest replacements began. This definition avoids including nestling mortality that occurred before nest replacements began in the analysis. For control nests the “number of nestlings still alive when nest replacements began” was defined as brood size at 5 days old. As nests with mortality were relatively rare in the dataset, and nests with at least one nestling mortality were more likely to experience further mortalities, we used nest fledging success as a binary response variable where we differentiate between nests with no mortality after nest replacements began and nests where one or more nestlings died.
Fledging success was thus used as the response variable in a binomial general linear model. The global model included experimental condition (control or experimental), site (Headquarters, Tops Pond, Job Corps or Goose Pond; see Figure 1B), nest box type (gourd or cavity), brood size, study year, ordinal hatch date, and the interaction between year and ordinal hatch date as candidate predictors. We ranked all possible combinations of these predictors (such that each predictor is included in models the same number of times) with AICc and ranked their importance by summing the Akaike weights over all models in which a parameter appears using the R package MuMIn (Bartoń 2018). We based our inference on parameter estimates from the models with ΔAICc values of <2 in each case (Burnham and Anderson 2002, Symonds and Moussalli 2011). We conducted post-hoc Tukey’s honest significant difference (HSD) tests to check whether experimental condition was a significant predictor of fledging success after correcting for important covariates. Specifically, we ran a second regression model including all variables with a parameter importance greater than 0.5, and then used the residuals of this relationship as the dependent variable in a Tukey HSD test.
Body mass
Nestling body mass was squared to improve adherence to a normal distribution and then used as the response variable in a general linear mixed model. The global model included experimental condition, nestling age, site, nest box type, brood size, study year, ordinal hatch date, and the interaction between year and ordinal hatch date as fixed predictors with nest identity as a random factor to account for multiple nestlings from the same nest. We used the same AICc model selection procedure as detailed above for analysis, and marginal and conditional pseudo R2 was calculated for the model with the lowest AICc. We used the same post-hoc test procedure as used for fledging success to check for a significant effect of experimental condition after correcting for covariates. A parallel analysis was conducted using scaled body mass (where the response variable was the residuals from the mass ~ tarsus regression) with the subset of mass samples matched with tarsus. As parasites are often aggregated among their potential hosts (Christie et al. 1998, Poulin 2007), we tested whether there was a significant difference in the within-nest range of nestling masses between control and nest replacement tests using a T-test.
Blood-based condition metrics
Hematocrit, leukocyte count, H/L, and triglyceride and uric acid concentrations were used as response variables in a set of general linear mixed models. Leukocyte count, H/L, and triglyceride and uric acid concentrations were log-transformed to improve adherence to a normal distribution prior to analysis.
The global model for hematocrit, leukocyte count, and H/L included experimental condition, study year, time of day that blood was drawn, minutes of disturbance prior to blood sampling, site, nest box type, ordinal hatch date, brood size, nestling age, nestling mass, the maximum temperature of the previous day, and the total rainfall over the previous day as fixed predictors, with nest identity as a random factor to account for multiple nestlings from the same nest. The global model for triglyceride and uric acid concentrations included the same candidate predictors as the other blood metrics, with the exception that temperature and rainfall were included over the 3 hr (rather than 24 hr) prior to blood sampling as plasma metabolite level is expected to respond more quickly to environmental conditions (Jenni-Eiermann and Jenni 1991). We used the same AIC protocol for model selection and estimation and the same post-hoc test protocol to check for the effect of experimental condition, as detailed above. Finally, we conducted parallel analyses of triglyceride and uric acid concentrations for the subset of samples for which we have provisioning rate data.
All statistical analyses and figures were produced using R Studio (RStudio Team 2015) in the R statistical environment, 3.5.2 (R Development Core Team 2018).
RESULTS
Analysis of Parasite Load
Nest changes did not significantly reduce the abundance of mites in the nest over a 7-day period after controlling for other factors (estimate = –0.13, standard error [SE] = 0.65, T(9.97) = –0.20, P = 0.85, ncontrol = 17 from 7 nests, nparasite reduction = 25 from 7 nests) (Figure 2A). Conversely, flea abundance was halved by nest changes (estimate = –1.25, SE = 0.44, T(11.34) = –2.83, P = 0.02) (Figure 2B). Finally, nest changes significantly reduced the exposure of nestlings to the blood-feeding larval stage of blowfly from a mean of 25.4 (SD = 45.36) to 15.3 (SD = 29.90) complete larval stages (z215 = 4515, P < 0.001, ncontrol = 151 nests, nparasite reduction = 160 nests) (Figure 2C).
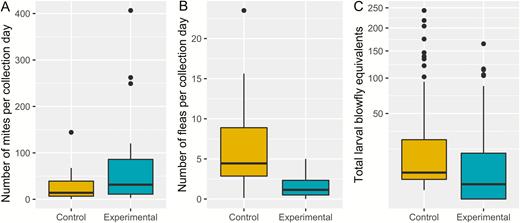
Effect of nest material replacements for Purple Martin (Progne subis) nestlings in western New York State on parasite abundance of (A) mites, (B) fleas, and (C) blowfly larvae in 3 breeding seasons (2016–2018). Lower and upper hinges on boxes represent the 25th and 75th percentile of data, respectively, with bold horizontal line showing the median value. Lower and upper whiskers show the lowest and highest values (excluding outliers), respectively, with upper outliers (values more than 1.5 times the interquartile range) shown as black points. Note the square root transformation on the y-axis in (C).
Analysis of Nestling Fitness
Our analysis was based on a maximum sample size of 704 nestlings from 160 nests in the control condition and 705 nestlings from 151 nests in the parasite-reduction condition. Sample sizes for specific analyses vary and are detailed in the relevant sections below.
Fledging success
Overall fledging rate was 95% (1,283 fledglings of 1,356 nestlings) after day 5 of nestling life with just 15% (45 of 311) nests in the study experiencing any mortality (Table 1). Causes of mortality for nestlings are unknown, but we presume predation to be low due to the predator exclusion features of nest boxes and the fact that dead nestlings were generally found in nest boxes rather than missing from brood counts. Summed Akaike weights indicated that hatch date (estimate = –0.15, SE = 0.04, Z = –3.63, P < 0.001), year (estimate = –34.95, SE = 12.63, Z = –2.77, P = 0.006; estimate = –15.94, SE = 8.13, Z = –1.96, P = 0.05), the interaction between year and hatch date and brood size (estimate = –0.39, SE = 0.17, Z = –2.25, P = 0.02) were the most important determinants of fledging success, with nest box type, site, and experimental condition having lower importance (Table 2, Supplementary Material Table S1A). Fledging success was higher in 2017 and 2018 than in 2016 (Supplementary Material Figure S1A), decreased with brood size (Supplementary Material Figure S1B), and decreased with hatch date in 2016 and 2017, but not in 2018 (Supplementary Material Figure S1C). Post-hoc tests did not show any difference in fledging success by experimental condition after correcting for informative variables (Table 3).
Fledging success and uncorrected summary metrics of body mass and condition indices for Purple Martin (Progne subis) nestlings between the experimental (parasite reduction treatment) and control treatments in 3 yr of study (2016, 2017, and 2018) at colonies in western New York State.
| Experimental | Control | |||
|---|---|---|---|---|
| 85% (n = 151) | 86% (n = 160) | |||
| Fledging success | Mean (SD) | Range | Mean (SD) | Range |
| Nestling body mass (g) | 52.06 (6.22) | 25.9–65.4 | 52.35 (6.01) | 22.2–65.2 |
| Hematocrit | 0.38 (0.06) | 0.21–0.48 | 0.33 (0.05) | 0.20–0.43 |
| Leukocytes per 10,000 erythrocytes | 427 (213) | 146–649 | 445 (243) | 140–1304 |
| Heterophil/lymphocyte ratio | 7.21 (4.89) | 1.69–24.36 | 4.23 (3.43) | 0.52–13.34 |
| Triglyceride (mmol L–1) | 1.65 (0.79) | 0.39–4.23 | 2.18 (1.32) | 0.63–6.50 |
| Uric acid (mmol L–1) | 1.27 (0.57) | 0.07–2.19 | 1.52 (1.22) | 0.19–6.16 |
Relative parameter importance of variables explaining fledging success, nestling body mass and condition indices for Purple Martins (Progne subis) based on the Akaike sum of weights. Parameters retained in the most parsimonious model are shown in bold. The direction of the relationship is indicated with + or – for continuous predictors maintained in the most parsimonious model analysis.
| Response variable | |||||||
|---|---|---|---|---|---|---|---|
| Candidate predictors | Fledging success | Body mass (g) | Hematocrit | Leukocytes per 10,000 erythrocytes | Heterophil/ lymphocyte ratio | Triglyceride (mmol L–1) | Uric acid (mmol L–1) |
| Experimental condition | 0.27 | 0.98 | 0.63 | 0.10 | 0.99 | 0.19 | 0.14 |
| Site | 0.17 | 1.00 | 0.01 | 0.10 | <0.01 | <0.01 | <0.01 |
| Year | 0.95 | 1.00 | 0.02 | 0.12 | <0.01 | <0.01 | <0.01 |
| Ordinal hatch date | 1.00(–) | 1.00 (–) | <0.01 | 0.07 | <0.01 | <0.01 | <0.01 |
| Year*Ordinal hatch date | 0.88 | 1.00 | NA | NA | NA | NA | NA |
| Nest box type | 0.46 | 0.98 | 0.04 | 0.10 | <0.01 | <0.01 | <0.01 |
| Brood size | 0.81 (–) | 1.00 (–) | <0.01 | 0.53 (–) | 0.05 | 0.16 | 0.04 |
| Age | NA | 1.00 (+) | <0.01 | 0.30 | 0.11 | 0.02 | 0.02 |
| Time of blood sampling | NA | NA | 0.11 | 0.51 (+) | 1.00 (+) | 0.79 (+) | 0.99 (+) |
| Minutes disturbed before blood draw | NA | NA | <0.01 | 0.02 | <0.01 | <0.01 | <0.01 |
| Mass | NA | NA | <0.01 | 0.12 | 0.01 | <0.01 | 0.01 |
| Maximum temperature over 24 hr | NA | NA | <0.01 | 0.02 | 0.02 | NA | NA |
| Total rainfall over 24 hr | NA | NA | <0.01 | 0.23 | 0.24 | NA | NA |
| Maximum temperature over 3 hr | NA | NA | NA | NA | NA | 0.90 (+) | 0.03 |
| Total rainfall over 3 hr | NA | NA | NA | NA | NA | 0.02 | 1.00 (–) |
Results of post-hoc Tukey HSD test for effect of experimental condition after correcting for the effects of parameters with a variable importance of at least 0.5. Statistically significant comparisons are shown in bold. Mean and standard deviation values are based on the residuals from the regressions adjusting for parameters with a variable importance of at least 0.5 (not including experimental condition).
| F | df | P | Mean residual value (SD): Control | Mean residual value (SD): Experimental | |
|---|---|---|---|---|---|
| Fledging success | 0.226 | 309 | 0.635 | 0.11 (2.79) | –0.07 (3.74) |
| Body mass (g) | 0.155 | 1407 | 0.694 | –3.53 (343.72) | 3.53 (330.39) |
| Hematocrit | 4.940 | 100 | 0.029 | –0.006 (0.03) | 0.007 (0.04) |
| Leukocyte count per 10,000 erythrocytes | 0.033 | 96 | 0.856 | –0.004 (0.24) | 0.004 (0.18) |
| Heterophil/lymphocyte | 5.344 | 96 | 0.023 | –0.07 (0.34) | 0.07 (0.27) |
| Triglyceride (mmol L–1) | 0.644 | 66 | 0.425 | 0.02 (0.15) | –0.02 (0.19) |
| Uric acid (mmol L–1) | 0.375 | 93 | 0.542 | 0.02 (0.27) | –0.02 (0.28) |
Body mass
We obtained mass data for 1,409 nestlings from 311 nests (ncontrol = 704, nparasite reduction = 705) (Table 1). Summed Akaike weights indicated little variation in the relative importance of parameters included in the model (Table 2), implying all explanatory variables considered had a small but distinct role in determining body mass. Accordingly, the global model was shown to be the most parsimonious according to AICc rankings, and the only model with ΔAICc < 2 (pseudo-R2marginal = 0.26, pseudo-R2conditional = 0.63) (Supplementary Material Table S1B). Nestling body mass increased slightly with nestling age (Supplementary Material Figure S2A); was lower in 2018; varied by site; decreased with ordinal hatch date (Supplementary Material Figure S2B); was greater in gourds than cavities, decreased with brood size (Supplementary Material Figure S2C); and was greater in experimental nests (although this difference was not statistically significant) (Table 2). Post-hoc tests also did not show any difference in body mass by experimental condition after correcting for important variables (Table 3). Results for the parallel study in which body mass was scaled by tarsus were qualitatively similar, the top model explained a similar amount of variation (pseudo-R2marginal = 0.19, pseudo-R2conditional = 0.61, n = 724) and did not support a strong effect of experimental condition (Supplementary Material Table S2). There was no evidence for an increased range of within-brood body mass in control nests compared with nest replacement nests (T(294.4) = –1.22, P = 0.22, meancontrol = 7.02 g, SDcontrol = 4.61, meanparasite reduction = 7.69 g, SDparasite reduction = 4.83, n = 298 nests).
Hematocrit
We obtained hematocrit measurements for 102 nestlings from 56 nests (ncontrol = 54, nparasite reduction = 48) (Table 1). Summed Akaike weights indicated that experimental condition was by far the most important predictor for hematocrit (Table 2) and was the only retained predictor in the most parsimonious model, although there was a relatively low predictive power (pseudo-R2marginal = 0.13, pseudo-R2conditional = 0.53), and the second most parsimonious model only included the intercept and random effects of nest identity (Supplementary Material Table S1C). Mean hematocrit increased from 0.33 in control nests to 0.38 in parasite reduction treatment nests (Figure 3). Post-hoc tests supported this difference after correcting for nest level variation (Table 3).
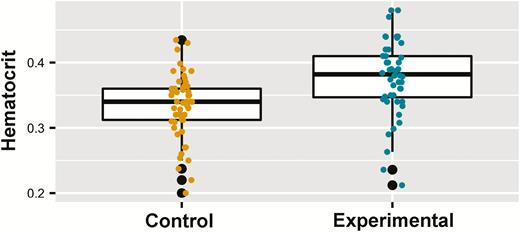
Effect of nest material replacements on Purple Martin (Progne subis) nestling hematocrit over 2 breeding seasons (2017–2018) in western New York State. Yellow and turquoise points show raw data from the control and experimental groups, respectively. Lower and upper hinges on boxes represent the 25th and 75th percentile of data, respectively, with the bold horizontal line showing the median value. Lower and upper whiskers show the lowest and highest values (excluding outliers), respectively, with outliers (values above or below 1.5 times the interquartile range) shown as black points.
Leukocyte count
We obtained leukocyte counts for 98 nestlings from 52 nests (ncontrol = 49, nparasite reduction = 49) (Table 1). The most parsimonious model (pseudo-R2marginal = 0.10, pseudo-R2conditional = 0.72) retained time of blood draw and brood size as predictors, where leukocyte count increased when blood was drawn later in the day (Table 2, Supplementary Material Figure S3A), and decreased with increased brood size (Supplementary Material Figure S3B, Supplementary Material Table S1D). However, there was considerable model uncertainty with 4 models having ΔAICc < 2 (Supplementary Material Table S1). Post-hoc tests did not show any difference in leukocyte by experimental condition after correcting for important variables (Table 3).
Heterophil/lymphocyte
We obtained H/L for 98 nestlings from 52 nests (ncontrol = 49, nparasite reduction = 49) (Table 1). The most parsimonious model (the only model with ΔAICc < 2) (pseudo-R2marginal = 0.36, pseudo-R2conditional = 0.69) retained time of blood draw and experimental condition as predictors, where H/L increased when blood was drawn later in the day (Table 2, Supplementary Material Figure S4), and was higher in the experimental parasite reduction treatment brood size (Figure 4, Supplementary Material Table S1E). Visualization of data highlighted one potential outlier (H/L ratio = 24.36). When analysis was repeated with the exclusion of this outlier the results were qualitatively the same, so we maintained the data point in the analysis. Post-hoc tests supported an increased H/L in experimental parasite reduction nests after correcting for important variables (Table 3).
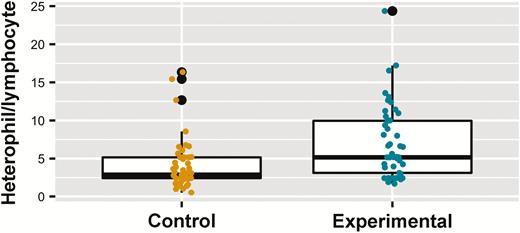
Effect of nest material replacements on Purple Martin (Progne subis) nestling heterophil/lymphocyte ratio over 2 breeding seasons (2017–2018) in western New York State. Yellow and turquoise points show raw data from the control and experimental groups, respectively. Lower and upper hinges on boxes represent the 25th and 75th percentile of data, respectively, with the bold horizontal line showing the median value. Lower and upper whiskers show the lowest and highest values (excluding outliers), respectively, with outliers (values above or below 1.5 times the interquartile range) shown as black points.
Triglyceride concentration
We obtained measurements of plasma triglyceride concentration for 68 nestlings from 46 nests (ncontrol = 34, nparasite reduction = 34) (Table 1). The most parsimonious model (the only model with ΔAICc < 2) (pseudo-R2marginal = 0.24, pseudo-R2conditional = 0.79) retained only these factors in the model, where triglyceride concentration increased when blood was drawn later in the day (Supplementary Material Figure S5A), and with temperature (Table 2, Supplementary Material Figure S5B, Supplementary Material Table S1F). When the effect of provisioning rate on triglyceride concentration was considered (n = 30), it was not highlighted as an important predictor. Post-hoc tests did not show any difference in triglyceride concentration by experimental condition after correcting for important variables (Table 3).
Uric acid concentration
We obtained measurements of plasma uric acid concentration for 95 nestlings from 53 nests (ncontrol = 50, nparasite reduction = 45) (Table 1). The most parsimonious model (the only model with ΔAICc < 2) (pseudo-R2marginal = 0.63, pseudo-R2conditional = 0.84) retained only these factors in the model, where uric acid concentration increased when blood was drawn later in the day (Supplementary Material Figure S6A), and declined with increasing rainfall (Supplementary Material Figure S6B, Table 2, Supplementary Material Table S1G). When the effect of provisioning rate on uric acid concentration was considered (n = 30), its inclusion did not outcompete the most parsimonious model. Post-hoc tests did not show any difference in uric acid concentration by experimental condition after correcting for important variables (Table 3).
DISCUSSION
We found that nest replacements resulted in significantly reduced abundance for 2 of the 3 most prevalent and abundant ectoparasite species of Purple Martins, but did not result in significant differences in fledging success, nestling body mass, leukocyte count, or plasma metabolite concentrations. Increased nestling hematocrit and H/L were, however, associated with nest material replacements.
While nest changes were associated with a significant and enduring decline in the abundance of fleas and blowfly larvae, the procedure did not eliminate these parasites. Furthermore, there was no evidence for a reduction in mite abundance over a 1-week time period. In practice, not all individual parasites were removed during a nest change as some were inaccessible in tight corners of nest cavities and underneath gourd traction strips. Similarly, it is possible that eggs of any or all of the 3 parasite species were missed during nest changes. Given the short life cycles of mites (6–10 days) (Tucci et al. 2008) in particular, any nymphs or eggs missed during a nest change could potentially develop and multiply within 1 week, limiting nest changes to a short-term abundance reduction for this parasite species. Finally, our alternating study design means that control and parasite reduction nests were in close proximity, raising the possibility of parasite movement between conditions (although we took steps to reduce this risk), which might particularly affect mite populations, because they are the most mobile of the 3 parasite species. The reduction in blowfly larva, the largest parasite in this system with the highest potential for blood draw (Gold and Dahlsten 1983) was, however, more marked, meaning nestlings in nests with nest changes likely had a substantial reduction in overall blood loss compared with those in the control nests.
We found no evidence for a beneficial (or detrimental) effect of nest replacements for nestling fledging success, body mass, leukocyte count, or triglyceride or uric acid concentrations. Nor did we find evidence of an increased within-brood range of body mass in control nests, implying that ectoparasites in control nests are not aggregating on one nestling in a clutch. Nest changes resulted in increased nestling hematocrit, from a mean of 0.33 in control nests to a mean of 0.38. Although a modest increase, this increase takes nestlings beyond the commonly defined level of anemia (0.35) to a healthy level (Campbell and Dein 1984, Mitchell and Johns 2008), and implies that blood loss from hematophagous ectoparasites is not being completely compensated by increased nestling erythropoiesis (Johnson and Albrecht 1993, Merino and Potti 1995, Potti et al. 1999). However, we caution against placing too much weight on this result for 2 reasons. Firstly, considering both the AICc and log likelihood, the inclusion of experimental condition in the hematocrit model was only marginally more supported than a null model accounting only for nest identity (Arnold 2010). Secondly, hematocrit as a measure of body condition has been questioned as it has not always been found to correlate with other condition metrics and may also covary with nestling workload (Dawson and Bortolotti 1997, Cuervo et al. 2007, Fair et al. 2007, Potti 2007), meaning this result does not stand alone as compelling evidence of a parasite-mediated fitness effect.
The ratio of heterophils to lymphocytes is a widely accepted indicator of stress, where a relatively high heterophil count is generally associated with fighting infection and inflammation (Maxwell and Robertson 1998, Davis et al. 2008) and thus indicates poor body condition. Previous studies have associated a high ectoparasite load with a high H/L in nestling birds (Moreno et al. 2002, Lobato et al. 2005, Müller et al. 2011) and in reptiles (Knapp et al. 2019). Surprisingly, we found evidence for the opposite trend, where H/L was highest in the nests with decreased parasite load. One possible explanation for this is that the increased handling of nestlings in the parasite reduction treatment increased stress. Heterophil production increases, while lymphocyte production decreases in response to elevated corticosterone (Davis et al. 2008), which is, itself, frequently associated with handling stress (Sockman and Schwabl 2001). It may thus be that any beneficial decrease in H/L in the parasite reduction treatment nests due to reduction in the inflammatory response caused by ectoparasitism was negated by increased physiological stress associated with handling. A second possibility is that the original unchanged nest materials were conferring a benefit to the nestlings that was removed in nest changes. Purple Martins often line their nests with green leaves prior to egg laying (Brown and Tarof 2020). These leaves remained in the nests in the control group but were removed in the parasite reduction treatment. Although the function of the green leaves has not been tested in Purple Martins, the “drug hypothesis” suggests that aromatic properties of the plants could have a direct positive benefit on nestlings through mediation of the immune responses (Gwinner et al. 2000), or reduction of nest bacterial load (Gwinner and Berger 2005), plausibly explaining our unexpected finding of increased H/L where the green leaves were removed with the parasites. This hypothesis has gained experimental support with the findings of reduced bacterial load, increased nestling body mass and decreased lymphocyte count in European Starlings (Gwinner et al. 2000, Gwinner and Berger 2005), and increased rates of mass gain and feather development in Blue Tits (Cyanistes caerulus) incorporating aromatic green leaves in their nests (Mennerat et al. 2009). Further research could consider whether this behavior in the Purple Martins fulfills this function, or whether it is more associated with courtship (Viega et al. 2006) or reduction of nest ectoparasite load (Scott-Baumann and Morgan 2015). Finally, it should be noted that the mean H/L measurements in both control (4.23) and experimental groups (7.21) were high compared with literature results for other species (e.g., 0.45 and 0.62 in nestling Pied Flycatchers [Ficedula hypoleuca] [Moreno et al. 2002, Lobato et al. 2005], 1.2 in Eurasian Kestrels [Falco tinnunculus] [Müller et al. 2011], 0.8–1.4 in Red-tailed Tropicbirds [Phaeton rubricauda westralis] [Dehnhard et al. 2011]), and with our own results from Eastern Bluebirds (Sialia sialis) (mean H/L = 1.26) and Tree Swallows (Tachycineta bicolor) (mean H/L = 0.79) breeding sympatrically with these Purple Martins (H. M. Williams personal observation). This suggests that the Purple Martins in both groups may be stressed with an elevated immune response. In this scenario, the more heavily parasitized nestlings in the control group may have started with the same high H/L as in the nest replacement group, but were unable to sustain the cost of maintaining this elevated immune system as heterophils were depleted following ectoparasites triggering the immune response (Dufva and Allander 1995, Owen and Moore 2008).
That we found no effect of parasite load on fledging success, body mass, or leukocyte count implies that parasitized nestlings are able to tolerate the effect of these parasites (DeSimone et al. 2018) and that nest changes are neither beneficial nor detrimental to nestlings in terms of these metrics. Other studies have found only equivocal evidence for parasite effects in these measures (Rogers et al. 1991, Roby et al. 1992, Saino et al. 1998, Hannam 2006). We likewise found no effect of parasite load on nestling triglyceride or uric acid concentrations. This partially supports the findings of Quillfeldt et al. (2004) and Lopez-Arrabe et al. (2015), who found no effect of ectoparasite load on triglyceride concentration, but did associate reduced total plasma protein with increased ectoparasite load. This implies that the feeding rate for nestlings is similar across differing parasite loads, and was supported by a parallel study which showed only a small increase in provisioning rate for highly parasitized nests (Williams and DeLeon 2020). We did, however, find that plasma metabolite concentrations decrease in wet and cool weather which, given that provisioning responded closely to temperature in this population (Williams and DeLeon 2020), supports the use of these metrics as an index related to feeding rate (Zajac et al. 2006).
Our test of an active conservation policy aimed at reducing presumed fitness costs of ectoparasites on nestling birds yielded little evidence for its efficacy across a wide range of condition metrics (Brown 1996). Although there are likely cases of high parasite abundance, which may cause negative nestling fitness consequences, and would thus justify the nest replacement policy, it is not clear that they were reached in 3 yr of study at our study site. Based on our results and given the additional potential for human exposure to nest borne parasites and zoonoses associated with nest changes, we do not recommend that Purple Martin “landlords” complete nest changes for routine infestations. Our results may have management implications for other nestbox breeding species with similar assemblages of ectoparasites, such as Western Bluebirds (Sialia mexicana), Eastern Bluebirds, and Tree Swallows, for which nest replacements have also historically been promoted (Mason 1944). We further suggest that future research may consider whether there is a “tipping point” of parasite abundance that does result in negative fitness consequences in Purple Martins, how to recognize it, and whether nest changes can prevent it.
ACKNOWLEDGMENTS
We are grateful to the volunteers and staff at Iroquois National Wildlife Refuge who were involved in the project including Carl Zenger, Celeste Morien, Bob Schmidt, Tom Roster, and Paul Hess. We are also indebted to the many undergraduate students who assisted in the field, and counted parasites in the lab, including Logan Fahrenkopf, Joe Toth, Alyssa Gooding, Samantha Wilcox, Ramya Sridhar, Corinne Birchard, John McCarthy, Dan Muldoon, and Yu Yang.
Funding statement: This study was completed thanks to funding from the Purple Martin Conservation Association, the New York State and North American Bluebird Societies, and the Mark Diamond Research Fund. H.M.W. was supported through grant DEB-1556577 from the National Science Foundation.
Ethics statement: All fieldwork was completed under IACUC BIO02016N at the State University of New York at Buffalo, USA. All relevant permits and permissions were obtained, including US Fish and Wildlife Service monitoring and special use permit (#2016-002); US Fish and Wildlife Service scientific collecting permit (MB83070B-0); Federal bird banding permit (#08066); New York State Department of Environmental Conservation temporary revocable permit; New York State Department of Environmental Conservation license to collect or possess (scientific) (#1976); and New York State Department of Environmental Conservation license to collect or possess (banding) (#179).
Author contributions: H.M.W. and K.D. conceived the experiment. H.M.W. and S.S.P. performed experiments, developed methods, and analyzed data. H.M.W. wrote the paper and all the authors edited the manuscript.
Data availability: Analyses reported in this article can be reproduced using the data provided by Williams et al. (2020).
