


Abstract
Piscivorous birds are the primary source of catfish (Ictalurus spp.) depredation at aquaculture facilities in northwestern Mississippi. Of particular concern is the Double-crested Cormorant (Phalacrocorax auritus), which can cost aquaculture producers millions of dollars annually through the depredation of cultured fish. Historical research conducted in the early 2000s estimated cormorant use of aquaculture ponds in the region, but aquaculture area has decreased by more than 70% since those estimates were made. With less aquaculture available, we predicted cormorant densities on aquaculture would be greater today than historically. Applying a similar methodology as in historical studies, we used aerial surveys to collect data on cormorants at night roosts and using catfish aquaculture ponds during 3 consecutive winter seasons, beginning in 2015. Although the mean annual number of cormorants at roosts in the Delta during our study was 64% less than historically, we found no significant change in densities on aquaculture, suggesting that aquaculture area is likely the factor influencing cormorant occurrence in northwestern Mississippi. During contemporary surveys we also measured the abundance of Great Blue Herons (Ardea herodias) and Great Egrets (A. alba) on the aquaculture clusters, and built predictive models of abundance relative to variables associated with forage at and surrounding the clusters. We found abundance of all 3 species was strongly related to the amount of aquaculture area both within and surrounding a cluster, although patterns varied by species. Cormorant abundance was also greater on clusters with proportionately more food fish (≥20 cm in length) than fingerlings (<20 cm) and was positively related to the proximity and size of night roosts. The relationships described here can be used by producers and wildlife managers to predict the abundance of these piscivorous birds at aquaculture facilities and to design efficient management plans to mitigate potential impacts of depredation and disease.
Resumen
Las aves piscívoras son la principal fuente de depredación de bagres (Ictalurus spp.) en las instalaciones de acuicultura en el noroeste de Mississippi. Una preocupación particular es el cormorán Phalacrocorax auritus, que puede costarle millones de dólares anuales a los productores acuícolas a través de la depredación de los peces cultivados. Investigación histórica realizada a principios de la década de 2000 estimó el uso que hacen los cormoranes de los estanques de acuicultura en la región, pero la superficie de acuicultura ha disminuido más de un 70% desde que esas estimaciones fueron hechas. Con una menor acuicultura disponible, predijimos que las densidades de cormoranes en la acuicultura serían mayores en el presente que en las estimaciones históricas. Aplicando una metodología similar a la de los estudios históricos, usamos muestreos aéreos para colectar datos de cormoranes en dormideros nocturnos y usando los estanques de acuicultura de bagres durante tres estaciones invernales consecutivas, comenzando en 2015. Aunque el número anual promedio de cormoranes en dormideros en el Delta durante nuestro estudio fue 64% menor que el histórico, no encontramos un cambio significativo en las densidades en la acuicultura, sugiriendo que la superficie de acuicultura es probablemente el factor que influencia la presencia de cormoranes en el noroeste de Mississippi. Durante los muestreos contemporáneos también medimos la abundancia de Ardea herodias y A. alba en los conglomerados de acuicultura, y construimos modelos predictivos de abundancia con relación a las variables asociadas con forrajeo en y alrededor de los conglomerados. Encontramos que la abundancia de las tres especies estuvo fuertemente relacionada a la cantidad de superficie de acuicultura tanto al interior como alrededor del conglomerado, aunque los patrones variaron por especie. La abundancia de cormoranes fue también mayor en los conglomerados con proporcionalmente más pescado (≥20 cm de largo) que alevines (<20 cm) y estuvo positivamente relacionada a la proximidad y tamaño de los dormideros nocturnos. Las relaciones descriptas aquí pueden ser usadas por los productores y los gestores de fauna silvestre para predecir la abundancia de estas aves piscívoras en las instalaciones de acuicultura y para diseñar planes de manejo eficientes para mitigar los impactos potenciales de la depredación y de las enfermedades.
Lay Summary
• Mississippi contains ~60% of all catfish production in the U.S., and bird depredation costs producers millions of dollars annually.
• We studied how Double-crested Cormorants, Great Blue Herons, and Great Egrets use commercial catfish aquaculture in Mississippi.
• However, catfish production in Mississippi has declined by over 70% since its peak in the early 2000s, raising questions regarding bird use, particularly by cormorants.
• Does less aquaculture mean more cormorants per pond? Has the aquaculture decline affected cormorant abundance in the region, and is catfish aquaculture a driver of local bird abundance?
• To address these questions, we compared surveys of cormorants from the early 2000s with contemporary surveys.
• We found fewer cormorants in Mississippi today than in the past but cormorant density on ponds has not changed, suggesting a link to the amount of catfish ponds. Local abundance of all fish-eating birds surveyed was also related to the amount of catfish aquaculture.
INTRODUCTION
Commercial production of catfish (Ictalurus spp.) is the largest aquaculture industry in the United States, with the majority of production occurring in Mississippi (NASS 2014a). About 60% of the area of all waters devoted to the production of catfish in the U.S. is found in Mississippi (NASS 2018), and most of this production occurs within an 18,000 km2 region located in the northwestern portion of the state, known as the Mississippi Delta (hereafter, Delta; Figure 1) (NASS 2014b). The high concentration of aquaculture in the Delta provides a ready food source for piscivorous birds in the region and thus generates significant human–wildlife conflict (Glahn et al. 1999, Dorr and Taylor 2003, Dorr et al. 2008). Numerous avian species have been reported to depredate fish at aquaculture facilities (Gorenzel et al. 1994, Wywialowski 1999, Tucker and Hargreaves 2004), but Double-crested Cormorants (Phalacrocorax auritus; hereafter, cormorants) have been documented as the greatest avian predator of catfish at aquaculture facilities in the Delta.
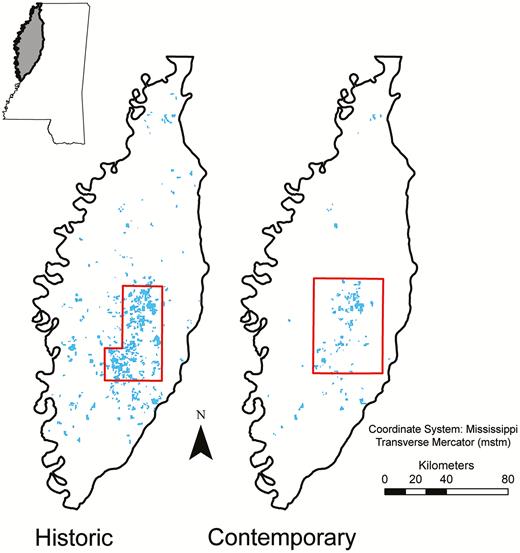
Sample frames (outlined in red) in the Mississippi Delta for aerial surveys of piscivorous birds on active catfish (Ictalurus spp.) aquaculture (blue) during historic and contemporary periods. Historic surveys of Double-crested Cormorants (Phalacrocorax auritus) were conducted by Dorr et al. (2008) during winters 2000−2001 and 2003−2004. We used the same methodology for contemporary surveys of Double-crested Cormorants, Great Blue Herons (Ardea herodias), and Great Egrets (A. alba) during the winters of 2015−2016, 2016−2017, and 2017−2018. Inset map shows the study region within the state of Mississippi.
During the early 2000s, Brian Dorr and colleagues conducted comprehensive research on the impacts of cormorants on the Delta’s catfish industry (Dorr 2006, Dorr et al. 2008, 2012a, 2012b). They found that cormorants foraging on catfish ponds during winter were a significant source of catfish depredation, costing producers an estimated loss of $12.1 and $5.6 million dollars in production in 2000 and 2003, respectively (Dorr et al. 2012a). Since then, however, the Delta’s aquaculture industry has undergone numerous changes. Most notably, the area of water devoted to catfish production has declined by over 70% (Falconer 2014, Hanson and Sites 2015), dropping from ~61,000 ha in the early 2000s to ~15,000 ha at the time of our study (2015–2018). Eliminating catfish ponds removes a significant food source for cormorants (Glahn and Brugger 1995), and it was unknown how cormorants were responding to these changes in the industry and whether the potential for human–wildlife conflict might be intensifying on the remaining ponds.
Cormorants that move through the Delta throughout the winter originate from the upper midwestern U.S. and the prairie pothole region of Canada, including much of the Great Lakes area (Dorr et al. 2020). These cormorants typically begin their fall migration in early October, following the Mississippi flyway south (King et al. 2012), and winter throughout the southeast U.S. from North Carolina to the western Gulf of Mexico (Dorr et al. 2020). Estimates of the midwestern breeding population indicate cormorant abundance has remained relatively stable over the past 2 decades, although some colonies have shown positive growth rates (Adkins et al. 2014, Chastant et al. 2014, Pardieck et al. 2019). Given a similar abundance of cormorants migrating through the Delta but fewer aquaculture hectares available, we predicted cormorant densities on aquaculture would be greater today than historically. We hypothesized that large numbers of cormorants would continue to be attracted by the plentiful volume of food, the concentration of aquaculture in clusters of ponds, and the ease of capture of catfish at aquaculture facilities. If so, the remaining catfish producers in the Delta would be experiencing greater depredation pressure at their facilities compared with past producers, resulting in a greater individual economic loss. Thus, we were interested in determining whether the reduction of aquaculture area resulted in higher densities on ponds than historically or, alternatively, caused cormorants to distribute themselves proportionally to available resources (Fretwell and Lucas 1970), perhaps seeking out other sources of forage farther south along the coast to sustain their nutritional requirements.
Another question of management interest for several reasons was how piscivorous birds select specific clusters of aquaculture ponds relative to conditions in and around the clusters. First, understanding how different species select clusters can help focus efforts in bird harassment, a management technique to frighten birds away (Conover 2000), so as to increase efficiency in time and resources spent in mitigating depredation. Second, such information can be used to estimate current or predict future economic impacts of avian depredation at aquaculture facilities. Lastly, understanding how piscivorous birds select aquaculture ponds relative to characteristics of surrounding areas can provide insights into foraging behavior and thereby facilitate management of depredation risk at the appropriate spatial scale.
The first objective of our study was to compare contemporary regional abundance of cormorants in the Delta and their densities on aquaculture ponds during winter with those recorded during the early 2000s (Dorr 2006, Dorr et al. 2008). Our second objective was to estimate the current abundance of cormorants and other large piscivorous birds on individual clusters of catfish ponds and relate their abundance to conditions in and around those clusters. Here we focus not only on cormorants but also on Great Blue Herons (Ardea herodias; hereafter, herons) and Great Egrets (A. alba; hereafter, egrets), for which little is known regarding their distribution and use of catfish aquaculture at larger scales. Herons and egrets also depredate catfish, less so than do cormorants, but more importantly they have been implicated in disease transmission on aquaculture (Wywialowski 1999, Dorr and Taylor 2003, Jubirt et al. 2015). We hypothesized that the abundance of all 3 species at an individual aquaculture cluster would be related to the amount of forage potential in and around the cluster as well as the size of fish cultured within the ponds.
METHODS
Study Area and Study Design
We designed our study to replicate that of Dorr et al. (2008), who estimated the winter abundance of cormorants using catfish ponds within an 182,000-ha sample frame that contained ~67% of the total water area in aquaculture production in the Delta at the time (Figure 1). To obtain the current extent of aquaculture coverage, we manually digitized all water area in production within the Delta in a geographic information system (ArcGIS 10.2; Environmental Systems Research Institute, Redlands, California, USA) using high-resolution (sub-meter) National Agriculture Imagery Program (NAIP) aerial imagery taken from July to October 2014, retrieved from the U.S. Department of Agriculture Geospatial Gateway (https://datagateway.nrcs.usda.gov). We then established a similar sample frame in the primary catfish-producing area, encompassing 277,000 ha and ~73% of the total aquaculture area in the Delta (Figure 1). Following Dorr et al. (2008), we used a cluster sampling design and defined a cluster of ponds as those that occurred within a given U.S. Geological Survey land survey section, which is nominally 1.61 × 1.61 km square (260 ha) and typically aligned with property boundaries; an individual pond was considered part of the cluster if at least 50% of its area lay within the section.
Dorr et al. (2008) randomly selected 20% (n = 58) of 300 available clusters in the interior Delta region, which they surveyed by air, counting all cormorants observed on all catfish ponds within each selected cluster. They completed a total of 29 surveys, with 2.1 and 2.0 surveys per month (October−April) during the winters of 2001−2002 and 2003−2004, respectively (hereafter, winters 2001 and 2003). We flew a total of 35 surveys across 3 consecutive winter seasons (October−April), beginning in 2015. Because of the reduction in aquaculture area between studies, we had fewer total clusters within our sample frame (136 vs. 300) and increased the random selection to 30% (n = 41) to be surveyed. Our goal was to survey the same clusters twice monthly each winter, but samples varied due to aquaculture facilities and ponds going in and out of production. We surveyed a total of 37, 40, and 40 clusters, respectively, during the winters of 2015−2016, 2016−2017, and 2017−2018 (hereafter, winters 2015, 2016, and 2017). Due to logistical constraints related to weather or aircraft issues, we were able to complete an average of only 1.7, 1.9, and 1.5 surveys per month during the 3 winters. Each survey began 1 hr after sunrise and was limited to ≤8 hr on a single day to ensure counts were completed during daylight hours and to avoid double-counting individual birds. As in Dorr et al. (2008), surveys were conducted in a fixed-wing aircraft at an altitude of 100–150 m above ground level. The pilot circled over each sampled cluster and a single observer counted all cormorants, herons, and egrets present on or near (i.e. on pond levees) each pond within the cluster. Flight routes were randomly selected for each survey to decrease the probability of surveying the same aquaculture cluster at similar times between surveys.
In 1989, in response to apparent increases in cormorant abundance coincident with the growth of the catfish aquaculture industry in the southeastern U.S. (Wires et al. 2001, Wires and Cuthbert 2006), the U.S. Department of Agriculture, Wildlife Services, implemented a large-scale monitoring program to estimate the abundance of cormorants at all known night roosts across the entire Delta region. These aerial roost surveys provided measures of regional abundance of cormorants, which Dorr et al. (2008) found highly correlated with their counts of cormorants using catfish ponds. The night-roost surveys were discontinued after 2010, so we replicated them during our study to estimate the current size of the regional wintering population and to compare relationships with current use of catfish ponds. We acquired all known roost locations within the entire Delta region directly from Wildlife Services. As soon as logistically possible after each survey of aquaculture clusters, we surveyed all known roosts from a fixed-wing aircraft at an altitude of 100–150 m above ground, and an observer recorded all cormorants present at the roost. We surveyed about half of the roosts within 4 hr after sunrise and half within 4 hr before sunset (Glahn et al. 1996) because cormorants tend to remain at night roosts during the early morning and late evening hours (Aderman and Hill 1995, Dorr et al. 2020). We completed each survey within a single 24-hr period to avoid double-counting.
Also following Dorr et al. (2008), we used counts derived from photographs to correct for error associated with observer counts at both aquaculture ponds and night-roost sites. To ensure a representative range of count values, we systematically chose a subset of ponds and roosts to photograph digitally during the aerial surveys. We computed a mean ratio of photographic counts to paired observer counts for aquaculture ponds and for roost sites by species and observer, then adjusted each observer count by its applicable mean ratio for subsequent analysis. In each instance observers underestimated bird abundance. The overall mean ratio of photographic to observer counts on aquaculture ponds was 1.11 for cormorants (n = 136), 1.52 for herons (n = 39), and 1.08 for egrets (n = 74). The mean ratio for cormorants at roost sites was 1.29 (n = 72).
Statistical Analysis
Historic vs. contemporary cormorant abundance and densities on aquaculture.
We used Welch’s t-tests (Whitlock and Schluter 2009) to compare total night-roost counts of cormorants, mean area (ha) of aquaculture within clusters, and mean pond size (ha) between historic and contemporary time periods. We used an alpha value of 0.05 to determine significance. These tests provide measures of differences in size of the overall cormorant population wintering in the Delta and changes in aquaculture practices.
We then modeled cormorant density on aquaculture (i.e. the number of cormorants within a cluster per hectare of aquaculture within that cluster) as a function of time period (contemporary vs. historic) and other temporal variables. We used the lme4 package (Bates et al. 2015) in R 3.5.1 (R Core Team 2018) to fit generalized linear mixed models of the count data with a negative binomial distribution and included the cluster’s area of aquaculture (ha) in the model using the offset option to test the effects of independent variables on cormorant densities (Zuur et al. 2009). Because multiple data points were recorded for each cluster, we included cluster as a random effect in the model. We included time period (historic vs. contemporary) as a fixed effect to test our hypothesis that cormorant densities differed between periods. We also included month and an interaction term of time period * month as fixed effects to account for potential temporal differences between studies. We checked for overdispersion of the data by fitting a standard negative binomial regression model and calculating a dispersion parameter (Φ) equal to the ratio of residual deviance to the degrees of freedom (Zuur et al. 2009); all models had an acceptable Φ of ~1. We then validated the full model by examining deviance residuals plotted against the predicted response values to ensure that patterns indicated no violations of model assumptions (Zuur et al. 2009). We used the R package effects (Fox and Hong 2009) to estimate mean cormorant density plus 95% confidence intervals (CIs) and to plot the modeled effect of each independent variable on cormorant density while holding all other independent variables at their mean values.
Contemporary use of aquaculture clusters by piscivorous birds.
Using contemporary data, we modeled the counts of cormorants, herons, and egrets separately using generalized linear mixed models with a negative binomial distribution with the lme4 package as above. Here, our objective was to determine factors influencing avian abundance within individual clusters of ponds; therefore, our response variable was avian count per cluster. Again, we modeled cluster as a random effect to account for repeated measurements from each cluster. We modeled species count against hectares of aquaculture within the cluster, predicting that more aquaculture area would result in greater abundance, given increased foraging potential. We also included month and year as categorical variables to allow for variation in seasonal abundance related to migration and general variation in abundance among years.
We constructed a single metric to describe the makeup of each cluster in terms of fish types cultured. In Mississippi, ~81% of aquaculture acreage is devoted to food fish, ~16% to fingerlings, and ~3% to broodfish (USDA 2010a). Fingerlings are young catfish typically 3–20 cm in length, food fish are marketable size fish typically >20 cm, and broodfish are mature adults used for reproduction. Past studies examining individual pond use revealed that cormorants and herons are more likely to occur on fingerling ponds (Glahn et al. 2002, Dorr 2006), most likely because fingerlings are smaller in size and thus easier to capture, handle, and consume. At the end of each winter we contacted producers to obtain information on fish type for every pond surveyed. We calculated the proportion of each fish type within a cluster based on water surface area, then subtracted the proportion of fingerlings from the proportion of food fish. The resulting metric could range from −1 to +1, with positive values indicating a dominance of food fish and negative values indicating a dominance of fingerlings. For example, a cluster with proportions of 0.70 food fish, 0.10 fingerlings, and 0.20 broodfish would have a value of 0.60. We excluded clusters that were predominantly broodfish (>0.50 broodfish) from the analysis because cormorants, herons, and egrets find the larger fish more difficult or impossible to capture and consume (Glahn et al. 1995, 2000a). Of the 117 clusters surveyed over the 3 winter seasons, 15 were predominantly broodfish and removed from the analysis.
We also explored whether abundance of a species was influenced by the amount of alternative foraging habitat around the clusters within 2 different buffers. A radius of 4 km was based on the mean distance traveled by cormorants from forage site to forage site or from forage site to daily loafing areas; a radius of 14 km was based on the mean distance traveled between forage site and night-roost locations (King et al. 1995). These buffers were chosen based on behavior of cormorants because this species is of greatest management concern for aquaculture producers in the region (Glahn and Dorr 2002, Tucker and Hargreaves 2004, Werner et al. 2005). Within each buffer we calculated hectares of both aquaculture and naturally occurring waterbodies by manually digitizing the water area of each from NAIP imagery as described above. We predicted that both the aquaculture area and natural waterbody area available within the buffer would have a positive influence on abundance at the cluster itself because of overall increased foraging potential.
For the cormorant model we also constructed a roost variable (RST-VAR) to describe the number of cormorants available to forage at each aquaculture cluster, which can depend on their abundance at multiple active roosting sites as well as distance of the roost sites from the aquaculture facilities (Dorr et al. 2012b). Tobin et al. (2002) used radio-marked birds to estimate the cumulative percentage of cormorants that traveled different distances between roosts and foraging locations (in 10-km increments out to 100 km). For example, 79% traveled ≥10 km from their roosts, 58% traveled ≥20 km, and decreasing percentages traveled farther (22%, 12%, 7%, 5%, 4%, 2%, and 1% beyond 30, 40, 50, 60, 70, 80, and 90 km, respectively). Aquaculture clusters within 10 km of a roost site were presumed to be available to 100% of the cormorants roosting there. For each aquaculture cluster we used ArcGIS to identify the 10-km distance band for each roost site within 100 km. For each survey, we multiplied the number of cormorants recorded at the roost site by the pertinent cumulative percentage above to estimate the number that would likely travel to a given aquaculture cluster to forage. We then calculated RST-VAR for each cluster during a given survey as the sum of the number of cormorants likely to travel to the cluster from all roost sites within 100 km.
We constructed 3 models for each avian species to test the spatial scale that best explained abundance per cluster, and considered the model with the smallest value of Akaike’s Information Criterion (AIC) to have the most support (Burnham and Anderson 2002). The first model included cluster as a random effect, and month, year, amount of aquaculture area within the cluster, and the fish-type metric as fixed effects (plus RST-VAR for cormorants only). This model represented the cluster itself while ignoring surrounding foraging habitat. The second model included the same variables as the first, with the area of natural waterbodies and area of aquaculture within a 4-km buffer of the cluster as 2 additional covariates. Lastly, the third model was the same as the second except it included the areas of natural waterbodies and aquaculture within a 14-km instead of a 4-km buffer.
All continuous variables were standardized prior to modeling to aid in model convergence and parameter estimation (Schielzeth 2010). We checked for collinearity among predictor variables using variance inflation factors (VIFs) calculated from the full model. We used the cut-off of VIF >5 to determine if a variable should be removed due to collinearity (Zuur et al. 2009). If a variable had a VIF >5, we removed the variable with the largest VIF and tested collinearity again, repeating until all VIFs were <5. We validated and interpreted models as described in the previous section. We exponentiated beta coefficients of forage-related variables that were significant in each species’ model to estimate the rate of change the variable had on abundance given a specified increase in the variable of interest. We back-transformed this rate to represent the variable’s original, unstandardized scale, and present the results as percent change in abundance. We also present the expected change in abundance between the minimum and maximum values observed for each explanatory variable because the magnitude of each varied considerably. For example, aquaculture within a cluster ranged from 4 to 212 ha, whereas aquaculture within the 14-km buffer ranged from 491 to 6,918 ha. Finally, we used the R package survey (Lumley 2004) to estimate mean counts of cormorants, herons, and egrets per cluster for all 3 years combined, along with their variance estimates, based on a Taylor series linearization (Dorr et al. 2008).
RESULTS
Historic vs. Contemporary Cormorant Abundance and Densities on Aquaculture
The number of surveyed night roosts throughout the entire Delta region of Mississippi during winter were similar between the historic (79 in 2000; 81 in 2003) and contemporary (79 in 2015; 85 in 2016; 80 in 2017) periods. The abundance of cormorants, as measured by the number of cormorants occupying night roosts, was significantly higher historically than during our contemporary study (t = −4.4, df = 24.6, P < 0.001). Mean historic counts (33,783 ± 23,170 standard deviation [SD], n = 23) were almost triple what we recorded (12,137 ± 6,964 SD, n = 35) using the same survey methodology. Although the total area of water devoted to catfish production declined by over 70% between studies (Falconer 2014, Hanson and Sites 2015), the mean area per cluster of aquaculture ponds did not differ (t = 0.4, df = 230.4, P = 0.70) between historic (81.3 ± 50.6 ha SD) and contemporary (83.9 ± 53.7 ha SD) periods. Average pond size, however, is slightly smaller today (3.9 ± 1.3 ha SD) than during the early 2000s (4.3 ± 0.9 ha SD) (t = −3.0, df = 213.1, P = 0.002). Thus, the decline in aquaculture was due primarily to a reduction in the number of aquaculture clusters in the region.
Despite the decrease in overall abundance of cormorants in the Delta region, the average density of cormorants on the remaining aquaculture clusters was similar (P = 0.08) between historic (0.13 birds ha−1; 95% CI: 0.11−0.17) and contemporary (0.14 birds ha−1; 95% CI: 0.11−0.17) periods. Densities varied considerably by month during both periods (Figure 2), and the inclusion of an interaction term of period × month significantly improved the model (χ 2 = 14.2, df = 6, P = 0.03). During both periods, densities were lowest from October through December, increased through March, and decreased in April; however, contemporary densities were significantly lower than historic densities during both January (P = 0.001) and February (P = 0.03) (Table 1).
Parameter estimates for the best temporal model of Double-crested Cormorant (Phalacrocorax auritus) densities on catfish (Ictalurus spp.) aquaculture clusters in the Mississippi Delta during winter (October−April). Aerial surveys were conducted generally twice monthly for 2 winters in the historic period (early 2000s; Dorr et al. 2008) and 3 winters in our contemporary study. Beta (β) estimates, standard errors (SE), and associated P-values are shown.
| Parameter | β | SE | P |
|---|---|---|---|
| Intercept | –2.596 | ||
| November | –0.082 | 0.248 | 0.74 |
| December | –0.224 | 0.239 | 0.35 |
| January | –0.033 | 0.296 | 0.91 |
| February | 1.472 | 0.249 | <0.001 |
| March | 2.131 | 0.233 | <0.001 |
| April | 1.016 | 0.255 | <0.001 |
| Time period (historic) a | –0.459 | 0.264 | 0.08 |
| November: historic b | 0.273 | 0.329 | 0.41 |
| December: historic b | 0.534 | 0.328 | 0.10 |
| January: historic b | 1.169 | 0.370 | 0.001 |
| February: historic b | 0.704 | 0.331 | 0.03 |
| March: historic b | 0.068 | 0.314 | 0.83 |
| April: historic b | 0.394 | 0.334 | 0.24 |
aCategorical time period includes historic (2000−2001 and 2003−2004) and contemporary (2015−2016, 2016−2017, and 2017−2018) periods, with contemporary period set as the reference level.
b Interaction between month and time period.
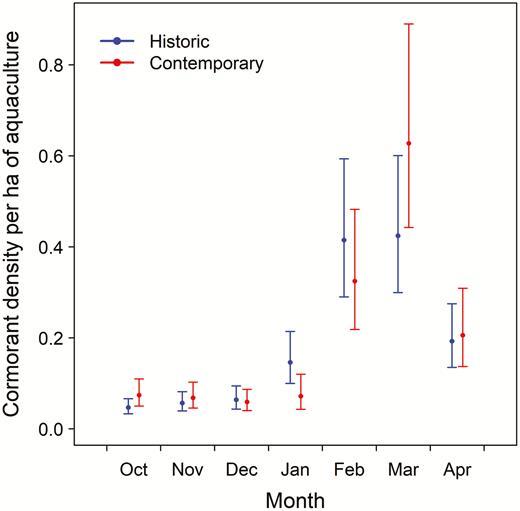
Mean monthly winter densities (±95% CI) of Double-crested Cormorants (Phalacrocorax auritus) on catfish (Ictalurus spp.) aquaculture in the Mississippi Delta estimated from historic (2001−2002 and 2003−2004) and contemporary (2015−2016, 2016−2017, and 2017−2018) aerial surveys.
Use of Aquaculture Clusters by Piscivorous Birds
Contemporary abundance of all 3 species of piscivorous birds on aquaculture clusters was best explained by combinations of temporal variables, characteristics of the clusters themselves, and features of the surrounding areas. The top model based on AIC included alternative foraging habitat within a 14-km buffer around clusters for cormorants and egrets, and habitat within a 4-km buffer for herons (Table 2). Numbers of both cormorants and egrets increased with the amount of aquaculture area within the 14-km buffer but herons showed the opposite pattern relative to the 4-km buffer (Table 3). For each additional 100 ha of aquaculture present within the species-specific buffer around an aquaculture cluster, the average abundance was predicted to increase by 1% for cormorants, increase by 2% for egrets, and decrease by 7% for herons (Figure 3). Average abundance within a given cluster was predicted to increase by 2.6 times for cormorants and by 3.5 times for egrets as the area of aquaculture within the 14-km buffer increased from 491 to 6,918 ha for the actual range of values observed. By contrast, the average abundance of herons within a given cluster was predicted to decrease by 7.6 times as the area of aquaculture within the surrounding 4-km buffer increased from the observed minimum (112 ha) to maximum (2,925 ha) values. The area of natural waters within the buffer was not a significant predictor of abundance for any species.
List of candidate models examined for contemporary winter abundance of Double-crested Cormorants (Phalacrocorax auritus), Great Blue Herons (Ardea herodias), and Great Egrets (A. alba) at catfish (Ictalurus spp.) aquaculture clusters in the Mississippi Delta relative to foraging habitat available at 3 spatial extents. Abundance was modeled for each species as a function of temporal variables plus characteristics within the cluster alone (Cluster) or also including the surface area (ha) of aquaculture and naturally occurring waterbodies within a 4-km or 14-km buffer surrounding the cluster. Counts were recorded during aerial surveys generally twice monthly (October−April) for 3 winters (2015−2016, 2016−2017, and 2017−2018). For each model within a candidate set we report the difference in Akaike’s Information Criterion (ΔAIC) from that of the most parsimonious model, the number of parameters (k), and the Akaike weight (wi). Table 3 lists parameters for top models.
| Model | ΔAIC | k | wi |
|---|---|---|---|
| Cormorant | |||
| Cluster + 14-km buffer | 0.0 a | 16 | 0.974 |
| Cluster + 4-km buffer | 7.3 | 16 | 0.026 |
| Cluster | 21.5 | 13 | 0 |
| Null | 861.3 | 3 | 0 |
| Heron | |||
| Cluster + 4-km buffer | 0.0 b | 15 | 0.992 |
| Cluster + 14-km buffer | 9.7 | 15 | 0.008 |
| Cluster | 17.2 | 13 | 0 |
| Null | 204.4 | 3 | 0 |
| Egret | |||
| Cluster + 14-km buffer | 0.0 c | 15 | 0.948 |
| Cluster | 6.2 | 13 | 0.042 |
| Cluster + 4-km buffer | 9.2 | 15 | 0.010 |
| Null | 135.8 | 3 | 0 |
a AIC = 8,053.3.
b AIC = 5,604.0.
c AIC = 6,203.8.
Parameter estimates for the top models of contemporary winter abundance of Double-crested Cormorants (Phalacrocorax auritus), Great Blue Herons (Ardea herodias), and Great Egrets (A. alba) at catfish (Ictalurus spp.) aquaculture clusters in the Mississippi Delta. Abundance was modeled for each species as a function of temporal variables, characteristics within the cluster, and the surface area (ha) of aquaculture and naturally occurring waterbodies within a 4-km or 14-km buffer surrounding the cluster. Counts were recorded during aerial surveys generally twice monthly (October−April) for 3 winters (2015−2016, 2016−2017, and 2017−2018). The month of October and winter 2015−2016 (year 2015) were set as reference levels. Beta (β) estimates, standard errors (SE), and associated P-values are shown.
| Cormorant | Heron | Egret | |||||||
|---|---|---|---|---|---|---|---|---|---|
| Parameter | β | SE | P | β | SE | P | β | SE | P |
| Intercept | 1.66 | 1.25 | 2.81 | ||||||
| November | 0.01 | 0.13 | 0.93 | 0.76 | 0.25 | 0.002 | –0.60 | 0.27 | 0.03 |
| December | –0.33 | 0.13 | 0.01 | 0.35 | 0.25 | 0.17 | –0.73 | 0.27 | 0.007 |
| January | –0.42 | 0.14 | 0.003 | 1.31 | 0.27 | <0.001 | –0.53 | 0.29 | 0.07 |
| February | 1.30 | 0.13 | <0.001 | –0.51 | 0.29 | 0.08 | –1.92 | 0.31 | <0.001 |
| March | 1.98 | 0.13 | <0.001 | –2.05 | 0.27 | <0.001 | –2.60 | 0.28 | <0.001 |
| April | 1.18 | 0.13 | <0.001 | –1.50 | 0.31 | <0.001 | –2.34 | 0.32 | <0.001 |
| Year (2016) | –0.04 | 0.27 | 0.87 | 0.10 | 0.24 | 0.67 | 0.13 | 0.32 | 0.68 |
| Year (2017) | –0.60 | 0.27 | 0.03 | 0.45 | 0.26 | 0.08 | 0.05 | 0.33 | 0.88 |
| Fish type a | 0.30 | 0.15 | 0.046 | –0.02 | 0.13 | 0.82 | –0.25 | 0.18 | 0.16 |
| Aq in buffer b | 0.29 | 0.10 | 0.008 | –0.50 | 0.10 | <0.001 | 0.38 | 0.13 | 0.003 |
| Nat in buffer c | –0.19 | 0.11 | 0.08 | –0.09 | 0.10 | 0.33 | 0.21 | 0.13 | 0.11 |
| Aq hectare d | 0.47 | 0.11 | <0.001 | 0.59 | 0.10 | <0.001 | 0.40 | 0.13 | 0.002 |
| RST-VAR e | 0.18 | 0.04 | <0.001 | ||||||
a Fish-type index (−1 to +1) represents proportion of surface area within the aquaculture cluster for raising food fish (≥20 cm) minus the area for fingerlings (<20 cm).
b Surface area of aquaculture within 4-km (herons) or 14-km (cormorants and egrets) buffer around aquaculture clusters based on top models (see Table 2).
c Surface area of naturally occurring waterbodies within 4-km (herons) or 14-km (cormorants and egrets) buffer around aquaculture clusters based on top models (see Table 2).
d Surface area (ha) of aquaculture within cluster.
e Index of the number of cormorants from surrounding roost sites likely to forage at each aquaculture cluster (see Methods).
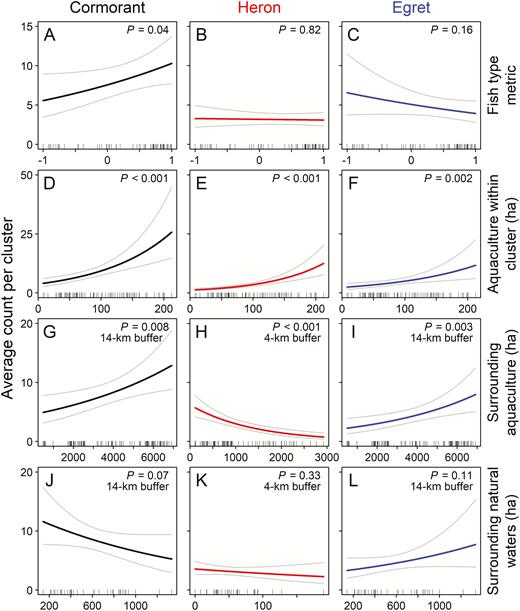
Predicted response (number of birds per aquaculture cluster) of Double-crested Cormorants (Phalacrocorax auritus), Great Blue Herons (Ardea herodias), and Great Egrets (A. alba) relative to fish type and amount of foraging area at different spatial scales during winter surveys of catfish (Ictalurus spp.) aquaculture clusters in the Mississippi Delta. (A−C) The fish-type metric is the proportion of surface area within the aquaculture cluster for raising food fish (≥20 cm) minus the area for fingerlings (<20 cm). The 3 foraging-area metrics include (D−F) surface area of aquaculture (ha) within the cluster itself, (G−I) area of aquaculture (ha) within a 4-km (herons) or 14-km (cormorants and egrets) buffer surrounding the cluster, and (J−L) area of natural waterbodies (ha) within the surrounding buffer. Predictions are based on the final model for each species with all other covariates held at mean values. Thin lines represent 95% confidence intervals. Ticks at the bottom of each graph show values of the dependent variables observed in the data. Count data were collected during aerial surveys flown from October through April in the winters of 2015–2016, 2016−2017, and 2017−2018.
The area of aquaculture within the cluster itself also had a significant positive influence on the average abundance of all 3 species, increasing by 9% for cormorants, 12% for herons, and 8% for egrets with each additional 10 ha of aquaculture within the cluster itself (Figure 3). Average abundance was predicted to increase by 6.5 times for cormorants, 10.4 times for herons, and 4.9 times for egrets from the cluster encompassing the least (4 ha) to greatest (212 ha) observed amount of aquaculture area. The fish-type metric was not a significant predictor of abundance on aquaculture clusters for either herons or egrets, but did have a positive influence on cormorant abundance (Table 3). Cormorant abundance within a cluster made up entirely of food fish was on average 36% greater than clusters containing equal proportions of food fish and fingerlings (Figure 3).
The abundance of cormorants recorded on aquaculture clusters was also positively related to the availability of cormorants to visit from roost sites in surrounding areas, as measured by the RST-VAR metric. An increase of 1,000 in this metric increases the expected count of cormorants by 13% for a given cluster. Because the rate of change of the RST-VAR metric is sensitive to the distance from cluster to roost, changes to abundance at roosts nearer a cluster have a much greater impact compared with roosts farther away. For example, to observe an increase of 1,000 in the RST-VAR metric, an additional 1,266 cormorants would be needed at roosts 10−20 km from the cluster, whereas 20,000 would be needed at roosts 60−70 km, or 100,000 at roosts >90 km away.
The average numbers of herons and egrets on aquaculture clusters did not differ significantly among years, but average abundance of cormorants was lower in 2017 than in the other 2 years (Table 3, Figure 4). All 3 species showed significant but differing patterns of monthly variation in abundance. Average count of cormorants was lowest from October through January, increased through March, and decreased through April. Conversely, abundance of both herons and egrets was greatest at the beginning of the winter season and decreased in February through April (Figure 4). The mean count per aquaculture cluster over all 3 years was greatest for cormorants (22; 95% CI: 16–28), followed by egrets (14; 95% CI: 9–20) and herons (8; 95% CI: 6–10).
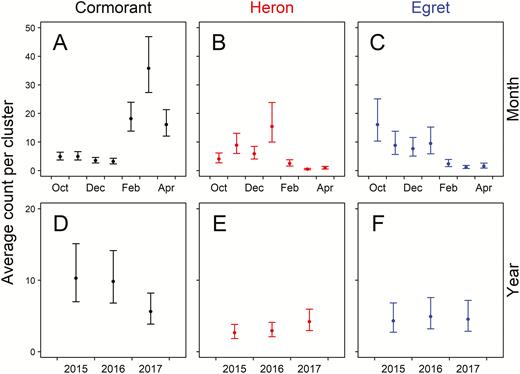
Predicted response (number of birds per aquaculture cluster) of Double-crested Cormorants (Phalacrocorax auritus), Great Blue Herons (Ardea herodias), and Great Egrets (A. alba) relative to (A−C) month and (D−F) year during winter surveys of catfish (Ictalurus spp.) aquaculture clusters in the Mississippi Delta. Predictions (±95% CI) are based on the final model for each species with all other covariates held at mean values. Count data were collected during aerial surveys flown from October through April in the winters of 2015–2016, 2016−2017, and 2017−2018.
DISCUSSION
Contrary to our prediction, contemporary cormorant densities on catfish aquaculture in the Delta region of Mississippi were not greater than those estimated when production was at its maximum in the early 2000s. Rather, we found densities to be consistent between time periods, and even most of the monthly estimates were similar, suggesting that seasonal patterns and levels of depredation pressure have not changed. Despite an apparently stable source breeding population (Adkins et al. 2014, Chastant et al. 2014, Pardieck et al. 2019), our contemporary surveys of night-roost sites revealed a 64% decline in the population wintering in the Delta region since the early 2000s. Together, these findings suggest that the total hectares of aquaculture production, which had decreased by >70% during the same period (Falconer 2014, Hanson and Sites 2015), is the primary factor influencing the abundance of cormorants wintering within the Delta. Given the reduction of forage potential (i.e. catfish ponds) in the Delta, the large, migratory population of cormorants may be distributing themselves to other regions farther south, as would be predicted by the ideal free distribution theory framework (Fretwell and Lucas 1970). In fact, some of the earliest accounts of cormorants in Mississippi suggest cormorants spent little time wintering inland, but rather traveled closer to the coast (Lewis 1929), indicating potential responsiveness to changing food resources.
Interestingly, the average hectares of aquaculture per cluster have not changed in the last 20 yr. Physical pond size, however, has significantly decreased, most likely due to the development of more effective production techniques. For example, split-ponds, intensively stocked ponds, and hybrid catfish production are relatively new practices in use today, and each typically requires smaller areas (Tucker and Kingsbury 2010, USDA 2010b, Kumar et al. 2016). Despite these changes in aquaculture practices and pond size, cormorant densities remained similar between periods.
We found that the number and distribution of cormorant night-roost sites surrounding an aquaculture cluster also influenced the numbers of cormorants that occupied the cluster, which suggests that management of roost sites might be helpful for mitigating depredation. Roost harassment is one of the most effective ways of reducing cormorant impacts to aquaculture (Reinhold and Sloan 1997, Mott et al. 1998, Glahn et al. 2000b). This technique typically involves using pyrotechnics, or other frightening devices and tactics, to push cormorants out of roosts and away from areas of aquaculture, but its effectiveness can be limited if the population of cormorants is increasing or there is a large number of roost sites, as was true during the early 2000s (Dorr et al. 2012a). Because the aquaculture industry is much more concentrated today and regional cormorant abundance is lower while the number of active roosts is similar, roost harassment may now be more effective compared with past efforts.
Our models of contemporary abundance suggest that, in addition to roost sites, other characteristics of habitat surrounding an aquaculture cluster as well as features of the ponds themselves may be important for management of depredation risk by piscivorous birds. The amount of aquaculture area within the cluster had the greatest impact on the abundance of cormorants, herons, and egrets, likely due to the simple fact that a greater surface area of water has a greater capacity to support foraging individuals. Cormorants were also more abundant on aquaculture clusters that produced more food fish than fingerlings, supporting Dorr et al.’s (2012b) findings of the species’ selection for food fish when looking at use vs. availability by surface area at regional scales. By contrast, we found no evidence that fish type affected the abundance of either herons or egrets. This finding agrees with observations by Glahn et al. (1999) that 41% of catfish consumed by herons were from fingerling ponds and the remainder from food fish, indicating approximately equal preference. For egrets, however, most catfish consumed are typically of fingerling size, but they make up a small portion of the total diet (Werner et al. 2001). In addition, the majority of catfish consumed by both egrets and herons are typically sick or dying (Glahn et al. 2002, Dorr and Taylor 2003), and disease outbreaks are less common over the winter months (Tucker and Hargreaves 2004).
Abundance of all 3 species was also related to the availability of alternative foraging habitat in buffers surrounding a given aquaculture cluster, confirming the importance of considering resource availability at multiple spatial scales when examining patterns of use (Johnson 1980, Mayor et al. 2009). For cormorants and egrets, rather intuitively, the more aquaculture area there was within the 14-km buffer, the greater their abundance within a given aquaculture cluster, although this factor was less important than the area of aquaculture within the cluster itself. Total surrounding aquaculture area is likely a proximate cue perceived by these species, with more aquaculture area in the surroundings viewed as favorable due to greater foraging potential. By contrast, however, heron abundance declined with increases in aquaculture area within the surrounding 4-km buffer, although again this effect was less important than aquaculture within the cluster itself. Herons tend to forage in more sporadic and smaller groups, whereas cormorants and egrets typically forage in larger congregations (Erwin 1983, Glahn et al. 1999, Dorr et al. 2008, McCrimmon et al. 2020). For example, Glahn et al. (2002) examined heron depredation on aquaculture ponds in the Delta and found an overall average of only 1–2 herons foraging per pond. A general aversion to foraging in large groups may cause herons to spread out more if there is available aquaculture around a cluster but become more concentrated if there is less opportunity to do so. Regardless of species, the amount of naturally occurring water within the cluster’s buffer was not a significant predictor of abundance, reinforcing the importance of aquaculture ponds as foraging habitat.
Abundance on aquaculture clusters was consistent for both herons and egrets among the 3 years of this study, which is not surprising given that both species have year-round resident populations in the area (McCrimmon et al. 2020, Vennesland and Butler 2020). Cormorants are migratory, however, and their regional abundance during winter may be more dependent on local weather conditions such as temperature or rainfall. During our study, the lower mean abundance in 2017 compared with either 2015 or 2016 may have been related to the colder temperatures experienced in 2017. In fact, numerous catfish ponds had become completely frozen between the 2 January surveys of the 2017 winter season. This freeze event likely drove cormorants farther south toward the Gulf of Mexico, where high densities of wintering cormorants have also been reported (Dorr et al. 2020).
Our research findings can be used to guide management of these 3 piscivorous species, particularly cormorants, to reduce human–wildlife conflicts. The large-scale reduction in area devoted to catfish aquaculture in the Delta region that has occurred since the early 2000s has not resulted in a higher density of cormorants on the remaining ponds. Given that the source breeding population seems to have remained stable during that period, it is likely that there has instead been a shift in wintering distribution away from the Delta region. Although aquaculture facilities are supporting similar cormorant densities as in the past, management techniques such as roost harassment may now prove more effective. Specifically, we recommend that harassment techniques be focused on night roosts that support higher numbers of cormorants and that are closer to aquaculture facilities, particularly later in the winter when cormorants are more abundant. We also provide abundance estimates of the 3 most common avian predators of catfish on aquaculture clusters. Key characteristics of aquaculture within a specified cluster as well as in pertinent buffers surrounding it can be used to predict the seasonal abundance of the 3 piscivorous species examined in this study. Such estimates can inform contemporary economic analysis regarding the potential impacts of depredation and disease on commercial catfish production.
ACKNOWLEDGMENTS
We thank R. Middleton with the U.S. Department of Agriculture, Wildlife Services’ National Wildlife Research Center, D. Lunsford with the U.S. Department of Agriculture, Wildlife Services, and T. Christie with Mississippi State University, for assistance with data collection and management. We thank the talented pilots Sarah Clark, Phillip Kranser, and the late Jim Risher for their involvement in aerial surveys. We also thank the Mississippi catfish producers who were part of this research for their cooperation during our surveys. The findings and conclusions in this publication are those of the author(s) and should not be construed to represent any official USDA or U.S. Government determination or policy.
Funding statement: This research was funded by the United States Department of Agriculture, Animal and Plant Health Inspection Service, Wildlife Services, National Wildlife Research Center, Cooperative Service Agreements: 14-7428-1045(CA), 15-7428-1141(CA), 16–7428-1247(CA), 17-7428-1247(CA), and 18-7428-1247(CA).
Ethics statement: This research was approved under U.S. Department of Agriculture, Wildlife Services, National Wildlife Research Center Quality Assurance protocol, QA-2322, including Institutional Animal Care and Use and attending vet approvals.
Author contributions: B.S.D., B.K.S., and J.L.A. conceived the study idea; P.C.B., B.S.D., B.K.S., J.L.A., and G.M.S. developed the experimental design, and B.K.S. and B.S.D. supervised the research; B.S.D. and P.C.B. developed field methods for data collection, and P.C.B. and B.S.D. collected all contemporary and historical data, respectively; P.C.B. and G.M.S. analyzed the data; and P.C.B. and B.S.D. wrote the manuscript and all authors provided edits resulting in the final draft; B.S.D. and B.K.S. contributed substantial resources toward this research.
Data depository: Analyses reported in this article can be reproduced using the data provided by Burr et al. (2020).
