


Abstract
Wildlife managers have recently suggested the use of unmanned aircraft systems or drones as nonlethal hazing tools to deter birds from areas of human-wildlife conflict. However, it remains unclear if birds perceive common drone platforms as threatening. Based on field studies assessing behavioral and physiological responses, it is generally assumed that birds perceive less risk from drones than from predators. However, studies controlling for multiple confounding effects have not been conducted. Our goal was to establish the degree to which the perception of risk by birds would vary between common drone platforms relative to a predator model when flown at different approach types. We evaluated the behavioral responses of individual Red-winged Blackbirds (Agelaius phoeniceus) to 3 drone platforms: a predator model, a fixed-wing resembling an airplane, and a multirotor, approaching either head-on or overhead. Blackbirds became alert earlier (by 13.7 s), alarm-called more frequently (by a factor of 12), returned to forage later (by a factor of 4.7), and increased vigilance (by a factor of 1.3) in response to the predator model compared with the multirotor. Blackbirds also perceived the fixed-wing as riskier than the multirotor, but less risky than the predator model. Overhead approaches mostly failed to elicit flight in blackbirds across all platform types, and no blackbirds took flight in response to the multirotor at either overhead or head-on approaches. Our findings demonstrate that birds perceived drones with predatory characteristics as riskier than common drone models (i.e. fixed-wing and multirotor platforms). We recommend that drones be modified with additional stimuli to increase perceived risk when used as frightening devices, but avoided if used for wildlife monitoring.
Resumen
Los gestores de vida silvestre han sugerido recientemente el uso de sistemas aéreos no tripulados o drones como herramientas no letales de atosigamiento para disuadir a las aves de áreas de conflicto entre humanos y vida silvestre. Sin embargo, aún no está claro si las aves perciben a los drones comunes como una amenaza. Tomando como base los estudios de campo que evalúan las respuestas comportamentales y fisiológicas, por lo general se asume que las aves perciben un riesgo menor de parte de los drones que de los depredadores. Sin embargo, no se han realizado estudios que controlen los múltiples efectos contrapuestos. Nuestro objetivo fue establecer la variación en el grado de percepción de riesgo de las aves frente a drones comunes y a un modelo de depredador, considerando diferentes tipos de acercamiento de vuelo. Evaluamos las respuestas de comportamiento de individuos de Agelaius phoeniceus frente a tres tipos de drones: un modelo depredador, un modelo de ala rígida parecido a un avión y un modelo multi-rotor, todos acercándose ya sea de frente o por encima. Los individuos de A. phoeniceus se alertaron antes (por 13.7 s), realizaron llamados de alarma más frecuentemente (por un factor de 12), regresaron a forrajear más tarde (por un factor de 4.7) y aumentaron la vigilancia (por un factor de 1.3) en respuesta al modelo de depredador comparado con el multi-rotor. A. phoeniceus también percibió el modelo de ala fija como más riesgoso que el multi-rotor, pero menos riesgoso que el depredador. La mayoría de los acercamientos por encima, considerando todos los tipos de drones, no provocaron el vuelo de A. phoeniceus, y ningún individuo de A. phoeniceus voló en respuesta al multi-rotor, ya sea en los acercamientos de frente o por encima. Nuestros resultados demuestran que las aves perciben a los drones con características de depredador como más riesgosos que los modelos de drone comunes (i.e. de ala fija o multi-rotor). Recomendamos que los drones sean modificados con estímulos adicionales para aumentar el riesgo percibido cuando se los usa como dispositivos de intimidación, pero evitar modificarlos si se los usa para monitoreo de fauna silvestre.
INTRODUCTION
Recently, unmanned aircraft systems, or drones, have been suggested as a nonlethal method to deter birds from areas of human-wildlife conflict (e.g., airports, vineyards, and crop fields; Grimm et al. 2012, Ampatzidis et al. 2015, Klug 2017). If effective, drones could be incorporated into integrated pest management plans to reduce economic loss and safety hazards caused by birds and decrease bird mortality. A drone is unique in that it can overcome mobility limitations faced by other deterrent strategies (e.g., propane cannons and scarecrows; Linz 2011, Avery and Werner 2017), and future technology may include on-board bird-detection systems, extended battery longevity, and fully autonomous flight capabilities (Ampatzidis et al. 2015). Still, limitations to the efficacy and implementation of a drone as a deterrence mechanism exist (Klug 2017).
Several studies have evaluated drone disturbance to birds (Rümmler et al. 2016, Barnas et al. 2018), but few have operated drones in a manner to intentionally motivate escape behavior (Vas et al. 2015, McEvoy et al. 2016, Weimerskirch et al. 2018, Wandrie et al. 2019). Previous research has shown that a multirotor drone can approach flocks of Mallard (Anas platyrhynchos), Greater Flamingo (Phoenicopterus roseus), and Common Greenshank (Tringa nebularia) to within 4 m without provoking an escape response (Vas et al. 2015). A similar study revealed that birds (e.g., albatross [Diomedeidae]) will actively approach a drone to within 5 m (McClelland et al. 2016). These close encounters suggest that in some scenarios, birds may tolerate drone disturbance rather than avoid it.
Wildlife managers have deployed multirotors to harass birds, but reports of efficacy are so far anecdotal (Lilleboe 2015, Curtis et al. 2016), or drones were not operated in a manner to maximize disturbance (Wandrie et al. 2019). However, Wang et al. (2019) successfully deterred bird flocks from small vineyards, using a multirotor drone that carried a suspended prey effigy and a speaker that broadcasted distress calls. Despite these experiments, it still remains unclear what specific features (e.g., shape, contrast, size, speed, or flight maneuvers) increase risk perceived by birds, and how responses to these features differ across taxa and species (Mulero-Pázmány et al. 2017, Weimerskirch et al. 2018).
Birds are capable of assessing threat levels of multiple aerial predators based on visual cues (Walters 1990, McEvoy et al. 2016), and if identified, these visual cues could be applied to a drone designed for deterrence. For example, by approaching groups of waterfowl with various drone platforms, McEvoy et al. (2016) found that birds seemed most disturbed by the fixed-wing platform that closely resembled the shape of an aerial raptor. In fact, some companies offer bird-control services using drones that mimic the appearance and flight behavior of falcons, and their use has already been adopted at some airports (Rosenberg 2017). In addition to discriminating between various aerial predators and vehicles, some birds have also shown an ability to evaluate a predator’s behavior during threat assessment. Arabian Babblers (Turdoides squamiceps) do not initiate alarm calls following detection of known predators flying at high altitudes (i.e. migratory behavior), but alarm-call during encounters with the same predators under riskier scenarios (Edelaar and Wright 2006). Despite these observations, no study has evaluated the risk perception to different drone types controlling for multiple confounding factors (i.e. bird identity, habitat heterogeneity, etc.) that could influence behavioral responses to drone approach.
Our goal was to quantify perceived risk in birds to drone type and approach type, focusing on deterrence applications. We selected 2 commercially available drones types (i.e. fixed-wing and multirotor); we also used a drone mimicking the shape of an aerial predator (hereafter, predator model). Predator models have been successfully used to generate antipredator responses in birds (Blackwell et al. 2012). We conducted an experiment to evaluate behavioral responses of individual birds to head-on and overhead approaches by the 3 platform types. We hypothesized these approach types would reflect 2 potential threat levels: one with high risk because of a potential collision (head-on approach) and one with lower risk (overhead approach).
The experiment allowed us to control for multiple confounding factors not considered in previous studies (Vas et al. 2015, McEvoy et al. 2016), such as bird identity, hunger, and habitat heterogeneity. We used the Red-winged Blackbird (Agelaius phoeniceus) as the model species because it behaviorally responds to both simulated predators (Yasukawa et al. 1992) and drones (Wandrie et al. 2019). Additionally, blackbirds (Icteridae) are frequently involved in aircraft-bird collisions (Dolbeer et al. 2016) and are also recognized as agricultural pests in North America (Linz et al. 2011, Klosterman et al. 2013, Linz et al. 2017), making them a candidate species to test avian frightening devices. We examined multiple behavioral decisions (e.g., vigilance, alarm-calling, and escape; Cooper and Blumstein 2015) because we recognized that differences in perceived risk might cause variation in some, but not all, antipredator behaviors that we considered (Cresswell 2008). We did not measure physiological responses (Weimerskirch et al. 2018).
We developed 3 alternative hypotheses regarding blackbird responses to drones. If blackbirds perceived the predator model as riskier than the common drone platforms (Blackwell et al. 2012, Lima et al. 2015, McEvoy et al. 2016), we predicted the predator model would generate greater or more frequent antipredator responses than the other drone platforms. If blackbirds perceived the predator model and the other drones as equally risky (Weissensteiner et al. 2015), we predicted there would be no differences in antipredator responses among them. If blackbirds perceived the other drones as riskier than the predator model, we predicted the predator model would generate less intense antipredator responses.
Additionally, we hypothesized that across platform types, blackbirds would perceive head-on approaches as riskier than overhead approaches (Stankowich and Blumstein 2005), enhancing antipredator behavior, given that birds show stronger behavioral reactions to drones flying at lower altitudes (McEvoy et al. 2016, Bevan et al. 2018, Weimerskirch et al. 2018) and approaching directly (Mulero-Pázmány et al. 2017). Finally, we tested for potential interaction effects between platform type and approach type because previous studies found that animals approached by a human observer escaped earlier when approached tangentially than directly (Cooper et al. 2003, Fernández-Juricic et al. 2005). If the antipredator responses of blackbirds to the predator model are stronger with the head-on vs. overhead approach, but this trend becomes the opposite with the other drone approaches, we would expect a significant interaction effect.
METHODS
Stimuli
We used 3 drone platforms: a drone modeling the form of an aerial raptor (United States Department of Agriculture-Animal and Plant Health Inspection Service-Wildlife Services Aviation Training and Operations Center [USDA-APHIS-WS ATOC], Cedar City, UT, USA), a fixed-wing drone resembling an airplane (Flite Test [FT] Explorer; Flight Test, New Philadelphia, OH, USA), and a multirotor (DJI Phantom 4 Pro; DJI, Shenzhen, China; Figure 1). We will hereafter refer to these as predator model, fixed-wing, and multirotor, respectively (see Appendix A for drone specifications). The predator model used in this study is not commercially available, but there are similar models available online (e.g., https://graysonhobby.com/rc-flying-eagle-white.html).

Platform types included a DJI Phantom 4 Pro (multirotor), predator model, and a fixed-wing drone. The multirotor is 350 mm in diagonal length, and we disabled the factory-installed lights during the experiment. The predator model and fixed-wing have wingspans of 1,430 mm.
Experimental Arena
We conducted our experiment in an agricultural field at the North Dakota State University Agronomy Seed Farm in Casselton, North Dakota, USA (46.883052°N, –97.235003°W). The experimental arena (305 × 27.5 m) was bordered by sunflower (Helianthus annuus; 1.5 m tall) and included a launch point, an approach path devoid of visual obstructions (i.e. vegetation height <30 cm), and a bird enclosure (Figure 2). We visually screened the target birds from the pilot (C.C.E.), visual observer (W.K., J.P., or C.Q.), and area behind the enclosure during trials using ~2 m tall screens (Figure 2). Small openings were cut in the screens so that the pilot and visual observer could see the drones when necessary (i.e. U.S. Federal Aviation Administration visual line-of-sight compliance). The enclosure was a 12.7 mm polypropylene net over a steel frame (3.7 × 3.7 × 2.7 m) with 2 compartments and a landscape fabric floor (Figure 2). During trials, we recorded ambient temperature (12.3–34.7°C) and average wind speed (0.0–13.9 km hr–1) using a Skymaster SM-28 weather meter (Speedtech Instruments, Great Falls, VA, USA) and ambient light intensity (115.01–883.5 µmol m–2 s–1) with a Li-Cor (Lincoln, NE, USA) LI-250 Light Meter and LI-190SA Quantum Sensor.
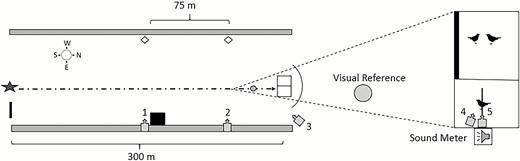
Overhead view of experimental arena including launch site (star), pilot blind (square), launch assistant blind (black rectangle), sunflower (gray rectangles), visual markers (white diamonds), drone approach path (dotted arrow line), and cameras (gray arrow boxes). The area around the enclosure holding the focal and companion birds is magnified for clarification. A disc used for visual reference was located 10.3 m away from the perch. We measured drone speed by recording the time required for each drone to travel 75 m between visual markers opposite cameras 1 and 2. Camera 3 recorded drone position relative to the enclosure. Cameras 4 and 5 recorded Red-winged Blackbird behavior during trials.
Trials
We conducted trials between August 7 and September 12, 2017, from 0720 hours to 1200 hours under calm weather conditions (i.e. no precipitation). We exposed 87 male, Red-winged Blackbirds individually to a single drone flight (i.e. 1 flight per bird; see Appendix B for details of animal care and maintenance). We divided the enclosure into 2 compartments. One compartment served as the focal compartment, where we provided a perch and food tray 1.7 m high located in the center of the compartment. The adjacent compartment housed 2 companion blackbirds to reduce stress behaviors in the focal bird. We obstructed this compartment, so companion birds would not be visually exposed to the drone approaches, although they were still exposed to drone noise. The compartments allowed visual and auditory, but not physical, contact between blackbirds. Thus, focal birds most likely responded to the visual approach of the drone rather than the companion birds.
We placed 2 companion blackbirds in the enclosure at the beginning of each day and provided food and water ad libitum. We selected companion birds each morning from a stock of 13 individuals, housed separately from focal individuals. In an effort to reduce the number of birds in captivity, companion birds experienced multiple trials per day (i.e. 3–8). As noted above, companion birds were blind to drone approaches. Therefore, we did not collect data from these individuals. Prior to the trials, we motivated foraging by securing sweetcorn (7 cm) to the food tray in the focal compartment, and we placed a perch directly behind the tray to control bird location during trials. Five cameras (GoPro HERO5 Black; GoPro, San Mateo, CA, USA) recorded blackbird behavior and drone approach (60 frames s–1; Figure 2).
We food-deprived focal birds for 25–30 hr to motivate foraging during trials and tested 3–8 focal birds per day. In preliminary trials, we food-deprived birds 12–16 hr; however, these birds did not forage for >40 min following release into the enclosure. Following these observations, we changed protocol and food-deprived birds for the next day as we collected focal birds for the current test day. This change reduced the frequency that birds were visited by human observers, consequently minimizing exposure to human-induced stress. Furthermore, we also considered the maximum food-deprivation periods tolerated by other bird species (e.g., 32 hr for House Sparrows [Passer domesticus]; McCue 2010, Khalilieh et al. 2012).
Once the focal bird foraged for 30 s, after release into the enclosure, we performed a flight treatment. Flight treatments required coordination between the pilot and visual observer (W.K., J.P., or C.Q.). The visual observer was located behind a screen near the launch point and the pilot (C.C.E.) operated drones from a blind located near the center of the flight path to prevent birds from observing human activity (Figure 2). Once a focal bird began foraging, the visual observer exited to hand-launch the predator model or fixed-wing. By contrast, the multirotor drone did not require a hand-launch and was already on the ground at the launch point when the focal bird began foraging. We launched the predator model and fixed-wing windward and quickly reoriented flight direction toward the enclosure. By contrast, we hovered the multirotor and accelerated directly toward the enclosure (Figure 3). Thus, all drones were visually exposed to the focal bird prior to launch, but the visual observer was only visible to focal birds during launches of the predator model and fixed-wing. After launching the predator model and fixed-wing, the visual observer stepped behind a screen.
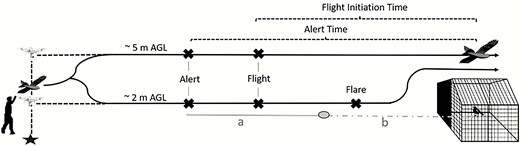
Drone approach from launch to overpass. We launched the predator model and fixed-wing windward by hand. We hovered the multirotor to the appropriate treatment altitude and accelerated directly toward the enclosure. During head-on approaches, the drone flared upward prior to colliding with the enclosure. Overhead approaches did not flare. We measured individual alert time and flight-initiation time of Red-winged Blackbirds for head-on approaches using the time required for the drone to reach the visual reference located 10.3 m away from the perch from the moment the bird responded (a) and projected the time required for the drone to travel an additional 10.3 m (b). We then added (a + b) to estimate response time for head-on approaches. Figure not to scale.
Our design comprised 2 independent factors: platform type and approach type. Platform type had 3 levels (i.e. predator model, fixed-wing, and multirotor). Approach type had 2 levels (i.e. head-on and overhead). Consequently, we had 6 treatments (1 = head-on predator model, 2 = overhead predator model, 3 = head-on fixed-wing, 4 = overhead fixed-wing, 5 = head-on multirotor, and 6 = overhead multirotor). In the head-on approach, the drone traveled at a direction and altitude simulating a collision course with the bird, but the drone flared upward ~6 m before reaching the enclosure (Figure 3). In the overhead approach, drones traveled ~5 m above the enclosure (Figure 3), substantially lower in altitude than typical monitoring applications (Wich and Koh 2018). After the drone passed over the enclosure, we circled the drone back to the pilot location for landing. We recorded the behavior of the birds during the drone approach (see Behavioral Response Metrics, below) and stopped recording 30 s after the focal bird resumed foraging.
To assess confounding effects associated with approach by different platform types, we calculated ground speed for each flight using the time required for the drone to pass between cameras located 75 m apart along the approach path (Figure 2). Drone speeds ± standard deviation (SD) (m s–1) did not vary among platform types (F = 1.1, degrees of freedom [df] = 2 and 84, P = 0.34; predator model: 13.76 ± 1.84, n = 30; fixed-wing: 13.14 ± 1.78, n = 30; multirotor: 13.75 ± 1.91, n = 27). We calculated approach time from the moment the drone accelerated forward to the moment it passed above the enclosure. Approach times ± SD (s) did not vary among platform types (F = 0.4, df = 2 and 84, P = 0.67; predator model: 25.86 ± 4.94, n = 30; fixed-wing: 25.71 ± 3.89, n = 30; multirotor: 24.94 ± 3.29, n = 27). We did not calculate exposure time prior to launch (i.e. total time each drone was visually exposed to birds) but consider this effect by evaluating vigilance behavior before the drone approach.
To assess differences across platform types in the noise generated, we recorded ambient sound intensity using a digital sound meter (Model 407732, Extech Instruments Corp., Nashua, NH, USA) located at perch height next to the enclosure (Figure 2). The sound meter recorded a time-stamped sound (dB) reading every second. For each trial, we averaged 10 readings immediately prior to overpass and assumed the loudest reading occurred as the drone passed above the enclosure.
The visual detection of each drone by blackbirds might be influenced by the perception of differences in object brightness (achromatic) and hue (chromatic) between the drone and the visual background (Fernández‐Juricic et al. 2012). To assess these differences, we used the receptor-noise limited visual model (Vorobyev and Osorio 1998), adjusted to the retinal properties of the Red-winged Blackbird (Fernández-Juricic et al. 2019), to estimate how conspicuous the drones were against the ambient background of our field site (Blackwell et al. 2012, Fernández-Juricic et al. 2013, Doppler et al. 2015). This visual model, which incorporated object and background reflectance, spectral properties of ambient light, and species-specific visual system properties, has been successfully applied to estimate visual perception of aircraft approaching birds (Blackwell et al. 2012, Doppler et al. 2015).
We measured the percent reflectance of the wings for the predator model and fixed-wing, and body fuselage of the multirotor by taking 10 measurements of each drone using a Jaz portable spectrometer (Ocean Optics, Inc., Dunedin, FL, USA). Each measurement ranged from 300 to 700 nm, was interpolated to 1 nm increment, and averaged together for each drone. We took 10 measurements of the radiance of the sky and 10 at the horizon (October 20, 2017), which served as the 2 visual backgrounds for the 3 drones using a JAZ portable spectrometer.
We measured the ambient light intensity on a clear (<10% cloud cover) and cloudy (>80% cloud cover) day at 0900 hours in an open grassy field in West Lafayette, Indiana, USA (40.417370°N, –86.941781°W) on March 19 and 21, 2015, using the absolute irradiance function of the JAZ spectrometer. For ambient light intensity, we took 10 measurements for the cloudy and 10 for the sunny condition (2 measurements in each of the 4 cardinal directions and 2 directly above at the sky). We averaged the measurements, converted from µWatt cm–2 nm–1 to µmol s–1 m–2, and interpolated to 1-nm increments for both the clear and cloudy conditions before incorporating them in the perceptual models.
For the perceptual modeling, we used the Pavo package (R; Maia et al. 2013) and followed the procedures described in Baumhardt et al. (2014). The units of chromatic and achromatic contrast are expressed in units of “just noticeable differences” (JND) units; values <4 suggest that the animal would have a difficult time discriminating the object (drone) relative to the visual background. The unit of these visual models is the relative distance between the object and the background in the color space of the Red-winged Blackbird. The larger the distance, the higher the value of visual contrast (chromatic or achromatic) and, consequently, the greater the visual conspicuousness of the drone in relation to the background from the visual perspective of blackbirds (Siddiqi et al. 2004, Doppler et al. 2015). We did not obtain model estimates for each trial, consequently we present values per each ambient light condition.
Behavioral Response Metrics
A single observer (C.C.E.) measured the following behavioral responses: vigilance, individual alert time, whether a bird alarm-called, whether a bird initiated flight, flight-initiation time, and latency to resume foraging. We did not include trials where the behavioral response occurred during or after a piloting error (e.g., drone crashed or significantly deviated from the flight path; n = 7). We used BORIS (5.1.0; Friard and Gamba 2016) to analyze video footage.
We recorded focal bird vigilance behavior for 30 s both immediately before and after drone flights. Specifically, we measured the proportion of time with the head-up (i.e. head above the horizontal plane of the body) during foraging bouts. We examined vigilance behavior at 0.10x playback speed (60 frames per second), and measurements began when a focal individual initiated foraging. For vigilance, we only considered birds that foraged from the perch a full 30 s. Thus, we omitted birds from analysis that did not forage for a full 30 s or perched in a manner that was not comparable with other birds (i.e. directly on the food tray as opposed to the perch).
We defined alert responses as a noticeable transition from a general behavior (e.g., foraging, preening, loafing, or scanning) to an alert behavior directed toward the drone (Blackwell et al. 2009, 2012, DeVault et al. 2015, Doppler et al. 2015). We recorded an individual’s alert time as the time (s) required for the drone to reach the point above the center of the focal compartment (hereafter enclosure) from the moment at which the bird showed an alert response, as defined above. Furthermore, alert behavior in response to the drone approach had to continue uninterrupted until the drone passed above the enclosure or the bird initiated a flight response.
We recorded if birds alarm-called and initiated flight in response to drone approaches. We defined flight response as an airborne departure from the perch. If a bird initiated flight, we recorded individual flight-initiation time as the time (s) required for the drone to reach the enclosure from the moment at which the focal bird initiated flight. Greater values of alert-time and flight-initiation time indicate that a response occurred earlier in the approach sequence. If a bird failed to respond to drone approach as defined above, we scored flight-initiation time as 0, and did not include the data point in analyses.
During head-on approaches, we flared the drone to avoid collision with the enclosure. Thus, we projected the time required for the head-on approaches to reach the enclosure after the flare (i.e. as if the drone had been allowed to continue traveling directly forward through the enclosure). To do so, we used video to calculate the speed of the drone for each trial (methods described above) and projected the time required for the drone to travel to a bird’s location (i.e. perch) from a visual marker positioned 10.3 m from the perch (Figure 3). The calculated speed of the drone allowed us to estimate individual alert and flight-initiation times for head-on approaches; overhead approaches did not require the projection (Figure 3).
In addition, we recorded the time (s) it took the focal bird to resume foraging from the moment the drone passed directly above the enclosure. Greater values indicate a bird took longer to resume foraging following the drone’s overpass above the enclosure. For latency to resume foraging, we did not include trials where birds did not forage prior to approaches (n = 1), or failed to resume foraging after 15 min following drone exposure (n = 1).
Statistical Analyses
We evaluated platform type, approach type, and the interaction between platform type and approach type as fixed effects. We also considered sound intensity, wind speed, wind direction, ambient temperature, food deprivation time, ambient light intensity, drone speed, and approach time per trial as covariates. After examining covariance among candidate effects using general linear models and correlation tests (Appendix Table 3 in Appendix C), our final model included platform type, approach type, ambient light intensity, drone speed, and the interaction between platform type and approach type. We also included flight (i.e. bird responded to drone approach by flying) as a categorical predictor variable in the latency to resume foraging model given that birds taking flight would take longer to resume foraging.
We used general linear models to model alert time, flight-initiation time, and latency to resume foraging. We examined model residuals and log10-transformed alert time, flight-initiation time, and latency to resume foraging to meet model assumptions of normality. When general linear models were not appropriate (i.e. assumptions not met), we used generalized linear models with logit link functions to model the probability of focal birds alarm-calling and the probability of birds initiating a flight response (binomial distribution). We used Cook’s distances to identify 3 outliers in our latency to resume foraging model. These 3 birds returned to forage 5.7, 8.0, and 11.5 min following drone flights, whereas the remaining 75 birds considered in our analysis returned in <3 min. We report both results that exclude and include these 3 outliers.
We ran a general linear mixed model to assess the variation in the proportion of time spent vigilant before and after the drone exposure relative to the 3 different platform types. We only included birds that foraged for 30 s both before and after drone exposure. We used the package lme4 (Bates et al. 2015), and we established time (before/after exposure) and platform type (predator model, fixed-wing, multirotor) and their interaction as fixed factors, whereas the identity of the bird was considered a random factor. We tested the significance of the fixed factors with a Wald test.
We also used Tukey’s honest significant difference tests for multiple comparisons (lsmeans package in R; Lenth 2016) to assess differences between levels of platform type. We used a significance threshold (α = 0.05) and conducted all statistical analyses using type III sums of squares (car package; Fox et al. 2012) in R (3.4.3; www.r-project.org). Results are presented as least squared means ± SE unless stated otherwise. We also present means ± standard error (SE) for untransformed raw data when appropriate.
RESULTS
Sound intensity recorded at the enclosure varied among platform types (dB; F = 27.6, df = 2 and 80, P < 0.001; Appendix Table 3). The predator model (50.6 ± 0.56 dB, n = 29) was quieter than the fixed-wing (56.3 ± 0.54, t80 = 7.4, P < 0.001, n = 30) and multirotor (54.0 ± 0.58; t80 = 4.3, P < 0.001, n = 27) during approaches. The fixed-wing was louder than the multirotor (t80 = 2.9, P = 0.01). From the Red-winged Blackbird visual perspective, the platform types varied in their achromatic and chromatic conspicuousness, with the predator model and the fixed-wing having relatively higher achromatic saliency than the multirotor (Figure 4). However, Red-winged Blackbirds might have had some difficulty in visually detecting the multirotor chromatically from the horizon background given how close values were from the discrimination threshold (JND = 4; Figure 4). Ambient light conditions (sunny vs. cloudy) changed the JND values to some extent but the multirotor was less visually conspicuous than the predator model and fixed-wing under both conditions (Figure 4).
![Chromatic and achromatic contrast values for the drones (just noticeable differences [JND]) of drones under sunny and cloudy ambient light conditions, using visual system properties of Red-winged Blackbirds (see Methods for details). JND > 4 indicates the drone was distinguishable against the visual background (horizon, sky).](https://oup.silverchair-cdn.com/oup/backfile/Content_public/Journal/condor/122/3/10.1093_condor_duaa014/1/m_duaa014f0004.jpeg?Expires=1747880587&Signature=ke1By6InUVGsmaRkTXY2Du~tKk0D29G8UxuvrhQhUpI38L57uVrjxQMNdHCP8qMsEX8r5tCCUxbHjgQVZhQPaRk8VDsUYsEG-mo0rRuGCiEFxaSdPxKm0sP54TIhH~O6i0y8oCQ1YLGFG~-rCP3FWcRt7HW2PdbRWEAv0OXFevrBjTnyAQU3mA9L1fJtylbSZ27rUwO44cbkwnHVaakBrIPjMly8~HSWPDbtQxKyNl8KYWbeRAh~4NZvYc5dqap0Qzj36NiWuKW1CrTMzTir2qA-c61bX55akkJmjVHlonN9aqxQjVMgWcPi0CL3F~xaDJA1NR5BY6VzdPWJAbkLdA__&Key-Pair-Id=APKAIE5G5CRDK6RD3PGA)
Chromatic and achromatic contrast values for the drones (just noticeable differences [JND]) of drones under sunny and cloudy ambient light conditions, using visual system properties of Red-winged Blackbirds (see Methods for details). JND > 4 indicates the drone was distinguishable against the visual background (horizon, sky).
We considered 87 birds in the following analyses. We were unable to control orientation and feeding patterns for every bird. During the drone approach, birds were either foraging from the perch (n = 76), perched directly on the food tray (n = 3), or loafing on the perch but not foraging (n = 8). Our general linear mixed model found no significant effect of time and the interaction between time and platform type on the proportion of time blackbirds spent vigilant (Table 1). However, platform type was significant (Table 1) with blackbirds exposed to the predator model spending a greater proportion of time (30 s sampling interval; 0.46 ± 0.03, n = 17; Figure 5) vigilant compared with the fixed-wing (0.35 ± 0.03, t57 = –2.8, P = 0.02, n = 21), and multirotor (0.34 ± 0.03, t57 = –2.9, P = 0.01, n = 22), both before (i.e. drones visible, but not yet launched) and after the drone flights (Figure 5). There was no significant difference between the fixed-wing and multirotor (t57 = 0.04, P = 0.99). The random component of the model yielded the following SD: intercept, 0.096; and residual, 0.110.
Responses (alarm-call, flight, and vigilance) of Red-winged Blackbirds to drone platforms. Results of alarm-call and flight are derived from generalized linear models with a binomial distribution. We omitted the multirotor treatment from both models due to only 1 bird alarm-calling and no birds taking flight. We omitted the overhead approach treatment from the flight model due to only 1 bird taking flight in response to overhead predator model. Vigilance results are derived from a general linear mixed model. We conducted trials in Cass County, North Dakota, between August and September, 2017.
| χ 2 | P | |
|---|---|---|
| Alarm-call (n = 56) | ||
| Platform type | 8.2 | 0.004 |
| Approach type | 16.5 | <0.001 |
| Platform type * approach type | 0.4 | 0.52 |
| Ambient light intensity (µmol m–2 s–1) | 0.4 | 0.55 |
| Drone speed (m s–1) | 3.6 | 0.06 |
| Flight (n = 26) | ||
| Platform type | 0.1 | 0.71 |
| Ambient light intensity (µmol m–2 s–1) | 5.3 | 0.02 |
| Drone speed (m s–1) | 0.4 | 0.52 |
| Vigilance (n = 60) | ||
| Time | 2.6 | 0.11 |
| Platform type | 10.5 | 0.005 |
| Platform type * time | 0.2 | 0.88 |
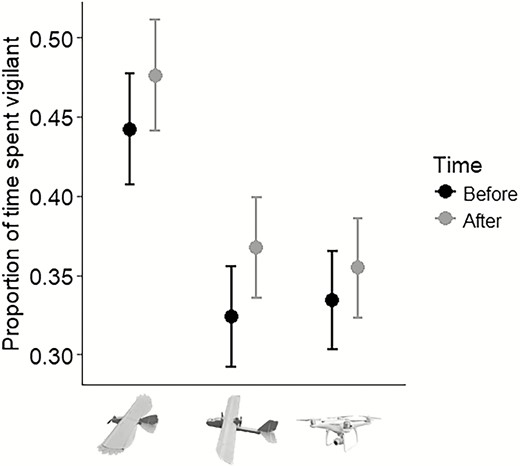
Proportion of time (30 s sampling interval) Red-winged Blackbirds spent vigilant both before and after drone flights in response to the predator model (n = 17), fixed-wing (n = 21), and multirotor (n = 22). We conducted trials in Cass County, North Dakota, USA, between August and September, 2017.
Alert-time (log10-transformed) varied significantly among platform types (Table 2, Appendix Table 4). Blackbirds showed an alert response ~2× earlier in response to the predator model (15.6 ± 1.5 s, n = 30) compared with the fixed-wing (7.5 ± 1.3 s; t79 = –4.8, P < 0.001, n = 30) and ~8× earlier compared with the multirotor (1.9 ± 0.25 s; t79 = –9.8, P < 0.001, n = 27). Blackbirds showed an alert response ~4× earlier to the fixed-wing compared with the multirotor (t79 = 5.1, P < 0.001). We observed no significant effect of approach type or an interaction between platform type and approach type on alert-time (Table 2, Appendix Table 4).
Red-winged Blackbird responses to drones (log10 alert time, log10 flight-initiation time, log10 latency to resume foraging). For log10 latency to resume foraging, we included results that both excluded and included outliers. Treatments include 3 platform types (predator model, fixed-wing, and multirotor) and 2 approach types (head-on vs. overhead). Results are derived from general linear model analysis using type III sums of squares. Degrees of freedom (df) differ between response variables based on behavior criteria we considered for each response (e.g., birds not considered if witnessed aberrant drone flight dynamics). We conducted trials in Cass County, North Dakota, between August and September, 2017.
| df | F | P | |
|---|---|---|---|
| Log10alert time (s) | |||
| Platform type | 2, 79 | 48.3 | <0.001 |
| Approach type | 1, 79 | 2.5 | 0.11 |
| Platform type * approach type | 2, 79 | 1.2 | 0.30 |
| Ambient light intensity (µmol m–2 s–1) | 1, 79 | 2.8 | 0.10 |
| Drone speed (m s–1) | 1, 79 | 1.2 | 0.28 |
| Log10flight-initiation time (s) | |||
| Platform type | 1, 11 | 1.5 | 0.24 |
| Ambient light intensity (µmol m–2 s–1) | 1, 11 | 0.4 | 0.56 |
| Drone speed (m s–1) | 1, 11 | 0.5 | 0.50 |
| Log10latency to resume foraging (s) | |||
| Platform type | 2, 66 | 15.1 | <0.001 |
| Approach type | 1, 66 | 0.1 | 0.72 |
| Platform type * approach type | 2, 66 | <0.1 | 0.98 |
| Ambient light intensity (µmol m–2 s–1) | 1, 66 | 0.4 | 0.50 |
| Drone speed (m s–1) | 1, 66 | 0.3 | 0.58 |
| Flight | 1, 66 | 12.2 | <0.001 |
| Log10latency to resume foraging (s) outliers included (n = 3) | |||
| Platform type | 2, 69 | 3.8 | 0.03 |
| Approach type | 1, 69 | <0.1 | 0.98 |
| Platform type * approach type | 2, 69 | <0.1 | 0.98 |
| Ambient light intensity (µmol m–2 s–1) | 1, 69 | 0.3 | 0.59 |
| Drone speed (m s–1) | 1, 69 | 0.1 | 0.73 |
| Flight | 1, 69 | 9.5 | 0.002 |
Only a single bird alarm-called in response to the multirotor treatment (Figure 6). Thus, we omitted the multirotor treatment from the analysis due to lack of data. When evaluating only the predator model and fixed-wing treatments, we found the probability of a bird emitting an alarm-call was affected significantly by platform type (Table 1, Appendix Table 5), with a 55% (SE ± 13, n = 29) probability of a blackbird alarm-calling in response to the predator model compared with 14% (SE ± 8, n = 27) for the fixed-wing. We also found a significant effect of approach type (Table 1, Appendix Table 5), with a 63% (SE ± 12, n = 26) probability of a blackbird alarm-calling in response to head-on approaches compared with 10% (SE ± 6, n = 30) for overhead approaches. We did not find a significant interaction effect between platform type and approach type (Table 1).
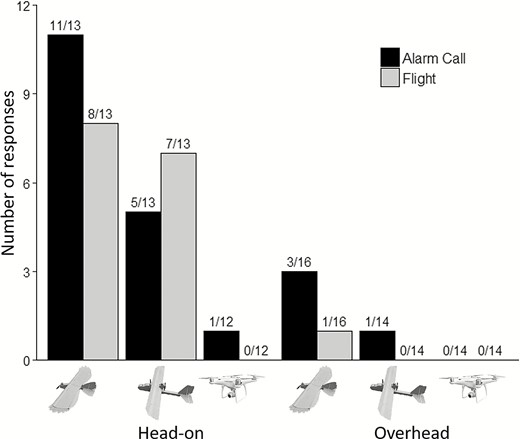
Number of Red-winged Blackbirds that alarm-called and initiated flight in response to predator model, fixed-wing, and multirotor under head-on and overhead approaches. We conducted trials in Cass County, North Dakota, USA, between August and September, 2017.
No birds initiated flight in response to the multirotor treatment, and only a single bird initiated flight in response to overhead approaches (Figure 6). Thus, we omitted multirotor and overhead treatments from the subsequent analysis. When evaluating only head-on approaches of the predator model and fixed-wing, we did not observe a significant effect of platform type on the probability of a blackbird initiating flight; however, we found a significant effect of ambient light intensity (Table 1, Appendix Table 5). The probability of a blackbird flushing in response to either platform type (predator model or fixed-wing) decreased from ~80% to ~20% as ambient light intensity increased from 115 to 884 µmol m–2 s–1. For blackbirds that initiated flight, we observed no significant effect of platform type (predator model vs. fixed-wing) on flight-initiation time (log10 scale; Table 2).
Latency to resume foraging (log10-transformed) was significantly affected by platform type and flight response (Table 2, Appendix Table 4). Blackbirds returned to forage ~3× later in response to predator model approaches (56.8 ± 9.7 s, n = 26) compared with the fixed-wing (18.8 ± 4.4 s; t66 = –5.2, P < 0.001, n = 24) and ~5× later compared with the multirotor (12.1 ± 2.8 s; t66 = –4.1, P < 0.001, n = 25). There was no difference between the fixed-wing and multirotor (t66 = –0.7, P = 0.75). Birds that initiated flight took longer to resume foraging compared with birds that did not take flight (t66 = –3.5, P < 0.001).
Results differed when including 3 outliers. Latency to resume foraging (log10-transformed) was significantly affected by platform type and flight response (Table 2, Appendix Table 4). Blackbirds returned to forage ~1.6× later in response to predator model approaches (80.3 ± 25.3 s, n = 27) compared with the fixed-wing (49.0 ± 21.6 s; t69 = –3.8, P < 0.001, n = 26) and ~6× later compared with the multirotor (12.1 ± 2.8 s; t69 = –3.6, P = 0.002, n = 25). There was no difference between the fixed-wing and multirotor (t69 = 0.07, P = 0.997). Birds that initiated flight took longer to resume foraging compared with birds that did not take flight (t69 = –3.1, P = 0.003).
We did not score the behavior of the companion birds. We did watch their behavior relative to the target birds and they typically did not show alert/alarm behaviors until the drones passed directly above the enclosure. Since our data suggest that target birds were showing heightened vigilance to the predator model before it was launched (Figure 5), we do not believe the behavior of the companion birds would have influenced our results. In other words, target birds exposed to the predator model were reacting before companion birds would have been able to hear it and react if they were sensitized to its approach.
DISCUSSION
We intended to assess how blackbirds react to common drone platforms when compared with a simulated predator attack posed by our predator model. Blackbirds showed alert responses earlier, alarm-called more frequently, returned to forage later, and allocated more time to vigilance in response to the predator model compared with the other 2 drone types. Overhead approaches generally failed to elicit flight in blackbirds across all drones, and no blackbirds took flight in response to the multirotor at either head-on or overhead approaches. Overall, our findings are consistent with the idea that blackbirds perceived the predator model as riskier than common drone platforms (i.e. fixed-wing and multirotor models).
Blackbirds showed enhanced perceived risk toward approach by the predator model, as compared with the other drones, corroborating previous findings (Lorenz 1939, Tinbergen 1939, 1948, Blackwell et al. 2012). However, we acknowledge that differences in size, contrast, and launch procedures may have influenced our results. Specifically, the multirotor used in our study was smaller in size, less visually conspicuous than the predator model and fixed-wing, and not launched by a human observer, all of which may have influenced perceived risk. However, in comparing the predator model with the fixed-wing drone, alert differences were likely attributable to the predator silhouette (Tinbergen 1939, 1948) given that size, color, and contrast of both drones were similar. Specifically, from the perspective of perception, each drone was readily detectable to blackbirds. As far as the effect of sound, blackbirds showed their alert responses earliest to the predator model, despite it being the quietest drone, evidence that sound did not prompt the initial alert. Further, prior to the approach, but while drones were visible, blackbirds spent more time vigilant while exposed to the predator model compared with the other platform types despite both drones being readily perceived (based on chromatic and achromatic contrasts) and similar in size. Therefore, blackbirds might have detected and discriminated the appearance of our stationary drones from 300 m and delayed overt alert reactions until the drone began forward movement. Detection at this distance is plausible. For instance, Blackwell et al. (2009) estimated the distance Mourning Doves (Zenaida macroura) and Brown-headed Cowbirds (Molothrus ater) can detect an object visually (as opposed to behaviorally responding to it) occurs at ~1,000 m. Our findings provide further evidence that platform-specific visual cues (e.g., contour) likely played a role in the risk perceived by blackbirds.
Also, we contend that the predator model, despite being a drone, effectively mimicked a raptor. Classic research by Lorenz (1939) and Tinbergen (1939, 1948) first introduced the scientific community to the possibility of innate responses in prey birds to avian predator shape via models. Similar responses have been observed across free-ranging taxa (Conover 1979, Boag and Lewin 1980) and in experimental settings (Blackwell et al. 2012). In addition, predator models, conspecific effigies, and robots have been effectively deployed to examine mobbing behavior (Shalter 1978), predation risk (Devereux et al. 2006, Jones et al. 2007, Tisdale and Fernández-Juricic 2009), and have been used in sensitization to predators for reintroduction (McLean et al. 1999), and as avian repellents or deterrents (Ronconi and Cassady St. Clair 2006, Blackwell and Fernández-Juricic 2013, Avery and Werner 2017).
Directionality of an approaching threat is a component of perceived risk in predator-prey scenarios (Møller and Tryjanowski 2014, Mulero-Pázmány et al. 2017) and has been confirmed experimentally (Lima and Bednekoff 2011, Blackwell et al. 2019). Flight and alarm-call responses occurred less frequently during overhead flights, supporting observations where wildlife responded less frequently when drones approached at greater altitudes (McEvoy et al. 2016, Rümmler et al. 2016, Bevan et al. 2018, Weimerskirch et al. 2018, Wandrie et al. 2019). Interestingly, approach type had no effect on alert behavior, indicating a 3-m decrease in flight altitude from the overhead approach to the head-on approach did not enhance alert responses. Physiological responses (e.g., increased heart rate) may have occurred, but we did not measure them. Recent work by Weimerskirch et al. (2018) revealed that incubating, adult King Penguins (Aptenodytes patagonicus) showed little to no behavioral response to approaches by a multirotor (DJI Phantom 3), but their metabolic heart rate levels increased 30% from baseline. Similar observations have occurred with American black bears (Ursus americanus) during drone encounters (Ditmer et al. 2015). Future drone studies should identify minimum flight altitudes in combination with drone launch distances that lessen antipredator responses by wildlife (McEvoy et al. 2016, Barnas et al. 2018, Wandrie et al. 2019). However, responses are expected to be species-specific (Bevan et al. 2018, Blackwell et al. 2019) and dependent on life-history characteristics including age or breeding status (Mulero-Pázmány et al. 2017, Weimerskirch et al. 2018). Responses might also differ depending on the migratory status and annual molt-cycle phase of birds (Handegard 1988).
With head-on approaches of the predator model and fixed-wing, the probability of a blackbird initiating flight decreased as ambient light intensity increased. One explanation for this is the “disability glare hypothesis”, where high ambient light intensity can impair vision, potentially hindering detection and escape responses among birds (Fernández‐Juricic et al. 2012). In birds, ambient light intensity has been shown to influence reactions to predation risk (Fernández-Juricic and Tran 2007) and approaching automobiles (Blackwell et al. 2009), and should be considered when evaluating antipredator responses (Fernández‐Juricic et al. 2012). Ambient light intensity can also affect the ability of birds to visually resolve airborne threats (Blackwell et al. 2012, Beauchamp 2017) and could affect responses to drones. Future studies assessing wildlife responses to drones should consider the levels of ambient light as a potential confounding factor. In fact, we recommend that researchers limit variation in ambient light intensity when possible or include it as a covariate in models. Researchers should also standardize drone approaches toward wildlife relative to the position of the sun.
Our data suggest drones designed to mimic aerial raptors can effectively elicit amplified behavioral responses when compared with commercially available fixed-wings or multirotors. Although the fixed-wing elicited greater behavioral responses than the multirotor, the drones also varied in multiple physical attributes (e.g., size, color, sound output), complicating conclusions that one general drone type (i.e. multirotor vs. fixed-wing) is perceived as less risky than another. We suggest future research assesses wildlife responses to multirotors and generic fixed-wings having similar characteristics.
Management Implications
In summary, the commercially available drones investigated in this study elicited lower perceived risk relative to a predator model. Our findings have value for the development of drones for both wildlife deterrence and wildlife monitoring purposes. In deterrence scenarios, we predict that the commercial versions of multirotor drones and fixed-wings might not be successful. Consequently, developing new versions of these drones incorporating predatory components (shape, color, etc.) but keeping the same levels of flight maneuverability, particularly for multirotors, is encouraged. Alternatively, future research should explore whether adding salient on-board lighting (Blackwell et al. 2012, Doppler et al. 2015, Goller et al. 2018) to existing drone models or using multiple drones in coordination and/or in combination with negative stimuli (e.g., nonlethal chemical repellents; Ampatzidis et al. 2015, Wang et al. 2019) would enhance their deterrence potential.
Our results also have implications for wildlife monitoring. We suggest that multirotors could serve well in wildlife monitoring scenarios, but we also support recommendations outlined in Mulero-Pázmány et al. (2017), where wildlife managers deploying drones for monitoring should maximize altitude when possible. Most importantly, based on our results and other research (Lima et al. 2015), drones with predator attributes should be particularly avoided for wildlife monitoring purposes and for general use in areas harboring sensitive or endangered species. Future research should also evaluate the perceived risk responses of wildlife to drones that vary in size, color, and speed under field conditions, which would inform guidelines for the use of drones for surveying wildlife.
ACKNOWLEDGMENTS
We thank B. Kaiser, J. Preuss, K. Boteler, C. Quiring, and W. Kennerley for assistance with data collection and blackbird care. P. Baumhardt provided calculations of visual contrast for each drone. T. DeVault, D. McGranahan, and T. Greives provided earlier reviews of the manuscript.
Funding statement: The United States Department of Agriculture, Animal and Plant Health Inspection Service, Wildlife Services, National Wildlife Research Center (USDA-APHIS-WS-NWRC; #7438-0020-CA; QA-2731) and The United States Department of Transportation, Federal Aviation Administration, Office of Airports and Airport Technology Research and Development Branch (via Interagency Agreement DTFACT-14-X-00007) funded this project. Any use of trade, firm, or product names is for descriptive purposes only and does not imply endorsement by the U.S. Government. The NWRC approved the manuscript prior to submission.
Ethics statement: USDA-APHIS-WS-NWRC (QA-2731) and the North Dakota State University Animal Care and Use Committee (#A17032) approved all of the procedures used in this study.
Author contributions: B.F.B., E.F.-J., and P.E.K. secured funding for this project. C.C.E., B.F.B., E.F.-J., and P.E.K. developed project objectives and designed methodology; C.C.E. collected and managed the data; C.C.E., B.F.B., E.F.-J., and P.E.K. analyzed the data; C.C.E., B.F.B., E.F.-J., and P.E.K. wrote the manuscript. All the authors contributed to drafts and gave final approval for publication.
Data depository: Data and R code are available upon request and are publicly available from Egan et al. (2020) and the USDA Forest Service Research Data Archive at https://doi.org/10.2737/NWRC-RDS-2020-001.
LITERATURE CITED
APPENDIX A
Drone Specifications
We compared 3 drone platforms: a fixed-wing modeling the form of an aerial raptor (USDA-APHIS-WS ATOC, Cedar City, UT, USA), a fixed-wing resembling an airplane (FT Explorer; Flight Test, New Philadelphia, OH, USA), and a multirotor (DJI Phantom 4 Pro; DJI, Shenzhen, China). The multirotor is white, 350 mm in diagonal length, and we disabled the factory-installed lights during the experiment. The predator model and fixed-wing have wingspans of 1,430 mm, similar forward profiles and lengths, no lights, and are identical in structural material (i.e. brown foam). We operated the predator model and fixed-wing using a 2,500 mAh 3S/11.1V lithium polymer battery (Hyperion HK Ltd., Hong Kong, China: www.hyperion-world.com) and one vector flight controller and on-screen display (Eagle Tree Systems, LLC, Bellevue, WA, www.eagletreesystems.com).
APPENDIX B
Animal Care and Maintenance
The 100 male Red-winged Blackbirds used in this study were captured by USDA-APHIS-WS National Wildlife Research Center personnel in Colorado, USA, and transferred by C.C.E. to facilities at the Red River Zoo in Fargo, North Dakota, USA. The facility consists of several outdoor enclosures protected by a roof. Blackbirds were color-banded and housed across group enclosures under a natural light: dark cycle from March–October, 2017. No more than 20 individuals were permanently housed together across 4 small enclosures (2.4 × 2.4 × 2.4 m), and no more than 50 individuals in a single large enclosure (4.8 × 4.8 × 2.4 m). We fed individuals a mix of millet, cracked corn, milo, sunflower, and safflower seeds ad libitum. On occasion, we supplemented blackbird diet with dehydrated mealworms, sweet corn, and suet cakes. We distributed food and water across multiple containers and temperature-controlled reservoirs in each enclosure. We provided fresh food and water daily and cleaned enclosures weekly. We also provided perches and insulated shelters within each enclosure.
Data collection for this project was approved by the North Dakota State University Institutional Animal Care and Use Committee (Protocol #A17032), North Dakota Game and Fish Department (Scientific Collection Licenses #GNF04326470, GNF04657399), Colorado Department of Natural Resources Parks and Wildlife (Scientific Collection License #17TRb2006), and the United States Fish and Wildlife Service Migratory Bird Permit (#MB019065-2). Unmanned aircraft systems (UAS) were registered under the USDA-APHIS-WS Aviation Safety, Training, and Operations Center (Predator Model: FA3AXMMAPM; Fixed-wing: FA3YPX4l7Y; Phantom 4 Pro: FA37C3WEER) and flown under the United States Department of Transportation and Federal Aviation Administration (FAA) Remote Pilot Certificate Part 107 (#3928819). North Dakota State University Research and Creative Activity approved all UAS flight plans for privacy, ethics, and FAA part 107 compliance.
APPENDIX C
Model Summaries
We used general linear models and correlation tests to assess covariance and collinearity among candidate fixed effects. Sound intensity recorded at the enclosure was inherent to platform type and approach type. Wind direction and wind speed contributed to variable drone speeds across trials, with downwind and crosswind approaches being faster than windward approaches, and faster wind speeds resulting in faster drone speeds. We included drone speed in the model, given predator speed can influence antipredator behaviors (Stankowich and Blumstein 2005) and birds may respond to approaching vehicles using a spatial, rather than temporal margin of safety (DeVault et al. 2015). Temperature, food deprivation time, and ambient light intensity were correlated. We included ambient light intensity in the model as it can impair vision in birds, potentially hindering detection and escape responses (Fernández‐Juricic et al. 2012). Comparisons based on Red-winged Blackbird responses to drone flight trials, conducted in Cass County, North Dakota, USA, between August and September, 2017.
| df | F | P | ||
|---|---|---|---|---|
| Sound intensity (dB) | Platform type | 2, 80 | 27.56 | <0.001 |
| Approach type | 1, 80 | 4.29 | 0.04 | |
| Platform type * approach type | 2, 80 | 0.41 | 0.67 | |
| Drone speed (m s–1) | Wind speed (km hr–1) | 1, 79 | 4.26 | 0.04 |
| Wind direction | 3, 79 | 6.62 | <0.001 | |
| Wind speed * wind direction | 3, 79 | 2.36 | 0.08 | |
| r | ||||
| Drone speed vs. approach time (s) | –0.77 | |||
| Ambient light intensity (µmol m–2 s–1) vs. temperature (°C) | 0.76 | |||
| Ambient light intensity vs. food deprivation time (hr) | 0.68 | |||
| Food deprivation time (hr) vs. temperature (°C) | 0.62 |
Results from general linear model analysis of Red-winged Blackbird (n = 87) responses (log10 alert time and log10 latency to resume foraging) to 3 platform types (predator model, fixed-wing, multirotor) and 2 approach types (head-on vs. overhead). Values represent results of general linear models with the head-on fixed-wing set as the reference (i.e. the intercept). We conducted trials in Cass County, North Dakota, USA, between August and September, 2017.
| Effect | Mean | SD | Estimate | SE | t value | P |
|---|---|---|---|---|---|---|
| Log10alert time (s) | ||||||
| (Intercept) | 0.80 | 0.34 | 0.95 | 0.31 | 3.1 | 0.003 |
| Head-on multirotor | 0.28 | 0.33 | –0.54 | 0.14 | –3.9 | <0.001 |
| Head-on predator model | 1.11 | 0.30 | 0.31 | 0.13 | 2.3 | 0.02 |
| Overhead approach | 0.57 | 0.49 | –0.25 | 0.13 | –1.9 | 0.06 |
| Ambient light intensity (µmol m–2 s–1) | – | – | <0.01 | <0.01 | 1.7 | 0.10 |
| Drone speed (m s–1) | – | – | –0.02 | 0.02 | –1.1 | 0.28 |
| Multirotor x overhead approach | 0.09 | 0.34 | 0.09 | 0.19 | 0.5 | 0.64 |
| Predator model * overhead approach | 1.11 | 0.33 | 0.29 | 0.19 | 1.5 | 0.13 |
| Log10latency to resume foraging (s) | ||||||
| (Intercept) | 1.12 | 0.57 | 0.53 | 0.43 | 1.2 | 0.22 |
| Head-on multirotor | 0.90 | 0.49 | 0.07 | 0.20 | 0.4 | 0.72 |
| Head-on predator model | 1.78 | 0.27 | 0.63 | 0.18 | 3.5 | <0.001 |
| Overhead approach | 0.77 | 0.61 | –0.07 | 0.20 | –0.3 | 0.74 |
| Ambient light intensity (µmol m–2 s–1) | – | – | <0.01 | <0.01 | 0.7 | 0.51 |
| Drone speed (m s–1) | – | – | 0.02 | 0.03 | 0.6 | 0.58 |
| Flight | – | – | 0.60 | 0.17 | 3.5 | <0.001 |
| Multirotor * overhead approach | 0.90 | 0.29 | 0.05 | 0.26 | 0.2 | 0.86 |
| Predator model * overhead approach | 1.46 | 0.42 | 0.03 | 0.25 | 0.1 | 0.91 |
| Log10latency to resume foraging (s) outliers included (n = 3) | ||||||
| (Intercept) | 1.24 | 0.70 | 0.83 | 0.51 | 1.6 | 0.10 |
| (Head-on multirotor) | 0.90 | 0.49 | 0.00 | 0.24 | <0.1 | 0.99 |
| (Head-on predator model) | 1.78 | 0.27 | 0.54 | 0.21 | 2.5 | 0.01 |
| (Overhead approach) | 0.90 | 0.76 | <0.01 | 0.23 | <0.1 | 0.98 |
| Ambient light intensity (µmol m–2 s–1) | – | – | 0.00 | <0.01 | –0.5 | 0.59 |
| Drone speed (m s–1) | – | – | 0.01 | 0.03 | 0.4 | 0.73 |
| Flight | – | – | 0.62 | 0.20 | 3.1 | 0.003 |
| Multirotor * overhead approach | 0.90 | 0.29 | –0.02 | 0.31 | –0.1 | 0.95 |
| Predator model * overhead approach | 1.54 | 0.54 | 0.04 | 0.29 | 0.1 | 0.90 |
Results of generalized linear model analysis using a binomial distribution of Red-winged Blackbird responses (alarm-call and flight). Values represent results of generalized linear models with the fixed-wing set as the reference (i.e. the intercept). We conducted trials in Cass County, North Dakota, USA, between August and September, 2017.
| Effect | Model estimate | SE | Z | P |
|---|---|---|---|---|
| Alarm call (n = 56) | ||||
| (Intercept) | 5.49 | 3.27 | 1.7 | 0.09 |
| Predator model | 2.54 | 1.05 | 2.4 | 0.02 |
| Overhead approach | –2.21 | 1.24 | –1.8 | 0.07 |
| Ambient light intensity (µmol m–2 s–1) | –0.001 | <0.01 | –0.6 | 0.55 |
| Drone speed (m s–1) | –0.42 | 0.24 | –1.8 | 0.08 |
| Predator model x overhead approach | –1.05 | 1.60 | –0.7 | 0.51 |
| Flight (n = 26) | ||||
| (Intercept) | 4.85 | 4.09 | 1.2 | 0.24 |
| Predator model | 0.34 | 0.89 | 0.4 | 0.71 |
| Ambient light intensity (µmol m–2 s–1) | –0.005 | <0.01 | –2.1 | 0.04 |
| Drone speed (m s–1) | –0.17 | 0.27 | –0.6 | 0.53 |
