


Abstract
Over the past decade, the United States has seen a rapid increase in oil and gas extraction from areas where resources were previously thought to be unrecoverable, particularly the Bakken shale formation in North Dakota. The Bakken overlaps with the Prairie Pothole Region, the most critical habitat in North America for breeding ducks, where oil and gas extraction through hydraulic fracturing has the potential to impact more than a million duck pairs in the United States alone. Here, we evaluated the effect of oil and gas development on nesting ducks in 2015–2017 across 5 counties in North Dakota. Using data from ~4,000 nests we found that nest survival was higher at sites composed of a higher percentage of grassland, and for nests found closer to major roads. We found no effect of any metric of oil and gas extraction activity on duck nest survival. Using survival-corrected estimates of nest density, we found higher densities of nests closer to roads, but lower nest densities at sites surrounded by more wells. Our top-ranked model indicated that nest density was predicted to decline by 14% relative to sites with no development, given the average number of wells (3.15 wells) within 1,500 m of a site. However, within a nesting field, we found no evidence that ducks were avoiding petroleum-related infrastructure at smaller spatial scales. Our results indicate mixed effects of oil and gas development on nesting waterfowl, and highlight both the resiliency of dabbing ducks to environmental change and the need for additional research on other aspects of duck breeding biology.
RÉSUMÉ
Au cours de la dernière décennie, les États-Unis ont connu une augmentation rapide des activités d’extraction de pétrole et de gaz dans des zones où les ressources étaient auparavant considérées comme irrécupérables, en particulier la formation de schiste de Bakken, dans le Dakota du Nord. La formation de Bakken chevauche la région des cuvettes des Prairies, l’habitat le plus important en Amérique du Nord pour la reproduction des canards, où l’extraction de pétrole et de gaz par fracturation hydraulique pourrait avoir un impact sur plus d’un million de couples de canards rien qu’aux États-Unis. Dans cette étude, nous avons évalué l’effet de l’exploitation pétrolière et gazière sur les canards nicheurs de 2015 à 2017 dans 5 comtés du Dakota du Nord. À l’aide des données provenant de ~4000 nids, nous avons constaté que la survie des nids était plus élevée dans les sites composés d’un pourcentage plus élevé de prairie et pour les nids trouvés plus près des routes principales. Nous n’avons trouvé d’effet d’aucun paramètre de l’activité d’extraction de pétrole et de gaz sur la survie des nids de canards. À l’aide d’estimations de la densité des nids corrigées pour la survie, nous avons constaté des densités plus élevées de nids plus près des routes, mais les densités de nids étaient plus faibles dans les sites entourés d’un plus grand nombre de puits. Notre modèle le mieux classé prédisait que la densité des nids est 14 % plus faible à ces sites par rapport aux sites sans développement, étant donné le nombre moyen de puits (3,15 puits) situés à moins de 1500 m d’un site. Cependant, dans un champ pétrolier/gazier où la nidification avait lieu, nous n’avons trouvé aucune preuve que les canards évitaient les infrastructures associées aux hydrocarbures à de plus petites échelles spatiales. Nos résultats indiquent des effets mitigés de l’exploitation pétrolière et gazière sur la sauvagine nicheuse, et mettent en évidence à la fois la résilience des canards à l’évolution de l’environnement et la nécessité de recherches supplémentaires sur d’autres aspects de la biologie de reproduction des canards.
INTRODUCTION
The United States is now the largest producer of crude oil in the world, an ascendancy driven by the development of unconventional sources (i.e. shale oil) in the lower 48 states (U.S. Energy Information Administration 2019a). Among the most productive regions is the Bakken shale formation in northwestern North Dakota, where coincident advances in hydraulic fracturing technology and high oil prices stimulated rapid and extensive oil and gas development that began in 2008 (Rapier 2017). Between 2008 and 2014, oil production in North Dakota increased from ~4,200 wells producing ~172,000 barrels per day to ~12,500 wells producing ~1,088,000 barrels per day (North Dakota Industrial Commission 2017), and continued growth is anticipated through at least 2040 (U.S. Energy Information Administration 2019b).
The Bakken formation overlaps with the Prairie Pothole Region, which provides critical breeding habitat for grassland-nesting songbirds, shorebirds, upland game birds, and ducks (U.S. Fish and Wildlife Service 2012, Dyke et al. 2015). Given that shale oil development has already resulted in the conversion of >1,000,000 ha of grassland over the past decade (Allred et al. 2015), including ~13,000 ha in northwestern North Dakota (Preston and Kim 2016), there is significant concern about the effects of shale oil extraction on breeding birds. Oil and gas activity can potentially negatively affect bird populations through a variety of mechanisms (Northrup and Wittemyer 2012, Souther et al. 2014). Adult birds may be subject to direct mortality from vehicle collisions, oil and brine containment ponds, and hydrogen sulfide poisoning (Dyke et al. 2010), and nests can be destroyed when areas are cleared for new infrastructure (Van Wilgenburg et al. 2013). The subsequent habitat loss, fragmentation (Bayne and Dale 2011, Bohannon 2017, Bohannon and Blinnikov 2019), and degradation (Kleist et al. 2016, Shaffer et al. 2019) in turn causes some (but not all) species of songbirds (Gilbert and Chalfoun 2011, Thompson et al. 2015, Bohannon 2017, Nenninger and Koper 2018, Farwell et al. 2019), grouse (Doherty et al. 2008, Fritz 2011), and shorebirds (Troy 2000) to avoid developed areas. Other hazards include contaminant spills (Lauer et al. 2016) that threaten upland vegetation (Halvorson and Lang 1989), wetlands (Entrekin et al. 2011, Vidic et al. 2013, Burton et al. 2014), and their invertebrate communities (Preston et al. 2018) that provide the forage base for songbirds and waterfowl. The expansion of oil and gas activity can also increase road traffic, which may have a number of deleterious effects including direct animal mortality, behavioral modification (e.g., avoidance), and increased dust, chemical, auditory, and visual pollution (reviewed in Trombulak and Frissell 2000). Road infrastructure therefore has the potential to reduce density and survival of bird nests (Reijnen et al. 1996, Fahrig and Rytwinski 2009), but can also reduce density and survival of nest predators (Fahrig and Rytwinski 2009, Barthelmess and Brooks 2010), so aggregate effects are unpredictable.
Long-term data on Greater Sage-Grouse (Centrocercus urophasianus) from the sagebrush steppe of Wyoming show that oil and gas infrastructure has negatively affected populations (Kirol et al. 2015). This conclusion parallels work by Hethcoat and Chalfoun (2015) in the same area, who reported reduced songbird nest survival with increased oil development, which they attribute to increases in rodent nest predators in altered habitats. Frantz et al. (2018) also documented a decline in nest success of Louisiana Waterthrush (Parkesia motacilla) populations in forested landscapes in West Virginia with the expansion of fracking activity. However, Bentzen et al. (2017) found no effect of Arctic oil and gas infrastructure on shorebird nest survival. Burr et al. (2017) found that Sharp-tailed Grouse (Tympanuchus phasianellus) nest survival nearly doubled in areas of intense development in the grasslands of the Bakken, likely because important mammalian nest predators were 6.9 times more likely to be found in areas with minimal oil and gas development.
While we have learned a great deal about the impact of oil and gas development on songbirds and grouse, effects on breeding ducks are poorly known. This research need is particularly pressing because the overlap of the Bakken formation and the Prairie Pothole Region in the United States alone has the potential to impact an estimated 1 million breeding duck pairs (Reynolds et al. 2006, Loesch et al. 2012). Ludlow and Davis (2018) analyzed data collected from 138 duck nests located near oil and gas infrastructure in prairie Canada, and found some evidence that nests were actually placed closer to wells and roads than expected by chance, which they attributed to fast-growing nonnative grasses that provided attractive nesting habitat near infrastructure. They found no effect of oil and gas development on nest survival, despite the fact that duck nests are subject to the same suite of mammalian predators (Greenwood et al. 1995) researched by Burr et al. (2017). However, Ludlow and Davis (2018) cautioned that inferences were limited by small sample sizes, and additional research is needed to fully understand the impact of oil and gas development on nesting waterfowl.
To address this knowledge gap, we undertook a large-scale, 3-yr monitoring study of duck nests in the Bakken region of North Dakota. Nest survival is a major limiting factor for duck populations (Hoekman et al. 2002), so our primary goal was to evaluate how the extent and intensity of oil and gas development affected duck nest success. However, given conflicting evidence of infrastructure avoidance across bird species, we also evaluated the relationship between oil and gas extraction and nest density. At a landscape scale, we used survival-corrected estimates of nest density at our sites, which spanned a gradient of development to assess variation in duck nesting patterns, and at a local scale, we tested for nonrandom nest placement with respect to roads and oil and gas wells.
METHODS
Study Area and Site Selection
Out study took place where the Bakken shale formation overlaps the U.S. portion of the Prairie Pothole Region, north of the Missouri River and west of the Souris River in northwestern North Dakota (Figure 1). This region is part of the Northwestern Glaciated Plains ecoregion (primarily Missouri Coteau), characterized by shallow depressional wetlands interspersed with remnant and restored grassland, and grain and row crop agriculture. Study site selection was based on a larger collaborative project that also evaluated breeding duck pair abundance and brood abundance on wetlands (Kemink et al. 2019). We randomly selected 10.36 km2 (4 mi2) study sites, commensurate with breeding waterfowl pair surveys used to assess interactions with habitat (Cowardin et al. 1995) but required those to contain ≥47% perennial cover (Stephens et al. 2005) and ≥100 wetland basins (as denoted by the National Wetlands Inventory) to minimize environmental variation and ensure adequate sample sizes of nests. To characterize oil and gas activity within these sites, we enumerated the number of well pads within 10.36 km2 of each wetland basin on the site (simple circular buffer). We did not categorize individual well pads based on their potential attractiveness to nest predators (sensu Liebezeit et al. 2009). Based on the number of well pads within 10.36 km2 at the majority of wetland basins, we parsed sites into 4 categories: control (0 well pads), low development (1 well pad), medium development (2–3 well pads), and high development (>3 well pads). For example, if most wetland basins had 3 wells within 10.36 km2, that site was designated medium development. We targeted 7 sites in each development category (as an example, 2017 sites are shown in Appendix Figure 4) that were adjacent to plots where pair and brood studies took place, but actual sample sizes varied with landowner permission (Table 1). Sample stratification by development category was designed to appropriately allocate sampling effort across a gradient of oil and gas development, and we calculated continuous metrics of oil and gas development for our data analyses.
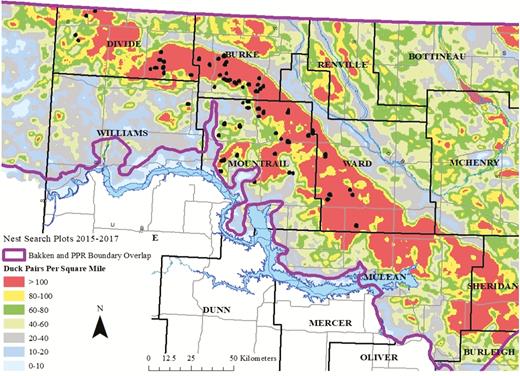
Study sites (black dots) for duck nesting research in North Dakota, USA, 2015–2017, in relation to long-term average breeding waterfowl pair densities in the Bakken region. Duck pair accessibility data were obtained from the Habitat and Population Evaluation Team (U.S. Fish and Wildlife Service) derived from models similar to Reynolds et al. (2006).
Results of systematic duck nest searches of native grassland and United States Department of Agriculture Conservation Reserve Program planted cover conducted in northwestern North Dakota, 2015–2017. Reps refers to the number of 32-ha replicates in each category, and hectares refers to the total area searched. Categories are as follows: control (0 well pads), low development (1 well pad), medium development (2–3 well pads), and high development (>3 well pads) within 10.36 km2.
| 2015 | 2016 | 2017 | ||||||||||
|---|---|---|---|---|---|---|---|---|---|---|---|---|
| Category | Sites | Reps | Nests | Hectares | Sites | Reps | Nests | Hectares | Sites | Reps | Nests | Hectares |
| Control | 7 | 23 | 498 | 858 | 8 | 23 | 333 | 879 | 6 | 18 | 254 | 661 |
| Low | 6 | 13 | 268 | 426 | 7 | 15 | 209 | 519 | 7 | 18 | 341 | 630 |
| Medium | 8 | 20 | 532 | 582 | 9 | 22 | 455 | 708 | 10 | 26 | 625 | 875 |
| High | 8 | 22 | 484 | 728 | 13 | 31 | 392 | 1,004 | 11 | 24 | 383 | 787 |
| Total | 29 | 78 | 1,782 | 2,594 | 37 | 91 | 1,389 | 3,110 | 34 | 86 | 1,603 | 2,953 |
Data Collection
We searched for upland duck nests on at least two 32-ha grassland parcels (hereafter, replicates) at each of our sites during peak nesting season (late April–early July) in 2015, 2016, and 2017. Replicates were opportunistically selected based on cover type (grassland) and landowner permission. We systematically searched for nests between 0800 and 1500 hours (Gloutney et al. 1993) by pulling a ~60 m steel chain between 2 slow-moving all-terrain vehicles, which flushed the incubating female from the nest when it passed over her (Klett et al. 1986). Once a nest was located, we flagged the vegetation 4 m north of the nest bowl (Hein and Hein 1996) and recorded vegetation density at the nest (Robel et al. 1970). Briefly, we marked 2.5-cm increments on a 1.5-m stake and placed it at the nest bowl; we recorded the lowest unobscured marking visible from 3.7 m away, as viewed from 0.9 m above the ground from each of the 4 cardinal directions and averaged them (Robel et al. 1970). We recorded vegetation during the initial nest visit to minimize bias that can arise if vegetation is measured at different times for hatched vs. depredated nests (Ringelman and Skaggs 2019). Nests were identified to species and the eggs were counted and candled to determine incubation stage (Weller 1956) and clutch initiation date. Nest locations were recorded on a global positioning system receiver and revisited every 5–7 days on foot or during subsequent search efforts to determine nest fate. Predation is the primary cause of nest failure in dabbling ducks in the Prairie Pothole Region (Cowardin et al. 1985, Klett et al. 1988, Greenwood et al. 1995, Walker et al. 2013, Skone et al. 2016, Ringelman et al. 2018) and lethally removing predators from an area has been shown to increase nest success (Garrettson and Rohwer 2001, Pieron and Rohwer 2010). The primary predators in our geography are mesocarnivores, including skunks (Mephitis mephitis), American badgers (Taxidea taxus), raccoons (Procyon lotor), and red foxes (Vulpes vulpes) (Greenwood et al. 1995, Larivière and Messier 2000, Phillips et al. 2003). Predation events were identified by either missing eggs, or by the presence of eggs fragments with attached membranes. Nests were considered successful if ≥1 egg hatched (Klett et al. 1986, Ringelman et al. 2018), as determined by the presence of intact egg membranes. For the nest survival analysis, we censored nests that were influenced by investigator activity or other factors (e.g., destroyed by farm equipment or prescribed burns), including those nests that were found abandoned on our first return visit, and nests where fate could not be conclusively determined.
Model Covariates
We used year-specific, county-level monthly oil and gas production reports (April–August) from the North Dakota Industrial Commission to estimate the number of active wells (North Dakota Industrial Commission 2018) surrounding our study sites. Wells were predominately new infrastructure established since the rapid expansion of hydraulic fracturing began in 2008. We wanted to diagnose at what spatial scale effects of oil and gas activity might emerge; to accomplish this, we created a set of 500-m buffers around each nest in a geographic information system. The smallest buffer was a circle with radius 500 m, the next was a circle with radius 1,000 m, and our largest was a 4,000 m buffer. Then, within each buffered distance, we tallied the number of active wells. Furthermore, because biological responses to oil and gas development may emerge as a function of aggregate landscape-scale changes (Kirol et al. 2015, Thompson et al. 2015), we created a spatially continuous quantitative map of development intensity. That is, we wanted to determine whether, at a landscape scale, ducks were responding to core areas of intense oil and gas development. For each year of the study, we buffered 8.05 km from each nest (which contains the home range of a nesting Mallard [Cowardin et al. 1985]) and connected the outermost edges of the aggregate buffer using a minimum convex polygon to define our sampling geography. Within that polygon, we used the adehabitat package in program R 3.5.0 to create a landscape-level kernel density estimate (reference bandwidth) of active well density, and separated this into 10% isopleths (see example in Appendix Figure 5), such that each individual nest was associated with the minimum isopleth of oil and gas development (because, for example, points in the 80th percentile isopleth also fall within the 90th percentile isopleth, and smaller isopleths are associated with a higher density of wells). Finally, for each nest we quantified the distance (m) to the nearest active well, secondary road (paved or gravel), and paved highway (“major road”), which has been shown to affect nest survival (Roy 2018). Road data was acquired from the North Dakota Department of Transportation.
In our nest survival and nest density analysis, we also included covariates calculated at the site level (the 10.36 km2 area surrounding the centroid of our replicates at a site). We calculated 2 habitat metrics known to influence waterfowl nesting ecology: the number of wetland basins and percent grassland cover (Stephens et al. 2005, Ringelman et al. 2018). Upland habitat data was obtained from the U.S. Fish and Wildlife Service Habitat and Population Evaluation Team and included their 2011 landcover data (Boryan et al. 2012), the 2016 U.S. Department of Agriculture cultivated land layer, and U.S. Department of Agriculture Conservation Reserve Program data. Wetland basin data was derived from the U.S. Fish and Wildlife Service National Wetlands Inventory. In our nest density analysis, we also quantified oil and gas production metrics that might influence waterfowl or their predators through visual or auditory disturbance: the total number of days wells produced and the total amount of natural gas flared (in millions of cubic feet, April–August; North Dakota Industrial Commission 2018). These metrics were also calculated at the site level.
Nest Survival Analysis
We conducted nest survival analyses (Dinsmore et al. 2002) in program MARK (White and Burnham 1999) accessed through the RMark package (Laake 2013) and modeled daily survival rate (DSR) as a function of each covariate. MARK estimates the fate date as the midpoint between the last time the nest was known to be alive (“last present”) and the date when the nest was checked and found to be terminated (“last checked”). While this is reasonable for depredated nests when the true fate date is unknown, hatch date for waterfowl is estimable based on candling eggs in the field; therefore, we estimated the hatch date for successful nests based on the last incubation stage recorded (Klett et al. 1986) and fixed this as our date for both last present and last checked to avoid incorrectly estimating exposure days. To summarize nest success across species and years, we raised the daily survival rate to the power of the estimated age of the nest at hatching (Klett et al. 1986).
We combined all three years of data and first modeled DSR as a function of biological and ecological variables known to be important predictors of nest survival (Ringelman et al. 2018): nest age when found, nest initiation date, species, year, Robel measurement at the nest, and the number of basins and percent grassland at each site. We evaluated all additive combinations of parameters and ranked models based on AICc scores (Burnham and Anderson 2002) to identify our top biological model. Under the principle of parsimony, we selected the simplest model within 2 AICc units of the top-ranked model. We then sequentially examined oil and gas extraction covariates and road covariates to determine if they each individually improved model fit. Our covariates were number of wells within buffers 500–4,000 m, distance to nearest well, development isopleth, days of production, total gas flared, and distances to secondary roads and major roads. After identifying individual covariates that improved model fit, we evaluated additive combinations of those variables to our biological model to construct a final model set.
Nest Density Analyses
We evaluated oil and gas effects on nest placement at 2 spatial scales to determine whether (1) nest density varied across sites and levels of development, and (2) whether nests were placed nonrandomly within a replicate in relation to oil and gas infrastructure. To determine the density of duck nests at the site level, we calculated survival-corrected nest density within each replicate. Because the sum of exposure days was <750 at the replicate scale (Ringelman et al. 2017), we calculated nest density following Arnold et al. (2007) where:
We then summed estimated nests for each replicate in a site and divided by the total area searched. We used linear regression with a Gaussian error structure to diagnose how nest density varied with percent grassland, the number of basins, and the same oil and gas development metrics used in the nest survival analysis, except here they were calculated from the centroid of each replicate (instead of from each nest as in the nest survival analysis). We evaluated several procedures to construct model sets, and all yielded the same results. Instead of manually constructing hundreds of model sets making sure to not include highly correlated variables in the same model, we opted to evaluate all linear combinations of all parameters (a global model combination; Ringelman et al. 2018), and simply disregard models containing highly correlated terms. We used AICc for model selection.
To determine if nests were placed nonrandomly within a replicate (typically ~800 m long and ~400 m wide) with respect to oil and gas infrastructure, we generated a paired set of simulated nests (Fritz 2011) in ArcGIS 10.5 using the create random points tool. For both real and simulated nests, we calculated the distance to the oil well, nearest major road, or nearest secondary road disturbance metrics. For each separate analysis of these 3 variables, we only included replicates where the maximum distance from infrastructure to the nearest real nest was <1,000 m, commensurate with the scale of this analysis. That is, we did not want to include replicates nowhere near oil wells and have long distances skew the analysis, because we were interested in testing within-replicate avoidance. We paired each real nest with a simulated nest, representing a potential nest-site selection decision, and used paired t-tests to determine if real nests were placed nonrandomly within a replicate. We included real nests influenced by investigators and those with unknown fates because those still represented nest-site selection decisions. We excluded a small number of nests for which location data were not recorded or that were later revealed to be outside of replicate boundaries. All analyses were conducted in program R 3.5.0 (R Core Team 2018) and we present means ± standard error and 85% confidence intervals appropriate for AIC-based modeling approaches (Arnold 2010).
RESULTS
During 2015–2017, we searched for duck nests on a total of 8,657 ha across 5 counties in North Dakota and found a total of 4,774 nests (Table 1). Blue-winged Teal (Spatula discors; n = 1,424), Gadwall (Mareca strepera; n = 1,114), and Mallard (Anas platyrhynchos; n = 1,043) accounted for 75% of nests found. Other species included Northern Shoveler (S. clypeata; n = 403), Northern Pintail (A. acuta; n = 373), Lesser Scaup (Aythya affinis; n = 210), American Wigeon (M. americana; n = 156), and Green-winged Teal (Anas crecca; n = 45). We excluded Canvasback (Aythya valisineria; n = 3) and Redhead (A. americana; n = 3) nests found incidentally because those species do not typically nest in upland habitats.
Nest Survival Analysis
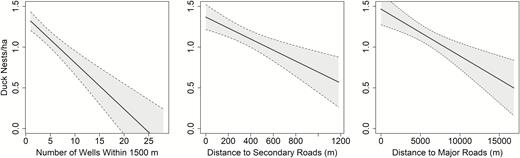
We included 3,979 nests in our survival analysis; 89% of nest failures were definitively caused by predators. Our top-ranked biological model included factor variables for species and year, age of the nest when found, and the number of wetland basins and percent grass at the site level (Table 2). Under the principle of parsimony, we selected the simpler parameter set as our best biological model (Table 2). Several oil and gas development variables individually improved model fit relative to our baseline biological model, so we then evaluated linear combinations of major roads, secondary roads, oil and gas development isopleth, and the number of wells within 1,500 m with our biological variables. Our most parsimonious model was the top biological model with the addition of major roads and development isopleth (Table 3). Parameter estimates from the top model indicated that survival rates were higher for nests that were found closer to hatching, and those located in sites with a higher percentage of grassland (Table 4, Figure 2). Nest survival was notably higher in 2017 than in other years. Nest survival varied weakly by species; despite all individual species coefficients bounding zero, removing the species factor from the model resulted in ΔAICc = 35.68, indicating that inclusion of species substantially improved model fit. Across species and years, estimated nest success ranged from 10% (Mallards in 2016) to 27% (American Wigeons in 2017) (Table 5). Finally, nest survival decreased as distance relative to the nearest major road increased (Table 4, Figure 2).

Significant covariate effects from the top-ranked model of duck nest survival for nests monitored in North Dakota, USA, 2015–2017. Species and years were pooled for ease of visual representation. Covariates not appearing on the axes were held at the mean, and 85% confidence intervals are shown.
Model selection evaluating the effect of biological and ecological covariates on duck nest survival, using data collected from duck nests in northwestern North Dakota, USA, 2015–2017. Our most parsimonious model is shown in bold. k = number of parameters and wi = Akaike weight.
| Parameters | k | Deviance | AICc | ΔAICc | wi |
|---|---|---|---|---|---|
| Age Found + Basins + Percent Grass + Species + Year | 13 | 10032.2 | 10058.2 | 0.00 | 0.23 |
| Age Found + Basins + Percent Grass + Robel + Species + Year | 14 | 10030.5 | 10058.5 | 0.31 | 0.19 |
| Age Found + Basins + Initiation Date + Percent Grass + Robel + Species + Year | 15 | 10029.4 | 10059.4 | 1.19 | 0.13 |
| Age Found + Percent Grass + Species + Year | 12 | 10035.7 | 10059.7 | 1.51 | 0.11 |
| Age Found + Basins + Initiation Date + Percent Grass + Species + Year | 14 | 10031.8 | 10059.8 | 1.63 | 0.10 |
| Age Found + Percent Grass + Robel + Species + Year | 13 | 10033.9 | 10059.9 | 1.75 | 0.10 |
| Age Found + Initiation Date + Percent Grass + Robel + Species + Year | 14 | 10033.1 | 10061.1 | 2.89 | 0.05 |
| Age Found + Initiation Date + Percent Grass + Species + Year | 13 | 10035.5 | 10061.5 | 3.29 | 0.04 |
| Basins + Initiation Date + Percent Grass + Robel + Species + Year | 14 | 10035.8 | 10063.8 | 5.61 | 0.01 |
Model selection evaluating the effect of adding oil and gas covariates to a baseline ecological model of duck nest survival (Age Found + Percent Grass + Species + Year), derived using data collected from duck nests in northwestern North Dakota, USA, 2015–2017. Our most parsimonious model is shown in bold. k = number of parameters and wi = Akaike weight.
| Parameters | k | Deviance | AICc | ΔAICc | wi |
|---|---|---|---|---|---|
| + Isopleth + Distance to Major Road | 14 | 10020.5 | 10048.5 | 0.00 | 0.23 |
| + Distance to Major Road | 13 | 10023.0 | 10049.0 | 0.48 | 0.18 |
| + Wells within 1500 m + Distance to Major Road | 14 | 10021.9 | 10049.9 | 1.44 | 0.11 |
| + Isopleth + Wells within 1500 m + Distance to Major Road | 15 | 10020.4 | 10050.4 | 1.88 | 0.09 |
| + Isopleth + Distance to Secondary Road + Distance to Major Road | 15 | 10020.5 | 10050.5 | 1.98 | 0.09 |
| + Distance to County Road + Distance to Major Road | 14 | 10022.9 | 10050.9 | 2.39 | 0.07 |
| + Wells within 1500 m + Distance to Secondary Road + Distance to Major Road | 15 | 10021.8 | 10051.8 | 3.34 | 0.04 |
| BASELINE | 12 | 10035.7 | 10059.7 | 11.19 | 0.00 |
Parameter estimates from the top-ranked model of duck nest survival, where daily survival rate was modeled as a function of nest age when found, species, year, percent grass at the site, and distance to major roads. Factor variables species and year are shown relative to Green-winged Teal and 2015, respectively, which were fixed at zero. Species abbreviations are as follows: Blue-winged Teal (BWTE), Northern Shoveler (NSHO), Gadwall (GADW), American Wigeon (AMWI), Mallard (MALL), Northern Pintail (NOPI), Lesser Scaup (LESC).
| Parameter | Estimate | 85% CI |
|---|---|---|
| Intercept | 2.53984 | 2.18148 to 2.89820 |
| Age found | 0.01053 | 0.00493 to 0.01614 |
| Percent grass | 0.60263 | 0.31389 to 0.89137 |
| Distance to major roads | −0.00002 | −0.00003 to −0.00001 |
| Species – BWTE | 0.11985 | −0.17294 to 0.41264 |
| Species – NSHO | 0.10952 | −0.19781 to 0.41684 |
| Species – GADW | 0.05111 | −0.24357 to 0.34578 |
| Species – AMWI | 0.13466 | −0.20202 to 0.47133 |
| Species – MALL | −0.23244 | −0.52690 to 0.06203 |
| Species – NOPI | −0.19269 | −0.50074 to 0.11535 |
| Species – LESC | −0.21421 | −0.53368 to 0.10527 |
| Year – 2016 | −0.07145 | −0.14609 to 0.00320 |
| Year – 2017 | 0.11373 | 0.03824 to 0.18921 |
Nest success estimates from the top-ranked model of nest survival, which included factor variables of species and year. Following Klett et al. (1986), age of the nest at hatching was assumed to be 35 days for Mallard, Gadwall, and Lesser Scaup, 34 days for Blue-winged Teal and Northern Shoveler, 33 days for American Wigeon and Green-winged Teal, and 32 days for Northern Pintail, and we calculated nest success from the daily survival rate.
| 2015 | 2016 | 2017 | ||||
|---|---|---|---|---|---|---|
| Species | Nests | Nest success | Nests | Nest success | Nests | Nest success |
| Green-winged Teal | 16 | 19.2% | 11 | 17.1% | 13 | 22.8% |
| American Wigeon | 59 | 23.5% | 38 | 21.2% | 35 | 27.4% |
| Blue-winged Teal | 439 | 22.0% | 329 | 19.8% | 373 | 25.9% |
| Gadwall | 257 | 18.9% | 374 | 16.8% | 371 | 22.5% |
| Lesser Scaup | 27 | 11.6% | 56 | 9.9% | 88 | 14.5% |
| Mallard | 300 | 11.2% | 250 | 9.5% | 310 | 14.0% |
| Northern Pintail | 119 | 14.5% | 91 | 12.6% | 87 | 17.8% |
| Northern Shoveler | 113 | 21.7% | 95 | 19.4% | 128 | 25.5% |
Nest Density Analysis
We included 4,587 nests in our site-level density analysis. To avoid pooling the variance and to diagnose the relative importance of highly correlated terms, we ranked models from all linear combinations of a global model that included 16 terms (Appendix Table 6). There was considerable model uncertainty because many of our variables were highly correlated (e.g., wells within 1,500 m highly correlated with wells within 2,000 m). Our top-ranked model was simpler than all other models with ΔAICc < 2, and indicated nest density was lower farther from major roads (β = −0.00006 ± 0.00002) and secondary roads (β = −0.00067 ± 0.00024), and there was a strong negative effect of the number of wells within 1,500 m on nest density (β = −0.05685 ± 0.01282; Figure 3). At the mean number of wells within 1,500 m of the replicate centroid (µ = 3.15 wells), our top model predicted nest density to decline 14% from 1.32 nests ha−1 to 1.14 nests ha−1 relative to sites with no oil and gas development. This negative effect was most pronounced in the 1,500-m distance buffer, but negative effects were similar for other distance buffers (Appendix Table 7), supporting the inference that oil and gas development was associated with lower nest density at the site level.
Covariate effects from the top-ranked model of duck nest density (site-level) for nests monitored in North Dakota, USA, 2015–2017. Covariates not appearing on the axes were held at the mean, and 85% confidence intervals are shown.
When we compared the spatial distribution of real nests and randomly generated nests within replicates with respect to nearby oil and gas infrastructure, we found little biologically meaningful evidence of nonrandom placement within a field (means and standard deviations shown here). Distance to the nearest well (56 replicates, 1,890 nest pairs) was similar for real (µ = 880 ± 415 m) and simulated (µ = 873 ± 404 m) nests (t = 0.98, P = 0.32). There was no difference in distance to the nearest major road (17 replicates, 1,266 nests) between real (µ = 450 ± 404 m) and simulated (µ = 457 ± 346 m) nests (t = −1.07, P = 0.29). And while we found a difference between the distance to secondary roads (110 replicates, 4,499 nests) for real (µ = 431 ± 325 m) and simulated (µ = 441 ± 328 m) nests (t = −2.50, P = 0.01), that result is likely a statistical artifact of a large paired sample, with little biological relevance. Indeed, results for distance to secondary roads became nonsignificant when we subsampled the data to sample sizes commensurate with the other 2 analyses.
DISCUSSION
This study is the first large-scale evaluation of the impact of unconventional oil and gas development on duck nesting ecology, and took place against a backdrop of historic duck abundance (U.S. Fish and Wildlife Service 2018), and the first crest of the oil and gas boom in North Dakota (North Dakota Industrial Commission 2017). In our analysis of nest survival, we found a strong positive landscape-level effect of percent grassland (see also Stephens et al. 2005, Ringelman et al. 2017) but only a weak effect of number of wetland basins, perhaps because we constrained our sites to those with abundant wetlands. Survival varied by species, and paralleled the results of Ringelman et al. (2017) where survival of Blue-winged Teal nests was higher than for Gadwall nests, which was higher than for Mallard nests (Table 5). It is also worthwhile to note that in all years, nest success for Mallards was below the 15% required to sustain populations (Cowardin et al. 1985). Unlike previous studies (Flint and Grand 1996, Grant et al. 2005, Arnold et al. 2007, Raquel et al. 2015), we detected no overall seasonal effect on nest survival, but emerging research suggests seasonal survival effects can interact with nest density and obfuscate that relationship (Ringelman et al. 2018).
We found no relationship between any metric of oil and gas development and production and duck nest survival. This was surprising given that Burr et al. (2017) conducted their research in the same counties in North Dakota and found a reduction in terrestrial nest predator abundance in heavily developed regions of the Bakken. While we did not measure predator abundance directly, prairie mesocarnivores are tolerant of disturbance and readily use human structures (e.g., Larivière and Messier 1998), so it is possible that predator densities may have equilibrated across the landscape between Burr et al.’s 2012–2013 study and our study conducted in 2015–2017. Indeed, our observations in the field suggest that the downturn in oil prices in 2016 limited active fracking of new wells, so intensity of extraction activity was likely higher before 2016.
Nests closer to major roads had higher survival rates, and post hoc analyses confirmed that this was not merely a site effect. One hypothesis is that because road kill is a primary source of mortality for many carnivores and is often actively avoided (Fahrig and Rytwinski 2009, Barthelmess and Brooks 2010, Červinka et al. 2015), duck nests near major roads may be relatively safe from mammalian predation. Indeed, Roy (2018) found Ring-necked Ducks (Aythya collaris) nesting closer to roads had higher nest survival, and the effect was stronger for paved roads. However, while we did not parse roads by surface type, many of our secondary roads were paved, and distance to secondary road was not an important driver of nest success. Roy (2018) found road effects extending to ~1 km, but we found a positive effect of major roads that persisted for many kilometers—seemingly farther than direct predator road mortality can explain—which is perhaps suggestive of landscape-scale differences in predator space use near highways. We did not quantify traffic intensity or vehicle types on major highways, so it is difficult to determine how oil and gas activity may have contributed to effects of roads. Major paved highways have been part of the landscape for many decades, and without being able to compare effects before and after the expansion of oil and development, it is difficult to attribute road effects to oil and gas extraction.
At the site level, we found that sites closer to major roads and secondary roads supported higher nest densities. Oetting and Cassel (1971) also found that ducks commonly nested in robust vegetation near roads in North Dakota. This could be evidence of adaptive habitat selection if indeed those sites had lower populations of predators as suggested by our survival analysis. Nevertheless, nest-site selection in ducks is multifaceted (reviewed in Eicholz and Elmberg 2014), and may or may not be adaptive with respect to predation risk (Clark and Shutler 1999, Ringelman et al. 2014, 2017). We found evidence that sites with more wells surrounding them supported lower nest densities. Our top model indicated that the number of wells within 1,500 m provided the best fit to the data, but replacing that distance with other buffers yielded similar effect sizes (which are deflated in the model-averaged coefficients presented in Appendix Table 7). This scale of avoidance is consistent with the scale of territory establishment and home ranges of nesting ducks (~7 km2; Johnson 1980, Cowardin et al. 1995, Eicholz and Elmberg 2014). When ducks are selecting home ranges, they tend to settle at sites with abundant wetlands and grassland (Krapu et al. 1997, Reynolds et al. 2006); however, neither of those variables appeared in our top models of nest density, which suggests perhaps our sites met some threshold of habitat suitability, and variation above that threshold was unimportant. Nevertheless, we found that on our sites, the presence of oil and gas infrastructure within 1,500 m was associated with a 14% decline in nest density at average well density (3.15 wells). We can only speculate as to why duck nest density was lower at highly developed sites: it may be as simple as ducks seeing industrial infrastructure and choosing to nest somewhere else, or something more nuanced about wetland quality for egg-producing females and future broods (Entrekin et al. 2011, Vidic et al. 2013, Vengosh et al. 2014, Preston et al. 2018). A critical analysis of associated duck pair count data is forthcoming, and will be essential for determining whether nest density was driven by displacement of breeding pairs upon arrival to the area, or nest-site choices made by individual hens.
Studies conducted on grouse and songbirds have found local area avoidance of oil and gas infrastructure, a pattern consistent in sagebrush steppe (Doherty et al. 2008, Gilbert and Chalfoun 2011), forest (Barton et al. 2016), prairie grassland (Thompson et al. 2015), and the Arctic (Troy 2000). However, the only study on ducks demonstrated nonrandom nest placement closer to wells (and roads) because disturbed areas were associated with tall nonnative grasses attractive to upland-nesting ducks (Ludlow and Davis 2018). In contrast, we found no evidence of nonrandom nest placement in relation to oil and gas wells within our replicates. Ludlow and Davis (2018) found >60% of their nests within 300 m of wells, but their maximum distance only extended to 1,500 m. In contrast, <5% of our nests were within 300 m of wells, with average distance exceeding 1,500 m (mean = 1,536 m, median = 3,715 m). Evidently, the scales at which we analyzed within-replicate avoidance were associated with greater dispersion of wells, making highly localized attraction or avoidance difficult to evaluate, despite limiting our analysis to replicates where the maximum distance from well infrastructure to the nearest nest was <1,000 m. (We required that the distance between infrastructure and the nest nearest in a replicate be <1,000 m. So while that nearest nest may have been 950 m away from infrastructure, all of the other nests in the field would be farther from the infrastructure, usually resulting in distances >1,000 m.)
We focused only on duck nesting ecology, but oil and gas development may affect breeding waterfowl in other ways (e.g., displacement of pairs or a reduction in brood survival). Our results suggest that nesting ducks may be avoiding areas with high densities of oil and gas wells, and a forthcoming analysis of pair count data would confirm avoidance of wells when ducks are establishing territories. And while nest survival appears to be unaffected by current levels of oil and gas development, that places additional scrutiny on brood survival as a driver of breeding success (Hoekman et al. 2002, Amundson et al. 2013). For pairs and broods, potential drainage (Dyke et al. 2010), contamination (Preston et al. 2018), and degradation of wetlands (Creuzer et al. 2016) as a result of oil and gas development is of particular concern. Louisiana Waterthrushes accumulated metals associated with fracking (i.e. barium and strontium) in West Virginia, Pennsylvania, and Arkansas (Latta et al. 2015), indicating a potential concern for chronic nonlethal effects; contaminant accumulation may be of particular concern in species like ducks that are harvested and consumed by hunters, but there have been no studies conducted in waterfowl.
In summary, we have only just begun to understand the effects of oil and gas extraction on breeding ducks, and more research is needed, especially where shale oil formations overlay important waterfowl breeding habitats. Nevertheless, the northern portion of the Missouri Coteau in North Dakota, USA, is rich with wetland and grassland resources, and continues to produce ducks even in the presence of oil and gas infrastructure (Kemink et al. 2019). Thus, conservation of these landscapes should continue (e.g., through wetland and grassland conservation easements), with a recognition that parcels farther from oil and gas infrastructure may support higher duck nest densities.
ACKNOWLEDGMENTS
We thank T. Ronnigen and the numerous technicians who collected data in the field. The findings and conclusions of this article are those of the author(s) and do not necessarily represent the views of the U.S. Fish and Wildlife Service.
Funding statement: This work was supported by the North Dakota Game and Fish Department (funded in part by U.S. Fish and Wildlife Service Pittman-Robertson Wildlife Restoration Act [CDFA# 15.611]), National Institute of Food and Agriculture, U.S. Department of Agriculture, McIntire Stennis project LAB94294, Delta Waterfowl Foundation, U.S. Fish and Wildlife Service, and the LSU AgCenter. Field housing was provided by North Dakota Game and Fish Department (Williston office), Upper Souris National Wildlife Refuge, Lostwood National Wildlife Refuge, and Audubon National Wildlife Refuge.
Ethics statement: All field work was completed under Louisiana State University Institutional Animal Care and Use permit #15–017, USFWS Special Use permit #2015-079M, and North Dakota collecting permits GNF03793985, GNF04051987, and GNF04337699.
Author contributions: All authors contributed to study design; MLS, FCR, and KMR acquired the funding with in-kind support from CRL; CGS supervised data collection in the field; KMR and CGS analyzed the data; KMR and CGS wrote the manuscript; and all authors reviewed and edited drafts.
Data depository: Analyses reported in this article can be reproduced using the data provided by Skaggs et al. (2020).
APPENDIX
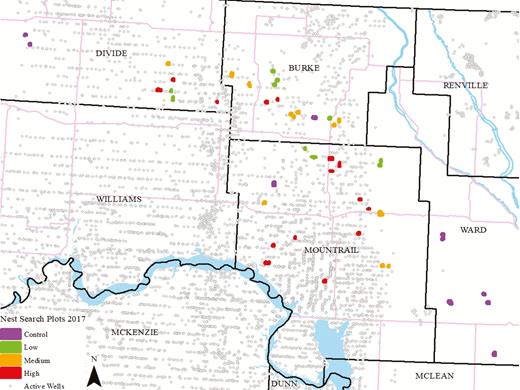
Study sites (enlarged for visibility) where duck nests were monitored in northwestern North Dakota, USA, in 2017. Intensity categories were calculated based on the number of well pads within 10.36 km2 of the majority of wetland basins at the site (control = 0; low = 1; medium = 2–3; high > 3). Study sites were similar each year. However, minor changes in replicate locations were the result of landowner access changes.
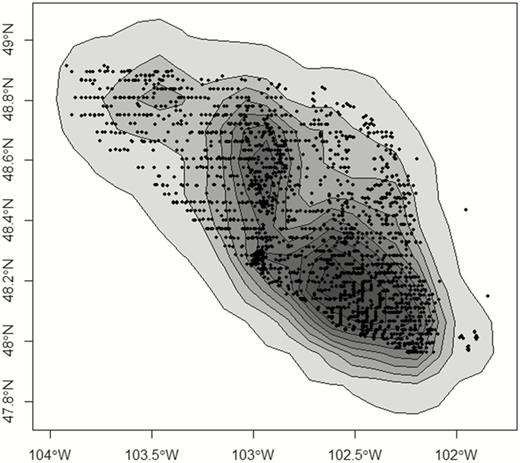
Isopleths from a kernel density estimate (reference bandwidth) of active wells (black dots) where duck nests were monitored in northwestern North Dakota, USA, in 2017. Each duck nest was associated with the minimum isopleth (maximum development intensity) as a spatially continuous metric of landscape-level oil and gas development. Isopleths were developed for each of the study years.
Model selection evaluating the effects of biological variables and oil and gas development covariates on survival-corrected duck nest density calculated at the site level. Data were collected from duck nests in northwestern North Dakota, USA, 2015–2017. Models within 2 AICc of the top model are shown, along with the global model.
| Parameters | AICc | ΔAICc | wi |
|---|---|---|---|
| Distance to Secondary Road + Distance to Major Road + Wells within 1500 m | 200.9 | 0.00 | 0.13 |
| Distance to Secondary Road + Distance to Major Road + Wells within 1500 m + Percent Grass | 201.7 | 0.83 | 0.08 |
| Distance to Secondary Road + Distance to Major Road + Wells within 1500 m + Isopleth | 202.3 | 1.39 | 0.06 |
| Distance to Secondary Road + Distance to Major Road + Wells within 2500 m + Wells within 3500 m + Isopleth | 202.6 | 1.73 | 0.05 |
| Distance to Secondary Road + Distance to Major Road + Wells within 2500 m + Wells within 3000 m + Isopleth | 202.7 | 1.79 | 0.05 |
| Distance to Secondary Road + Distance to Major Road + Wells within 1500 m + Number of Basins | 202.8 | 1.96 | 0.05 |
| Distance to Secondary Road + Distance to Major Road + Wells within 1500 m + Total Days Run | 202.9 | 1.99 | 0.05 |
| Distance to Secondary Road + Distance to Major Road + Wells within 500 m + Wells within 1000 m + Wells within 1500 m + Wells within 2000 m + Wells within 2500 m + Wells within 3000 m + Wells within 3500 m + Wells within 4000 m + Isopleth + Distance to Nearest Well + Number of Basins + Percent Grass + Total Flared + Total Days Run | 218.0 | 17.1 | 0.00 |
Full model-averaged coefficients from global model dredge diagnosing how biological and disturbance metrics affect duck nest density at the site level. Data were collected from duck nests in northwestern North Dakota, USA, 2015–2017. Note that parameter estimates for highly correlated terms (i.e. wells within distance buffers) are deflated because in some models the variance was spread across multiple correlated terms.
| Parameter | Estimate |
|---|---|
| Distance to Secondary Road | −0.00065 |
| Distance to Major Road | −0.00005 |
| Isopleth | 0.00401 |
| Wells within 500 m | −0.00825 |
| Wells within 1000 m | −0.00697 |
| Wells within 1500 m | −0.02226 |
| Wells within 2000 m | −0.00043 |
| Wells within 2500 m | −0.02326 |
| Wells within 3000 m | 0.00163 |
| Wells within 3500 m | 0.01169 |
| Wells within 4000 m | −0.00040 |
| Distance to Nearest Well | −3.62689 × 10⁻⁶ |
| Percent grass | −0.24785 |
| Number of Basins | 0.00001 |
| Total days run | −7.13531 × 10⁻⁶ |
| Total flared | 1.38317 × 10⁻⁷ |
