


Abstract
The potential for wind energy facilities to affect species of grouse in the grasslands of the Great Plains of North America is a conservation concern. Communication by male Greater Prairie-Chickens (Tympanuchus cupido pinnatus) is essential for lek mating displays and includes low-frequency vocalizations that could be disrupted by wind turbine noise. We studied the effects of wind turbine noise on the boom, cackle, whine, and whoop vocalizations of male Greater Prairie-Chickens recorded at 14 leks located 703 m to 23 km away from a wind energy facility near Ainsworth, Brown County, Nebraska, USA, in 2013 and 2014. First, we assessed ambient sound levels at our study sites. Wind turbine noise contributed to the soundscape; leks <1,000 m from wind turbines had higher levels of ambient sound than expected on the basis of recordings obtained at remote locations. Our second objective was to determine whether the acoustic characteristics of the 4 vocalizations recorded near the wind energy facility differed from those recorded farther away. At leks within 1,000 m of the wind energy facility, boom and whoop sound pressure levels were higher (boom 2% higher; whoop 5% higher), boom duration was 3% shorter, whine fundamental frequency was 11% higher, and biphonations in cackle vocalizations occurred 15% less often. These differences suggest that male Greater Prairie-Chickens adjust the acoustic properties of their vocalizations in response to the sounds generated by turbines at wind energy facilities. The effect of the adjustments reported here on the mating success of males near wind energy facilities remains to be determined.
Resumen
El potencial que tienen las instalaciones de energía eólica de afectar a las especie de tetraóninos en los pastizales de las Grandes Llanuras de América del Norte es una preocupación de conservación. La comunicación de los machos de Tympanuchus cupido pinnatus es esencial para los despliegues de apareamiento en las asambleas de cortejo e incluye vocalizaciones de baja frecuencia que podrían verse afectadas por el ruido de las turbinas eólicas. Estudiamos los efectos del ruido de las turbinas eólicas sobre las vocalizaciones de boom, cacareo, gimoteo y alarido de machos de T. c. pinnatus, registradas en 14 asambleas de cortejo localizadas a 703 m hasta 23 km de distancia desde una instalación de energía eólica cerca de Ainsworth, Condado de Brown, Nebraska, EEUU en 2013 y 2014. Primero, evaluamos los niveles de ruido ambiental en nuestros sitios de estudio. El ruido de las turbinas eólicas contribuyó al ruido ambiental, ya que las asambleas de cortejo ubicadas a <1000 m desde las turbinas eólicas tuvieron mayores niveles de ruido ambiental que lo esperado basados en grabaciones obtenidas en ubicaciones distantes. Nuestro segundo objetivo fue determinar si las características acústicas de las cuatro vocalizaciones registradas cerca de la instalación de energía eólica se diferenciaron de las registradas más lejos. En las asambleas de cortejo dentro de los 1000 m de la instalación de energía eólica, los niveles de presión sonora de las vocalizaciones de boom y alarido de T. c. pinnatus fueron más altos (boom 2% más alto; EE=0.7430; alarido 5%, EE=1.6184), la duración del boom fue 3% más corta (EE=0.0288), la frecuencia fundamental de gimoteo fue 11% más alta (EE=18.4281) y las bifonaciones en las vocalizaciones de cacareo ocurrieron con un 15% menos de frecuencia (EE=0.0657). Estas diferencias sugieren que los machos de T. c. pinnatus ajustan las propiedades acústicas de sus vocalizaciones en respuesta a los sonidos generados por las turbinas en las instalaciones de energía eólica. Debe aún determinarse el efecto de los ajustes mencionados en este trabajo sobre el éxito reproductivo de los machos cerca de las instalaciones de energía eólica.
Palabras clave: antropogénico, ave, aviar, enmascaramiento, granja eólica, llamadas, sonido, Tympanuchus cupido pinnatus
Introduction
Human population growth has increased the presence and level of anthropogenic noise on the landscape. Wind turbines at wind energy facilities are a source of anthropogenic noise, and the construction of wind energy facilities has increased dramatically in the Great Plains of North America in recent years (Fargione et al. 2012). Wind energy facilities are being constructed without full knowledge of their effects on birds and other wildlife that occupy the associated landscape (Stewart et al. 2007). Wind turbines emit a low-frequency noise that is a combination of the turbine mechanics and the blades moving through the air (Hubbard and Shepherd 1990, Saidur et al. 2011). Unlike other sources of anthropogenic noise, such as road noise, wind turbine noise can be a constant presence throughout the day and night.
Smith and Dwyer (2016) noted the need to consider indirect effects of wind energy facilities on grassland birds. Biologists have recently investigated the potential for wind energy facilities to indirectly affect avian behavior (Madsen and Boertmann 2008, Pearce-Higgins et al. 2012), predation risk (Pearce-Higgins et al. 2009, Garvin et al. 2011), and nest success (Gillespie and Dinsmore 2014, LeBeau et al. 2014, McNew et al. 2014). On our study site, neither brood survival, nest survival, brooding, and nesting habitat selection nor movements or survival of female Greater Prairie-Chickens (Tympanuchus cupido pinnatus; hereafter “prairie-chickens”) were affected by proximity to turbines (Harrison 2015, Harrison et al. 2017, Smith et al. 2017). However, lekking male prairie-chickens near wind turbines spent more time in breeding behaviors than males farther from turbines (Smith et al. 2016), which could reflect lower levels of predators near the wind energy facility (Smith et al. 2017). The potential for wind turbine noise to disturb wildlife has been suggested by a number of studies (Leddy et al. 1999, Drewitt and Langston 2006, Devereux et al. 2008). Only one study has assessed the effect of wind energy facilities on the acoustic characteristics of avian breeding vocalizations. Zwart et al. (2016) found that European Robins (Erithacus rubecula) used fewer low-frequency song elements during territorial intrusion in the presence of wind turbine noise compared to quiet conditions, which suggests that the birds adjusted their vocalizations to overcome the effects of masking by wind turbine noise. Rabin et al. (2006) found that California ground squirrels (Otospermophilus beecheyi) increased vigilance near wind turbines, which suggests that wind turbine noise may affect antipredator behavior.
Birds use vocalizations to establish and defend territories, attract mates, determine mate quality, communicate with conspecifics, and communicate between parents and offspring. Depending on the spectral and temporal characteristics of background noise, the detection of acoustic communication signals may be affected. Masking occurs when background noise interferes with the detection or discrimination of an acoustic signal (Ortega 2012). Because acoustic communication serves many important functions in birds, masking of vocalizations may have severe consequences for birds' reproduction and survival (Brumm and Slabbekoorn 2005).
Birds utilize different strategies to minimize acoustic masking of their vocalizations. Some avian species have been shown to (1) adjust the frequencies of their vocalizations to reduce spectral overlap with the noise (Slabbekoorn and Peet 2003, Wood and Yezerinac 2006, Ripmeester et al. 2010); (2) increase the amplitude (“loudness”) of their vocalizations in an attempt to be heard over the background noise, known as the “Lombard effect” (Brumm and Todt 2002, Brumm 2004); (3) change the components and redundancies of their vocalizations (Brumm and Slater 2006); and (4) shift their vocalization bouts to a quieter time of day if the interfering noise varies temporally (Brumm 2006). Greater Sage-Grouse (Centrocercus urophasianus) experience interference from industrial noise (Blickley and Patricelli 2012, Blickley et al. 2012), and Noel (2013) determined that wind turbine noise has the potential to mask low-frequency (≤125 Hz) components of Greater Sage-Grouse display calls.
The prairie-chicken is a medium-sized grouse that resides in the open prairies and oak savanna of the Great Plains (Aldrich 1963, Johnson et al. 2011) and is a species of conservation concern (Schneider et al. 2011). Prairie-chickens are known for their polygynous mating system in which males congregate in groups each spring at leks to perform courtship displays and attract females (Breckenridge 1929, Schwartz 1945). Males maintain territories within the leks, which they actively defend from other males as females visit to observe males and achieve copulations (Breckenridge 1929, Schwartz 1945, Hamerstrom and Hamerstrom 1960).
Vocalizations are an essential component of prairie-chicken leks. Male prairie-chickens primarily use 4 types of vocalizations while lekking: “boom,” “cackle,” “whine,” and “whoop” (Sparling 1981, 1983; for descriptions of the vocalizations, see Whalen et al. 2017). All 4 types of vocalizations are of low frequency (Whalen et al. 2017), which makes them especially vulnerable to low-frequency sounds produced by wind turbines. Males produce boom vocalizations during courtship displays and mildly aggressive encounters with other males (Sparling 1981, 1983). The boom travels a long distance across the landscape, and Hamerstrom and Hamerstrom (1960) and Sparling (1983) suggested that booms may advertise the lek location to other prairie-chickens. The whoop is a vocalization typically produced when females are present on the leks and is often associated with flutter jumps and foot-stomping (Hamerstrom and Hamerstrom 1960, Sparling 1983). Sparling (1981, 1983) suggested that one purpose of the whoop may be to attract females at close range. The cackle and whine are short vocalizations that are often used together in long, repetitive strings. Cackles and whines are often associated with aggressive behavior, and Sparling (1981, 1983) considered cackles to be slightly more aggressive than whines.
Our goal was to assess potential effects of a wind energy facility on male prairie-chicken vocalizations. Our objectives were to determine whether (1) distance from the wind energy facility affected ambient sound levels at prairie-chicken leks and (2) the acoustic characteristics of the 4 primary male prairie-chicken vocalizations differed between leks located near the wind energy facility compared to leks located farther away. Such differences, if detected, would suggest that prairie-chickens have altered their vocalizations in response to masking caused by wind turbine noise. We anticipated that the leks nearest the wind energy facility would have measured sound levels higher than expected. Further, we predicted that vocalizations of male prairie-chickens at leks with higher ambient sound levels (including those produced by wind turbines) would differ in acoustic characteristics when compared to vocalizations of males at more distant leks. We hypothesized that the male prairie-chicken vocalizations at leks near the wind energy facility would differ in duration, sound pressure level, frequency, bandwidth, or nonlinearities compared to vocalizations at leks farther from the wind energy facility because of the potential for wind turbine noise to mask vocalizations. We predicted that (1) vocalizations near the wind energy facility would be longer in duration, given that extending the duration of vocalizations may be a strategy to reduce masking (Foote et al. 2004); (2) vocalization sound pressure levels would be higher at leks near the wind energy facility because birds can increase the amplitude of their vocalizations in the presence of noise (Brumm and Todt 2002); (3) peak, dominant, and fundamental frequencies would be higher at leks located near the wind energy facility because birds may increase the frequencies of vocalizations to reduce spectral overlap with noise and minimize masking (Slabbekoorn and Peet 2003, Wood and Yezerinac 2006); and (4) vocalization bandwidths would be narrower near the wind energy facility because vocalizations with greater bandwidth are more difficult to detect in the presence of noise (Lohr et al. 2003).
Methods
Study Site and Design
During March–June, 2013 and 2014, we studied male prairie-chicken vocalizations at 14 leks near Ainsworth, Brown County, Nebraska, USA, in association with a 36-turbine wind energy facility (constructed in 2005; 42.45°N, −99.89°W). Prairie-chicken leks were located either on the wind energy facility or in the surrounding area. The distance between each lek and the nearest wind turbine ranged from 703 m to 23 km (Whalen 2015). Because our focus was on wind turbine noise that dispersed from a preexisting facility, we chose to use a gradient study design (Ellis and Schneider 1997, Powell et al. 2017). The gradient design allowed us to compare vocalization data recorded from prairie-chickens at leks located near the wind energy facility with data recorded from leks located farther away to assess the potential effect of the environmental disturbance. Our study design did not allow measurements of expected ambient sound levels at the leks before wind turbines were installed. Therefore, we selected 10 randomly placed recording locations at 9.2–18.3 km from the wind turbine facility that we used to establish expected ambient sound levels in our study area.
Evidence of the Presence of Noise from Wind Turbines
We assessed differences in background sound levels (i.e. sound levels that may include turbine noise but not prairie-chicken noise; hereafter “ambient sound”) among the 14 leks to determine whether the sound levels at the leks near the wind energy facility were higher than the sound levels at leks located farther away. We used this information to group the leks into “near” (higher ambient sound level) and “far” (lower ambient sound level) categories to create a discrete model to represent distance to turbine in our analyses. The turbines at our study site were constant rotation units, so blade rotation speed remains constant, as will turbine-induced sound pressure levels, irrespective of wind speed.
We recorded ambient sound 2–4 times during March–May 2014—to record conditions at the leks before the prairie-chickens arrived (Whalen 2015)—at the 14 leks and the 10 random locations. For 3 hr between 0130 and 0500 hours CDT, we measured the sound pressure levels (dB SPL) of the ambient sound at 4 frequencies: 301, 479, 694, and 926 Hz. We chose these frequencies because they were the average peak frequencies of the boom, cackle, whoop, and whine, respectively (Whalen 2015, Whalen et al. 2017). The measured sound levels for each lek are the sound levels actually measured there; some likely contained wind turbine noise.
We conducted regression analyses using the ambient sound data recorded at the 10 random locations to predict sound level (dB SPL) at each of the 4 focal frequencies, based on effects of ordinal day, time, and wind speed from each sample. We then used these regression models to predict the expected sound level, in the absence of wind turbine noise, for each lek as a function of the day, time, and wind-speed conditions that occurred during the sound-level recordings at each lek. We then compared the predicted ambient sound levels at each lek with the average measured sound levels at each lek (Figure 1) to provide evidence for the presence of wind turbine noise. Our gradient study design informed the distances at which the noise from wind turbines carried to leks.
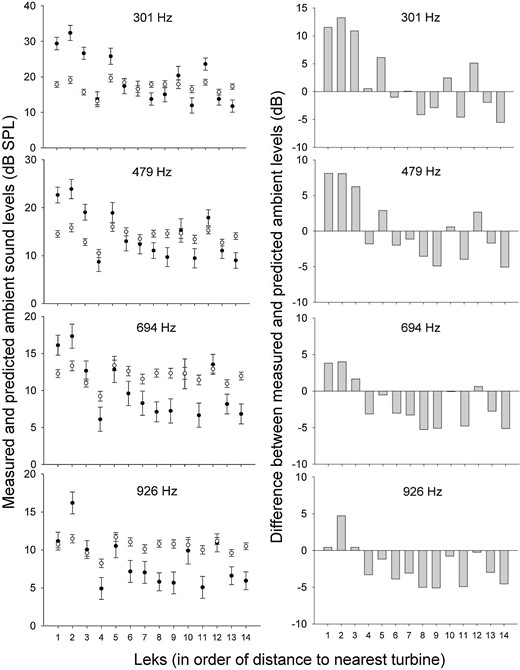
(Left) Comparison of predicted ambient sound levels without wind turbine noise (white circles) and measured ambient sound levels potentially containing wind turbine noise (black circles) at 4 frequencies (301, 479, 694, and 926 Hz) at 14 Greater Prairie-Chicken leks studied near Ainsworth, Nebraska, USA, in 2013 and 2014. Error bars represent 95% confidence intervals. (Right) Difference between predicted and measured ambient sound levels at each lek. Distances (meters) from leks to nearest turbine: 1 (703), 2 (948), 3 (949), 4 (1,587), 5 (1,749), 6 (3,614), 7 (4,948), 8 (7,357), 9 (9,121), 10 (9,624), 11 (14,021), 12 (15,356), 13 (19,260), 14 (23,306).
We considered 2 alternative models to describe the effects of distance from the nearest turbine on the potential variation in vocalization characteristics from males at leks: a discrete, stair-step (near–far leks) model or a linear (straight-line distance from lek to turbine) model (Powell et al. 2017). We used Akaike's Information Criterion corrected for small samples (AICc) to select the model that best described spatial pattern in the variability of each of the acoustic characteristics for the 4 vocalization types.
Recording and Measuring Vocalization Data
We recorded male vocalizations at each of the 14 study leks by placing SM2+ Song Meter audio recorders (Wildlife Acoustics, Concord, Massachusetts, USA) on the leks in locations where we expected the prairie-chickens to be vocalizing (for additional details on the recording methods, see Whalen 2015, Whalen et al. 2017). We observed the prairie-chickens from a blind placed on the edge of the lek (Whalen 2015). While observing the prairie-chickens, we estimated the distance between a vocalizing male and the microphone to the nearest 0.5 m, and we used video recordings to provide post hoc information when necessary. We also determined the direction of the microphone in relation to the male (45-degree bins: front, front right, right side, rear right, rear, rear left, left side, front left). We counted the numbers of males and females present on the lek every 10 min throughout the morning. We placed a Kestrel 4500 Weather Meter (Nielsen-Kellerman, Chester, Pennsylvania, USA) near the lek to collect wind-speed, wind-direction, temperature, and humidity data every 5 min. Because there are 36 turbines located at the facility, some of the closest leks are both downwind and upwind of different turbines. Thus, we considered wind speed as an explanatory variable, but we did not include wind direction. The weather meter was positioned on a stand 25 cm above the ground to match the heights of the audio-recorder microphones and the heads of prairie-chickens.
On the basis of an a priori power analysis, we used recordings of 20 boom, 20 cackle, and 20 whine vocalizations from each lek. We only used recordings that were of sufficient quality for analysis, and we selected vocalizations that were recorded at different times of day, on different days of the lekking season, and in different years and that were produced by different males (Whalen 2015). Whoop vocalizations were less frequent than other vocalizations, so we used 10 recordings of whoops from each lek. We measured the duration, maximum power, peak frequency, fundamental frequency, dominant frequency, bandwidth, and nonlinearities (frequency jumps, biphonations, subharmonics, deterministic chaos) of each vocalization (Whalen 2015, Whalen et al. 2017). For details describing how noise levels were measured, see Appendix.
Statistical Analysis
We included the following response variables in the analysis: duration (seconds), sound pressure level (dB SPL), peak frequency (Hz), fundamental frequency (Hz), dominant frequency (Hz), bandwidth at 10 dB below the peak (Hz), bandwidth at 20 dB below the peak (Hz), bandwidth at 30 dB below the peak (Hz), bandwidth at 40 dB below the peak (Hz), frequency jumps (presence–absence), biphonations (presence–absence), subharmonics (presence–absence), and deterministic chaos (presence–absence) for each vocalization (boom, cackle, whine, and whoop) (PROC GLIMMIX, SAS Institute, Cary, North Carolina, USA; for details, see Whalen 2015). We conducted a correlation analysis (PROC CORR; SAS Institute) for each type of vocalization to determine whether any of the acoustic characteristics were correlated. For duration, sound pressure level, peak frequency, fundamental frequency, dominant frequency, and nonlinearities, we considered a correlation value of r > 0.6 as the level at which we removed one of the variables from the analysis. For the bandwidth measurements, we considered P < 0.05 to be a significant correlation. Nonlinearities were in the form of presence–absence, so we omitted a nonlinearity from the analysis if it was present in >95% or <5% of the sample of a particular vocalization.
We considered the following explanatory variables in the analysis, in addition to distance to turbine (discrete near–far groups) to address within-season, within-day, and other spatial dynamics at the lek and landscape level: ordinal day, time (minutes after midnight), distance of lek to nearest road (meters), distance from male to microphone (meters), direction from male to microphone (direction categories), males (number present at lek), females (number present at lek), temperature (°C), and wind speed (kilometers per hour). We conducted a correlation analysis (PROC CORR; SAS Institute, Cary, NC, USA) for each type of vocalization to determine whether any of the explanatory variables were correlated. We considered a correlation value of r > 0.6 as the level at which we removed one of the variables from the analysis. Results are presented as means ± SE.
Results
Model Construction
The 3 leks located closest to the wind energy facility (within 1,000 m of the nearest turbine) had measured sound levels higher than predicted sound levels for all 4 focal frequencies measured, which suggests that wind turbine noise raised the sound levels at those leks, in comparison to the leks >1,000 m from the nearest turbine (Figure 1). Thus, the 3 leks within 1,000 m of the wind energy facility were assigned to the “near” group, and the 11 leks >1,000 m from the wind energy facility were assigned to the “far” group, for the discrete model used to describe variation in vocalization characteristics. The discrete model (near–far) was selected as the better model (AICc discrete < AICc linear) to describe variation in vocalization characteristics in relation to distance to turbine for 27 of 28 cases (Whalen 2015). For consistency, we used the discrete, near–far model to describe variation in vocalizations for all analyses. For visualization of acoustic characteristics of sounds recorded close to and far from wind turbines, see Appendix Figure 3.
Many of the vocalization characteristics were correlated, which allowed us to reduce the number of variables included in subsequent comparisons of the characteristics of vocalizations at near and far leks (Whalen 2015). For the boom vocalization, we included duration, sound pressure level, peak frequency, biphonations, subharmonics, bandwidth at 20 dB, and fundamental frequency in the analysis. For the cackle vocalization, we selected duration, sound pressure level, peak frequency, biphonations, bandwidth at 20 dB, and fundamental frequency. For the whine vocalization, we selected duration, sound pressure level, peak frequency, frequency jumps, biphonations, subharmonics, deterministic chaos, bandwidth at 20 dB, and fundamental frequency. For the whoop vocalization, we selected duration, sound pressure level, frequency jumps, biphonations, bandwidth at 20 dB, and fundamental frequency. Ordinal day was positively correlated with temperature for all vocalizations (rboom = 0.66, rcackle = 0.64, rwhine = 0.63, rwhoop = 0.57; Whalen 2015), so we chose to include ordinal day in the analysis and exclude temperature.
Boom Vocalization
Boom duration was shorter near the wind energy facility (βnear = −0.0598 ± 0.0288, P = 0.04; Figure 2), decreased with increased ordinal day (βday = −0.0015 ± 0.0006, P = 0.009), decreased with increased number of females (βfemales = −0.0871 ± 0.0404, P = 0.03), and decreased with increased wind speed (βwind speed = −0.0088 ± 0.0036, P = 0.01). Boom sound pressure level was higher near the wind energy facility (βnear = 1.8922 ± 0.7430, P = 0.01; Figure 2), decreased with ordinal day (βday = −0.0414 ± 0.0147, P = 0.005), and decreased with increased wind speed (βwind speed = −0.2022 ± 0.0922, P = 0.03). Boom peak frequency decreased with ordinal day (βday = −0.1026 ± 0.0420, P = 0.02), decreased with increased minutes after midnight (βtime = −0.0543 ± 0.0204, P = 0.008), and increased with increased number of males (βmales = 0.7424 ± 0.2838, P = 0.01). Boom bandwidth at 20 dB increased with ordinal day (βday = 0.1510 ± 0.0611, P = 0.01). Boom fundamental frequency decreased with ordinal day (βday = −0.1242 ± 0.0418, P = 0.003) and increased with increased number of males (βmales = 0.8314 ± 0.2828, P = 0.004). The presence of boom biphonations and subharmonics was not affected by any of the explanatory variables.
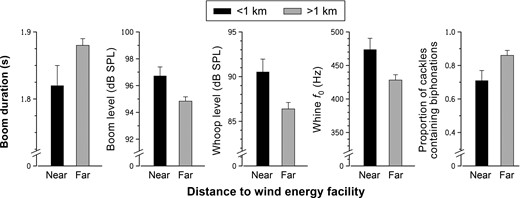
Comparison of least squares means (error bars = SE) of Greater Prairie-Chicken (left to right) boom duration, boom sound pressure level, biphonations in cackle calls, whine fundamental frequency (f0), and whoop sound pressure level at leks close to (<1 km) and far from (>1 km) a wind energy facility near Ainsworth, Nebraska, USA, in 2013 and 2014.
Cackle Vocalization
Cackle sound pressure level decreased with ordinal day (βday = −0.0441 ± 0.0176, P = 0.01) and was affected by direction to microphone (P = 0.02) in that the sound pressure level was highest at the front right of the male (βfrontright = 1.7893 ± 1.2983) and lowest at the rear left of the male (βrearleft = −2.1744 ± 1.3255). Cackle peak frequency decreased with increased distance to microphone (βmicrophone = −43.2144 ± 13.9138, P = 0.002). Cackle biphonations were present less often near the wind energy facility (βnear = −0.1492 ± 0.0657, P = 0.02; Figure 2). Cackle bandwidth at 20 dB increased with ordinal day (βday = 5.1328 ± 1.5242, P < 0.001), decreased with increased distance to road (βroad = −0.1037 ± 0.0406, P = 0.01), and decreased with increased distance to microphone (βmicrophone = −73.4527 ± 20.8203, P < 0.001). Cackle fundamental frequency decreased with increased minutes after midnight (βtime = −0.1262 ± 0.0498, P = 0.01), increased with increased distance to microphone (βmicrophone = 2.8718 ± 1.4256, P < 0.05), and increased with increased wind speed (βwind speed = 1.8327 ± 0.6092, P = 0.003). Cackle duration did not vary with any of the explanatory variables.
Whine Vocalization
Whine peak frequency increased with increased distance to road (βroad = 0.1150 ± 0.0579, P < 0.05), decreased with increased distance to microphone (βmicrophone = −88.5533 ± 29.8846, P = 0.003), and increased with increased number of females (βfemales = 148.3300 ± 73.0853, P = 0.04). The presence of whine subharmonics increased with ordinal day (βday = 0.0036 ± 0.0011, P = 0.001). The presence of deterministic chaos was affected by direction to microphone (P = 0.03); deterministic chaos was most present to the rear left (βrearleft = 0.1375 ± 0.0942) and least present to the rear (βrear = −0.1782 ± 0.0814) of the vocalizing male. Whine fundamental frequency was higher near the wind energy facility (βnear = 45.6179 ± 18.4281, P = 0.01; Figure 2), increased with ordinal day (βday = 0.7389 ± 0.3585, P = 0.04), and increased with increased number of males (βmales = 4.6557 ± 2.2056, P = 0.04). Whine duration, sound pressure level, frequency jumps, biphonations, and bandwidth at 20 dB were not affected by any of the explanatory variables.
Whoop Vocalization
Whoop duration increased with ordinal day (βday = 0.0015 ± 0.0003, P < 0.001) and increased with increased number of females (βfemales = 0.0302 ± 0.0096, P = 0.002). Whoop sound pressure level was higher near the wind energy facility (βnear = 4.1635 ± 1.6184, P = 0.01; Figure 2). The presence of whoop frequency jumps decreased with increased males (βmales = −0.0419 ± 0.0153, P = 0.007). The presence of whoop biphonations decreased with increased wind speed (βwind speed = −0.0272 ± 0.0120, P = 0.03). Whoop bandwidth at 20 dB decreased with increased distance to microphone (βmicrophone = −79.1317 ± 35.9285, P = 0.03) and increased with increased number of females (βfemales = 241.2100 ± 89.0041, P = 0.008). Whoop fundamental frequency increased with increased distance to road (βroad = 0.0280 ± 0.0086, P = 0.002) and increased with increased distance to microphone (βmicrophone = 9.4799 ± 4.7525, P < 0.05).
Discussion
Acoustic Response to Wind Energy Facility Noise
Sound pressure levels of the boom and whoop vocalizations were higher near the wind energy facility (Figure 2), which is consistent with the Lombard effect (Brumm and Todt 2002, Brumm 2004) and suggests that male prairie-chickens are raising the levels of those vocalizations to attempt to overcome the masking effects of wind turbine noise. Birds may increase the level of their vocalizations in an attempt to be heard over anthropogenic noise. For example, Brumm and Todt (2002) found that Common Nightingales (Luscinia megarhynchos) increased their song amplitude in the presence of broadcast white noise. A potential consequence of increasing vocalization level is that more energy is required to produce vocalizations at higher sound levels (Brumm 2004), which may affect an individual's energy budget and overall fitness.
Boom vocalization duration was shorter near the wind energy facility (Figure 2), which might be explained by the increased energy required to produce the boom's higher sound pressure levels. The energy required to boom at a higher level (“louder”) may be coming from the energy saved by booming for shorter durations. Bird vocalizations are energetically expensive to produce (Ryan 1988), and longer vocalization bouts are more energetically expensive than shorter ones (Cuthill and Macdonald 1990). Assessment of passerine song has suggested that vocalizations are not particularly expensive in relation to a daily energy budget (Oberweger and Goller 2001, Zollinger et al. 2011). However, male prairie-chickens on leks vocalize in the context of foot-stomping, jumping, and almost constant movement; in fact, Smith et al. (2016) reported that males on our study leks were stationary for only 35% of behavioral observations, so their energy budgets may not be comparable to those of perched passerines. Additionally, boom vocalizations require the use of air sacs, rather than more efficient vocalizations that use mechanisms associated with breathing. Smith et al. (2016) reported that males on our study leks that were closer to the wind energy facility spent more time engaged in breeding behaviors (i.e. sum time spent in flutter-jumping, boom behavior, and agonistic behaviors) than males at leks farther from the wind energy facility. Given the energy needed for physical movements that occur more often when males are near wind energy facilities, male prairie-chickens may encounter a trade-off that leads to increased boom sound pressure level and decreased boom duration at leks near the wind energy facility. Such trade-offs are possible, especially when viewing an energy budget within the framework of present-tense, morning lekking activities rather than a daily budget.
Whine fundamental frequency was higher near the wind energy facility (Figure 2), which suggests that male prairie-chickens are shifting to a higher fundamental frequency to avoid masking by wind turbine noise. This shift is consistent with the upward shift in minimum frequencies reported by other studies. Wood and Yezerinac (2006) found that Song Sparrows (Melospiza melodia) in noisier locations sang with higher-frequency low notes to avoid masking by urban noise. Similarly, Slabbekoorn and Peet (2003) found that Great Tits (Parus major) sang using higher minimum frequencies at noisy locations. Oden et al. (2015) found that Black-capped Chickadees (Poecile atricapillus) and American Goldfinches (Spinus tristis) raised the minimum frequencies of their calls in areas with high levels of road traffic noise. Although Nemeth and Brumm (2010) cautioned that increased frequency might not increase the distance at which a signal is perceived and could be a physiological side effect of singing at higher pressure levels, we did not find increased sound pressure levels for whine vocalizations near wind turbines. Increasing the minimum frequency is a common result in noise studies, but we observed such shifts only in the whine vocalization. Hu and Cardoso (2010) suggest that birds with low-minimum frequencies may not benefit from an upward frequency shift because a substantial shift would be required to avoid low-frequency noise, so the birds may use other adaptations to reduce masking.
Cackle biphonations occurred less often near the wind energy facility (Figure 2). Animals living in groups may become habituated to each other's vocalizations, and nonlinearities provide a complexity and unpredictability to the vocalizations that may make them more noticeable or promote individual recognition (Fitch et al. 2002). Because prairie-chickens are a lekking species, the ability of an individual to stand out and be recognized may be important and could explain the high occurrence of nonlinearities in their vocalizations. Because biphonations provide complexity that makes the vocalization stand out, the cackles near the wind energy facility may lack some of this complexity and individuality.
We note that our model derived from recordings at the 10 random sites tended to predict higher ambient sound levels than we recorded at the leks farther from wind turbines, especially for higher frequencies (Figure 1). We attempted to account for temporal variability and wind speed conditions in our predictive model, and it is possible that even slight differences in topography and other factors may have played a role in the departures of our predictions from actual sound levels from ambient sources that reached the lek (E. Raynor, University of Nebraska-Lincoln, personal communication). The tendency of our predictive model to be positively biased at leks far from wind turbines suggests that our inference should be viewed as conservative. But this bias reinforces the strength of the inference derived from relative sound levels (Figure 1) to determine the distance at which wind turbine noise was detected in recordings on the leks.
Whalen et al. (2017) suggested that variability in characteristics of male prairie-chicken vocalizations may provide plasticity when individuals have the need to adapt to changing environmental conditions. Here, we provide evidence that male prairie-chickens may respond to increased noise levels near the wind energy facility by adjusting aspects of their vocalizations to reduce the masking effects produced by wind turbine noise. Other studies have found evidence of (1) adjusted use of low-frequency song elements by European Robins to reduce masking by wind turbine noise (Zwart et al. 2016), (2) increased vigilance of California ground squirrels due to alarm calls masked by wind turbine noise (Rabin et al. 2006), and (3) potential for wind turbine noise to mask sage-grouse display calls (Noel 2013).
Although changing characteristics of their vocalizations may help male prairie-chickens reduce the effects of masking produced by wind turbine noise, there may be consequences to vocal adjustment. The increase in boom and whoop vocalization sound pressure levels may require more energy to produce (Brumm 2004; but see Zollinger et al. 2011), which may affect the fitness of male prairie-chickens. Because vocal adjustments may affect female choice (Patricelli and Blickley 2006), the changes in acoustic characteristics found in the boom and whoop vocalizations may affect the females' assessment of male prairie-chickens. Similarly, changes in the cackle and whine vocalizations could result in inaccurate assessment of rival males, because vocal adjustment may affect male–male competition (Patricelli and Blickley 2006). Wind energy facilities may provide a unique context for future studies to assess the potential consequences of vocalization adjustment.
Context of Acoustic Adjustments
The response to wind energy facilities by grassland birds and grouse species, in particular, is far from consistent (Smith and Dwyer 2016). But the potential for wind energy facilities to indirectly affect behavior, density, habitat selection, survival, movements, and vocalizations during mating would suggest that future studies be designed to simultaneously consider as many factors as possible. Our acoustic assessment had the benefit of concurrent studies on prairie-chickens in the same landscape (Harrison 2015, Smith et al. 2016, 2017, Harrison et al. 2017). The effects of the wind energy facility on vocalization characteristics that we documented were one of only the 3 effects that our team reported; lekking male behavior (Smith et al. 2016) and the distribution of mammalian predators (Smith et al. 2017) also varied near the wind energy facility compared to most distant sites.
The impact of adjustments to vocalizations on the fitness of males near turbines remains to be determined. We documented the arrival by females at all leks near turbines, and we witnessed copulations on all leks during our sampling periods (C. Whalen personal observation). Winder et al. (2015) reported lower persistence of prairie-chicken leks within 5 km of a newly constructed wind energy facility in Kansas, and leks within 1 km were especially prone to abandonment by males. Coincidentally, we documented that ambient noise at leks within 1 km of the wind energy facility at our study site was higher than expected (Figure 1). Winder et al. (2015) did not propose acoustic masking as a potential reason for the failure of leks in Kansas, and we encourage future studies to consider acoustic dynamics as potential drivers of indirect effects of wind facilities on breeding birds (Smith and Dwyer 2016). Whalen (2015) reported that topography and wind speed and direction influenced propagation of noise from wind turbines, which is a potential hypothesis to explain why Winder et al. (2015) reported that some leks within 1 km of turbines persisted in Kansas. We suggest that spatial modeling of noise propagation from wind energy facilities may be useful to the interpretation of lek persistence dynamics and other spatial demographic patterns. Spatial modeling of the soundscape would also be invaluable for assessing potential risk during the siting phase of the development of wind farms.
Potential Measurement Bias Caused by Background Noise
The presence of background noise is a significant analytical variable that may bias measurements by masking relevant features of call recordings, especially when background noise levels are high (Brumm et al. 2017, Ríos-Chelén et al. 2017). The influence of noise-induced bias cannot be completely ruled out in this investigation, because observed differences in acoustic properties between some calls in recordings made at leks close to the wind farm and those made at distant locations are consistent with predictions related to the presence of background noise in call recordings. However, our strategy was to limit analyses to those vocalizations in which the contribution of wind noise was minimal and, thereby, partially control measurement bias. Although the differences in sound pressure levels reported here were generally small, they most likely represent true turbine-induced vocal adjustments, largely because background noise levels would have to be nearly equal to or greater than the level of the call to account for the approximately 2–4 dB differences we observed. In this regard, it is notable that >75% of the vocalization recordings selected for analyses had no relevant background noise such as calls from other birds or other noise sources. In addition, the calls considered here exhibited relatively rapid rise and fall times, characteristics that favor accurate duration measurements. Vocalization samples analyzed here were also limited to those with strong signal clarity and/or intensity; as such, spectral properties were well defined and potential masking noise effects on frequency-based measurements were minimized.
Although the potential influence of background noise on measurements must be considered, our overall assessment is that the differences observed in the present study most likely reflect turbine-induced vocal adjustments. It remains to be seen whether the adjustments reported here substantially influence the female selection dynamic.
Acknowledgments
We thank M. DeLauter, J. Lusk, I. Hoppe, D. Leger, J. Olney Harrison, B. Vodehnal, and C. Walnofer for their assistance with the project. We thank J. Smith for her valuable input throughout the planning and data-collection phases of this project. We thank M. Gonnerman, J. Mather, T. Montgomery, L. Sanders, E. Shogren, and N. Turner for their assistance in finding leks. We also thank the numerous private landowners who graciously provided land access for the study as well as the Nebraska Public Power District for providing access to the wind energy facility.
Funding statement: Funding was provided by Federal Aid in Wildlife Restoration Project W-99-R administered by the Nebraska Game and Parks Commission.
Ethics statement: This research was approved by the University of Nebraska-Lincoln's Institutional Animal Care and Use Committee (permit no. 901).
Author contributions: M.B.B., J.M., L.A.P., and E.J.W. conceived of the study. C.E.W. collected the data. C.E.W., M.B.B., J.M., L.A.P., and E.J.W. designed the methods and wrote the paper. C.E.W., M.B.B., and L.A.P. analyzed the data.
Literature Cited
Appendix
Descriptions of Methods Used to Measure the Acoustic Characteristics of Greater Prairie-Chicken Vocalizations Recorded at Leks near Ainsworth, Nebraska, USA, 2013 and 2014
Avoidance of background noise contamination
We ranked the degree of background noise (from songbirds, cars, airplanes, etc.) as we assessed each candidate recording sample of each vocalization on a scale of 0–3 (0 = no noise contamination; 1 = very minimal contamination, noise occurring at different frequency than the call; 2 = moderate contamination, noise occurring at same frequency as the call; 3 = substantial contamination, with background noise so severe that vocalization is not usable). We attempted to use vocalization recordings with noise contamination levels of 0 or 1 (boom: 0 = 3%, 1 = 71%, 2 = 26%, 3 = 0%; cackle: 0 = 13%, 1 = 82%, 2 = 5%, 3 = 0%; whine: 0 = 16%, 1 = 59%, 2 = 25%, 3 = 0%; whoop: 0 = 0%, 1 = 78%, 2 = 22%, 3 = 0%).
Duration
Duration is the length of the vocalization, measured in seconds. We measured duration by visually estimating the earliest time point indicating an increase in pressure above the adjacent background of the temporal waveform, and the offset as the time point at which the pressure wave returned to baseline values. The duration is the difference between the onset values and offset values. Time points were verified by examining spectrograms using a Hann window type, with a window size of 10 ms, 3 dB filter bandwidth of 144 Hz, DFT size of 512 samples, and grid spacing of 86 Hz.
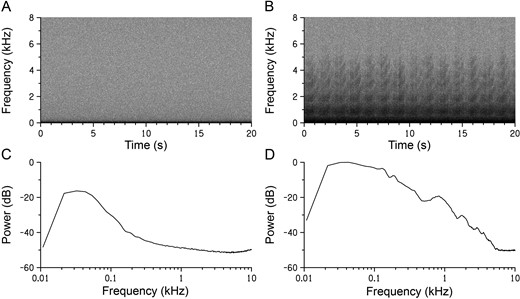
Visualization of acoustic characteristics with spectrogram and power spectra of sounds recorded at Greater Prairie-Chicken leks close to and far from wind turbines near Ainsworth, Nebraska, USA, in 2013 and 2014. Spectrograms are shown of (A) ambient sound recorded at distant locations from the wind energy facility and (B) sound recorded 103 m from a wind turbine at the wind energy facility on quiet mornings with very little wind in March 2014. Recordings were made between 0130 and 0500 hours CDT at both locations. Wind turbine noise is visible in the lower frequencies of the sound recorded near the wind energy facility. Associated power spectra are shown for (C) ambient sound and (D) sound recorded near the wind energy facility. Power is expressed in relation to one dimensionless sample unit, and both spectra have been normalized in relation to the maximum power of the spectrum in D.
Maximum power
Maximum power is the highest power occurring in the vocalization, measured in decibels (Charif et al. 2010). Maximum power measurements were taken from spectrograms viewed in Raven and automatically recovered from Raven software. When measuring boom maximum power, we used a Hann type window, window size of 100 ms, 3 dB filter bandwidth of 14.4 Hz, DFT size of 8,192 samples, and grid spacing of 5.38 Hz. When measuring cackle, whine, and whoop maximum power, we used a Hann type window, window size of 50 ms, 3 dB filter bandwidth of 28.8 Hz, DFT size of 4,096 samples, and grid spacing of 10.8 Hz. Power measurements were converted to sound pressure levels as described below.
Sound-pressure-level calibration methods
The power measurements acquired from the Raven software are referenced to dimensionless sample units and, therefore, do not provide specific information regarding the sound pressure levels of vocalizations. In addition, we used different microphones and different audio recorders to record acoustic signals, and prairie-chickens were located at different distances from recording microphones. To address these disparities, we calibrated each recording system in an acoustically and electrically shielded booth located in a quiet laboratory setting. Digitally synthesized tones of known frequency and sound pressure level (dB SPL re 20 μPa), which were confirmed using a precision Larson Davis (Depew, New York, USA) sound level meter, were used as calibration signals. The calibration signals were recorded using the audio settings used in field recordings for both microphones attached to each audio recorder, in unweighted .wav sound files that were 1 min in length.


Peak frequency
Peak frequency, measured in Hertz, is the frequency component of the vocalization corresponding to the peak power identified in the spectrum of the call. Peak frequency was determined by measuring the frequency corresponding to the highest power of a narrowband selection spectrum. A selection spectrum is a graph with power on the y-axis and frequency on the x-axis, and the selection spectrum displays the averaged spectrum of the entire selected vocalization.
When measuring boom peak frequency, we used a Hann type window, window size of 100 ms, 3 dB filter bandwidth of 14.4 Hz, DFT size of 8,192 samples, and grid spacing of 5.38 Hz. When measuring cackle, whine, and whoop peak frequency, we used a Hann type window, window size of 50 ms, 3 dB filter bandwidth of 28.8 Hz, DFT size of 4,096 samples, and grid spacing of 10.8 Hz.
Bandwidth
We used the power spectrum of each vocalization to measure bandwidth. Bandwidth is the difference between upper and lower frequencies at specific levels below the peak value of the power spectrum, measured in Hertz. We measured bandwidth at 10, 20, 30, and 40 dB below the power spectrum peak when possible. When measuring boom bandwidth, we used a Hann type window, window size of 100 ms, 3 dB filter bandwidth of 14.4 Hz, DFT size of 8,192 samples, and grid spacing of 5.38 Hz. When measuring cackle, whine, and whoop bandwidth, we used a Hann type window, window size of 50 ms, 3 dB filter bandwidth of 28.8 Hz, DFT size of 4,096 samples, and grid spacing of 10.8 Hz.
Fundamental frequency
Fundamental frequency is the lowest frequency in the vocalization, measured in Hertz. We identified the fundamental frequency visually in the spectrum and verified the assessment by estimating the difference in Hertz between harmonics, confirming that the 2 estimates matched. We measured the fundamental frequency at different time points throughout a vocalization. For booms, we measured the fundamental frequency at 100 ms intervals, and the average value was used in subsequent analyses. For cackles, whines, and whoops, we measured the fundamental frequency at the beginning and end of the call, as well as the maximum fundamental frequency, and the average value for each call was used in subsequent analyses. The maximum fundamental frequency is the highest value of the fundamental frequency, which typically occurred in the middle of the cackles, whines, and whoops. We measured the fundamental frequency with the spectrogram slice view, which is a graph of power vs. frequency at a specific time point in the vocalization. After creating the spectrogram slice view, we measured the frequency of the peak that corresponded with the fundamental frequency we had located in the spectrogram.
When measuring boom fundamental frequency, we used a Hann type window, window size of 100 ms, 3 dB filter bandwidth of 14.4 Hz, DFT size of 8,192 samples, and grid spacing of 5.38 Hz. When measuring cackle, whine, and whoop fundamental frequency, we used a Hann type window, window size of 50 ms, 3 dB filter bandwidth of 28.8 Hz, DFT size of 4,096 samples, and grid spacing of 10.8 Hz.
Dominant frequency
Dominant frequency is the frequency with the highest power, measured at specific times throughout the vocalization spectrogram, measured in Hertz. In contrast to the peak frequency, which was averaged over the entire call, we measured dominant frequency at specific times in the call. We used the same time points within the spectrogram to measure dominant frequency as were used to measure fundamental frequency. The averaged value for each call was used in subsequent analyses.
When measuring boom dominant frequency, we used a Hann type window, window size of 100 ms, 3 dB filter bandwidth of 14.4 Hz, DFT size of 8,192 samples, and grid spacing of 5.38 Hz. When measuring cackle, whine, and whoop dominant frequency, we used a Hann type window, window size of 50 ms, 3 dB filter bandwidth of 28.8 Hz, DFT size of 4,096 samples, and grid spacing of 10.8 Hz.
Nonlinearities
We evaluated vocalization spectrograms for the presence of 4 types of nonlinearities: frequency jumps, biphonations, subharmonics, and deterministic chaos as defined by Riede et al. (2004). We documented whether each type of nonlinearity was present or absent in each call. We evaluated only vocalizations with no background noise, or with background noise that occurred at a different frequency than the vocalization, because we did not want to confuse background noise with nonlinear elements.
