


Abstract.
A Brownian bridge movement model (BBMM) is a relatively new concept that estimates the path of an animal's movement probabilistically from data recorded at brief intervals. A BBMM assumes that locations are not independent, whereas the “classical” kernel-density estimator (KDE) assumes they are. We estimated BBMM home ranges for 11 Black Vultures (Coragyps atratus) and 7 Turkey Vultures (Cathartes aura) equipped with satellite transmitters near Marine Corps Air Station Beaufort, South Carolina, from October 2006 to November 2008. The 95% BBMM home ranges (95% BBMM) of the two Black Vultures that traveled >100 km from the capture site were 833 and 2111 km2; of the nine that did not travel as far, 95% BBMM ranged from 33 to 778 km2 and averaged (± SE) 243 ± 76 km2. The majority of Turkey Vultures (n = 6) traveled >100 km from the capture site with 95% BBMM ranging from 923 to 7058 km2 and averaging 3173 ± 1109 km2. We also estimated KDE home ranges, using newer satellite technology for comparison with previous studies. Overall 95% KDE ranged from 17 to 16066 km2 for the Black Vulture and 988 to 36257 km2 for the Turkey Vulture. The concept of an animal's home range has evolved over time, as have home-range estimators. With increasing use of satellite telemetry, application of BBMM can greatly enhance our understanding of home ranges, migration routes, seasonal movements, and habitat-use patterns of wild birds over large and often remote areas.
Resumen.
Un modelo de movimiento de puente browniano (MMPB) es un concepto relativamente nuevo que estima la probabilidad de la trayectoria de movimiento de un animal a partir de datos registrados en intervalos breves. Un MMPB asume que las localizaciones no son independientes, mientras que el estimador de densidad de núcleo (EDD) “clásico” asume que sí lo son. Estimamos rangos de hogar MMPB para 11 individuos de Coragyps atratus y siete de Cathartes aura equipados con transmisores satelitales cerca de la Estación Aérea del Cuerpo de Marines Beaufort, Carolina del Sur, desde octubre de 2006 hasta noviembre de 2008. El 95% de los rangos de hogar MMPB (95% MMPB) de dos individuos de C. atratus que viajaron >100 km desde el sitio de captura fue 833 y 2111 km2; de los nueve que no viajaron tan lejos, el 95% MMPB osciló entre 33 y 778 km2 y promedió (± EE) 243 ± 76 km2. La mayoría de los individuos de C. aura (n = 6) viajaron >100 km desde el sitio de captura con 95% MMPB oscilando entre 923 y 7058 km2 y promediando 3173 ± 1109 km2. También estimamos rangos de hogar EDD, usando nueva tecnología satelital para comparar con estudios previos. En total, el 95% EDD osciló entre 17 y 16066 km2 para C. atratus, y entre 988 y 36257 km2 para C. aura. El concepto del rango de hogar de un animal ha evolucionado a lo largo del tiempo, así como los estimadores del rango de hogar. Con un aumento en el uso de la telemetría satelital, la aplicación de MMPB pude aumentar enormemente nuestro entendimiento del rango de hogar, las rutas migratorias, los movimientos estacionales y los patrones de uso del habitat de las aves silvestres a través de áreas usualmente remotas.
Introduction
Recent advances in global positioning system (GPS) technology (i.e., satellite tracking) have allowed more frequent, consistent sampling of the positions of birds and mammals than was possible before the past decade (Sawyer et al. 2009, Avery et al. 2011, Prosser et al. 2011). Satellite tracking may produce thousands of temporally autocorrelated locations per unit time, which is not feasible with very-high-frequency (VHF) technology. Consequently, researchers are increasingly using satellite-tracking data to estimate the size and shape of animals' home ranges (Hemson et al. 2005, Bamford et al. 2007, Kie et al. 2010). Satellite-tracking data have also been used to quantify habitat use (Nielson et al. 2009), identify stopover areas (Sawyer et al. 2009, Kochert et al. 2011), delineate migration routes (Takekawa et al. 2010, White et al. 2010), and reconstruct movement paths (Witt et al. 2010).
Methods available to assess movements and home ranges were developed and refined with VHF technology (Mohr 1947). Home-range estimates with VHF were based on creating polygons surrounding the outermost points at which an animal was recorded (minimum convex polygon; Mohr 1947), on estimates of a bivariate normal home range for circular and noncircular ranges (bivariate normal models; Jennrich and Turner 1969), on the harmonic mean over an animal's area of use of arbitrary-sized grids (harmonic mean; Dixon and Chapman 1980), or on kernel density estimators (KDE) with locations presumed independent (kernels; Seaman et al. 1999). Although the size of areas occupied can be estimated, methods using locations recorded by VHF typically over- or underestimate this size, fail to differentiate between areas of high and low use, or fail to identify paths between heavily used portions of the home range (White and Garrott 1990, Kernohan et al. 2001).
Horne et al. (2007) investigated a method using temporally correlated locations recorded by satellite tracking that creates a utilization distribution quantifying the probability of use along a route. The Brownian bridge movement model (BBMM) uses locations recorded over brief intervals with known estimates of location error to predict trajectories of movement between successive locations (Horne et al. 2007). BBMMs have been applied to identify sites where black bears (Ursus americanus) cross highways (Lewis et al. 2011), “stopover” habitats used by migrating mule deer (Odocoileus hemionus) (Sawyer et al. 2009), and migration routes followed by caribou (Rangifer tarandus) (Horne et al. 2007). Among birds, BBMM has been applied to waterfowl movements in east Asia (Takekawa et al. 2010, Prosser et al. 2011) and to monitoring of the Osprey (Pandion haliaetus) population in North America (Farmer et al. 2010).
While equal intervals between successive relocations are not a requirement of BBMM, the method uses a Brownian bridge and a variance parameter to estimate the probability density that the animal used any particular grid cell, given its relocations, on the basis of time and distance (Horne et al. 2007). A variance parameter aids in this interpretation of shape in the resulting BBMM in that, for a given distance moved, the parameter will be large if points deviate from a straight line but will be small if points are exactly along a straight line. Use of a variance parameter thus provides an index of sinuosity of movement to be incorporated into the BBMM and estimate of home range not provided by methods strictly devoted to estimates of movement paths (i.e., correlated random walk; Kareiva and Shigesada 1983). Variability in distance and time lag between successive locations is not incorporated into most estimators of home range (i.e., KDE) but can be addressed in BBMM.
Although new estimators of home range, such as plug-in smoothing for KDE (Jones et al. 1996), local convex hull (Huck et al. 2008), and biased random bridge (Benhamou et al. 2011), have been explored for use in mammals, the long distances many birds travel in a short time have not been quantified with these methods. Use of satellite telemetry on large birds is integral to understanding their use of resources, movement corridors, and critical habitats, but no studies applying to birds the current home-range estimators tested on terrestrial mammals (Getz et al. 2007, Huck et al. 2008, Benhamou et al. 2011) have been published. Birds often range widely, as in the facultative migrations of mammals (Nelson 1995, Brinkman et al. 2005), which can last for a week or several months, making home-range estimation problematic because the birds may not migrate seasonally. During a study of the flight behavior and daily activity patterns of vultures, we documented short- and long-distance movements of Black Vultures (Coragyps atratus) and Turkey Vultures (Cathartes aura) equipped with GPS satellite transmitters (Avery et al. 2011). Here, using these vultures as model species, we explore the use of GPS satellite telemetry with BBMM to estimate individuals' home ranges. Using current fine-scale satellitetracking data, we also estimated these vultures' home ranges by KDE for comparisons with previous research that relied on VHF data or limited GPS data.
Methods
Study Area and Data Collection
Our study took place in and around Marine Corps Air Station Beaufort in Beaufort, South Carolina (32.4735° N, 80.7194° W; Fig. 1). The vegetation around Beaufort is predominately tidal marsh, upland conifer forest, and mixed conifer-hardwood forest (Beason et al. 2010). From September 2006 to September 2007, we captured 84 Black Vultures and 53 Turkey Vultures in a baited walk-in trap (9.3 × 3.1 × 1.8 m; Humphrey et al. 2000). We marked each vulture for visual identification with a uniquely coded white tag designed for cattle ears (Allflex, Inc., Dallas, TX) attached to the patagium of the right wing (Wallace et al. 1980, Sweeney et al. 1985). All birds were released where captured. We equipped 11 Black Vultures and 11 Turkey Vultures with 70-g solar-powered GPS satellite transmitters (PTT-100, Microwave Telemetry, Columbia, MD) with Teflon tape and a backpack harness (Humphrey et al. 2000). We set the transmitters' duty cycle to record latitude/longitude, altitude, speed, and direction every hour from dawn to dusk. The transmitters operated from 5 to 24 months (Fig. 2). We defined movements of >100 km from the capture site as long distance, those of <100 km as short distance.
Brownian Bridge Movement Model
Using the BBMM, we estimated home ranges as all areas a vulture occupied during the entire period GPS data were recorded, for comparisons to home ranges of the Black and Turkey Vultures estimated by DeVault et al. (2004). The BBMM requires (1) sequential location data, (2) estimated error associated with location data, and (3) grid-cell size assigned for the output utilization distribution. The BBMM is based on two assumptions: (1) location errors correspond to a bivariate normal distribution and (2) movement between successive locations is random, conditional on the starting and ending location. Normally distributed errors are common for GPS data, and 1 hr between locations likely ensured that movement between successive locations was random. The assumption of conditional random movement between paired locations, however, becomes less realistic as the time interval increases (Horne et al. 2007). For example, ensuring temporal and spatial autocorrelation of locations minimizes the likelihood that the random movement is anything other than random (e.g., directed towards a high-use area). The horizontal spatial accuracy of the GPS receiver, based on the manufacturer's technical specifications, was 15 m. We used this estimate of location error because we did not have an independent estimate for these data. Preliminary investigations revealed that size of home ranges according to the BBMM differed by <1.5% when we changed the GPS error from 15 m to 30 m and finally to 50 m. Using the BBMM package (http://cran.opensourceresources.org), we calculated BBMM in the R language for statistical computing (R Foundation for Statistical Computing, Vienna, Austria). We prepared 50% BBMM and 95% BBMM to represent the core area of use and the standard home-range size, respectively. Values reported are means ± SE.
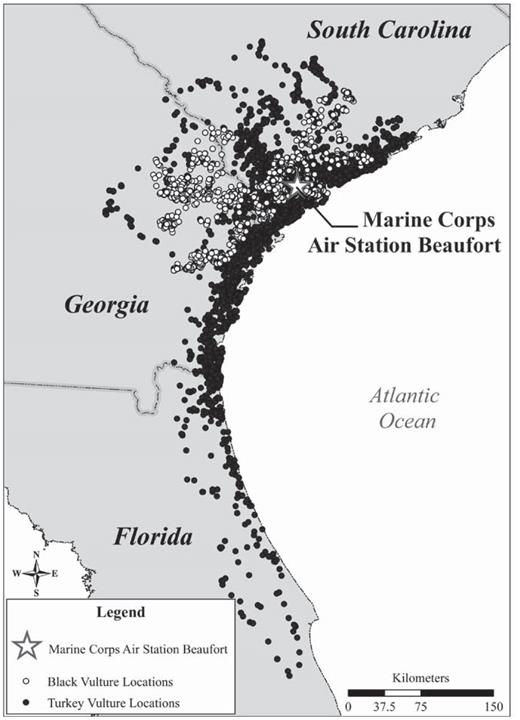
Locations of Black Vultures (white circles) and Turkey Vultures (dark circles) tagged at the Marine Corps Air Station Beaufort, South Carolina, showing movement of the Turkey Vulture to central Florida, 2006–2008.
Fixed-Kernel Home Range
For comparisons of satellite-telemetry movement data to results of previous studies in which KDE was calculated primarily from VHF data, we report 50% and 95% KDE to estimate the core area and overall home range (i.e., 50% KDE and 95% KDE), respectively, for each vulture. To address autocorrelation between points for KDE, we randomly subsampled 1000 locations for each vulture prior to estimating its home range (Swihart and Slade 1985, but see Fieberg 2007) because some smoothing parameters for KDE are not possible with the large volume of data that can be used in estimating BBMM (Walter et al. 2011). We used the fixed-KDE method because the fixed kernel incorporates the density of locations and has been considered more accurate at determining outer boundaries than the adaptive kernel (Worton 1995, Seaman et al. 1999). The amount of smoothing was determined by the reference bandwidth (href) in Home Range Tools (Rodgers and Kie 2010) in ArcGIS 9.3 (Environmental Systems Research Institute, Redlands, CA). We were unable to use biased cross-validation or least-squares cross-validation (hLSCV) bandwidths for KDE because of the large number of duplicate locations and the propensity of numerous points to cluster, all of which potentially caused Home Range Tools' smoothing parameter to default to href Previous studies have reported that href may oversmooth and that hLSCV may undersmooth KDE home ranges (Worton 1995, Seaman et al. 1999, Hemson et al. 2005). The lack of software to calculate KDE from GPS data with hLSCV and large sample sizes should be considered prior to use of hLSCV and was a further impetus for this study (Hemson et al. 2005, Walter et al. 2011).
Results
We identified and removed erroneous data points (e.g., 2-dimensional fixes, negative altitudes) and the four Turkey Vultures that were tracked for <5 months. We calculated home ranges for 11 Black Vultures and 7 Turkey Vultures with 48 498 and 60 145 locations, respectively. Home ranges estimated by BBMM for the Black Vulture (50%, 38 ± 12 km2; 95%, 467 ± 183 km2) were six times smaller than those for the Turkey Vulture (50%, 227 ± 104 km2; 95%, 2854 ± 990 km2; Fig. 3). Similarly, mean home ranges estimated by KDE for the Black Vulture (50%, 363 ± 214 km2; 95%, 2545 ± 1517 km2) were four and five times smaller than those of the Turkey Vulture (50%, 1621 ± 834 km2; 13 011 ± 5644 km2, respectively; Fig. 3). The BBMM's mean variance was 15 025 ± 2971 σ2m for the Black Vulture and 59 595 ± 8929 σ2m for the Turkey Vulture.
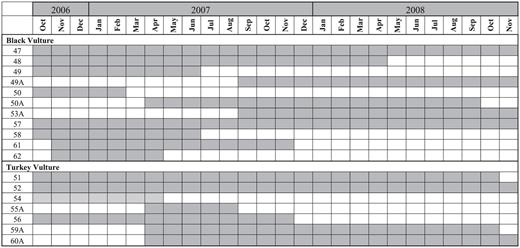
Lifetimes of GPS satellite transmitters attached to Black Vultures and Turkey Vultures at the Marine Corps Air Station Beaufort, South Carolina.
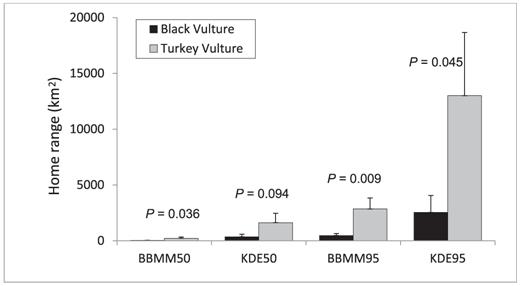
Mean home ranges of Black Vultures (dark gray bars; n = 11) and Turkey Vultures (light gray bars; n = 7) as estimated by Brownian bridge movement models (BBMM) and kernel density estimates (KDE) for 50% and 95% utilization distributions, from birds monitored from 5 to 24 months by GPS satellite telemetry. Capped vertical bars denote 1 standard error. P-values associated with oneway analyses of variance between the species are shown above each pair of bars.
For the nine Black Vultures and single Turkey Vulture that traveled <100 km from the trap site, the 50% (28 ± 7 km2) and 95% (313 ± km2) BBMM home-range estimates were two and three times smaller than the 50% (80 ±39 km2) and 95% (523 ± 243 km2) KDE estimates, respectively (Fig. 4). Among the two Black Vultures and six Turkey Vultures that made long-distance movements (>100 km from the trap site), the 50% (215 ± 91 km2) and 95% (2748 ± 867 km2) BBMM homerange estimates were eight times and five times smaller than the 50% (1818 ± 700 km2) and 95% (14 230 ± 4666 km2) KDE estimates, respectively (Fig. 4). Turkey Vultures that made long-distance movements included four that made round trips to southern Georgia or central Florida and one that remained around Beaufort except in July 2007 and July 2008, when it traveled 110–115 km north before returning to Beaufort 5–6 days later.
Discussion
Our study design and methods resulted in more reliable estimates of the sizes of the home ranges of both species of vultures than previously reported on the basis of KDE techniques. Our estimates were based on >1000 GPS locations per bird, our sampling protocol was independent of environmental conditions, and a greater number of vultures were monitored (Avery et al. 2011). Previous home-range estimates were based on fewer than 1000 locations for any vulture (Coleman and Fraser 1987, Arrington 2003, DeVault et al. 2004). Large birds can cover long distances in periods as short as 1 week to 1 month, which complicates comparison of the sizes of the birds' home ranges based on the traditional KDE or newer local convex hull (Getz et al. 2007, Huck et al. 2008). Alternatively, home range could be estimated by season, but large birds often move long distances within a season. BBMM in conjunction with satellite tracking has not been applied previously to the home range of any North America bird, although Farmer et al. (2010) identified corridors of movement of the Osprey with BBMM.
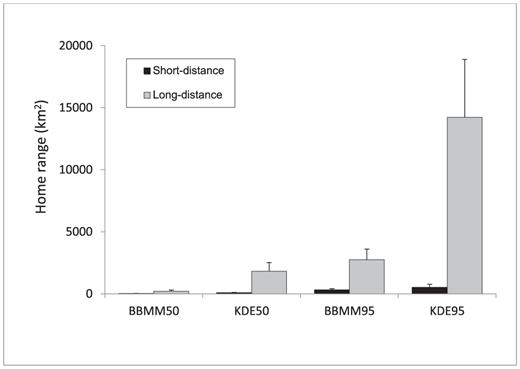
Mean home ranges of vultures that made short-distance (<100 km; n = 10) or long-distance (>100 km; n = 8) movements from their trap site. Vultures were monitored from 5 to 24 months by GPS satellite telemetry. Home range were estimated by Brownian bridge movement models (BBMM) and kernel density estimates (KDE) for 50% and 95% utilization distributions. Capped vertical bars denote 1 standard error.
The concept of BBMM is based on a Brownian bridge in which the probability of an animal's being in an area depends upon the time elapsed between the starting and ending locations, the animal's rate of movement, and the animal's tendency to wander away from a straight-line path (Bullard 1999, Home et al. 2007). Larger variations in movement trajectories or increasing the scale of movement from local to continental because of the species' behavioral differences will result in changes in BBMM variance. For example, this variance revealed that patterns of the Turkey Vulture's movement are more complex than those of the Black Vulture. This may have been due to most Turkey Vultures moving >100 km from the trap site, with some traveling to central Florida and back.
The ability of BBMM to predict paths of movement between sequential locations intuitively appears best suited for species that travel long distances within a season or over several months (Farmer et al. 2010, Takekawa et al. 2010, Prosser et al. 2011). The BBMM “fills in” the space between sequential locations. The resulting estimate is a function of the density of locations or paths in an area. For KDE, a kernel or bump is placed over each location, and the probability density at any point in space relies on summing all the kernels at each point (Home and Garton 2006). The density of and distance between kernels directly influences the amount of smoothing, regardless of selection of smoothing parameter, often resulting in this method oversmoothing or undersmoothing surfaces. In short, KDE attempts to “fill in” or predict the space between kernels without any information on the temporal lag between them. Numerous studies have concluded that because of the conservative nature of the technique, href oversmooths KDE home ranges, leading to overestimation of space use and the size of home ranges (Worton 1995, Seaman et al. 1999, Hemson et al. 2005). This difference may have resulted in the home ranges we estimated by KDE being larger.
Both KDE and BBMM projected home ranges extending over the Atlantic Ocean, sometimes by several kilometers, where the vultures were never actually recorded. This was more apparent in the 50% and 95% KDE (oversmoothing; Fig. 5a) than in the 50% and 95% BBMM for the same vulture (Fig. 5b). These observations and the propensity of KDE to undersmooth (plug-in smoothing parameter) or oversmooth (href smoothing parameter) raise serious doubts about use of KDE with satellite-tracking data (Walter et al. 2011). Getz et al. (2007) suggested using a nonparametric kernel method, the local convex hull, to generate utilization distributions and home ranges where a species' movements are constrained by hard boundaries (i.e., ridges, steep cliffs, fences), which for vultures is the ocean shoreline. The local convex hull may be able to account for hard boundaries within a home range, but it has not been documented to reliably estimate the size of home ranges in species covering large distances in short periods (Huck et al. 2008).
Advances in satellite tracking technology can yield an animal's location almost continuously and with greater spatial and temporal precision than can traditional VHF technology. Locations recorded at frequent intervals over the wide areas typical of large birds are ideal for BBMM and with highly correlated satellite tracking data probably estimate home ranges more accurately than KDE (Walter et al. 2011). Use of BBMM combines kernel-based estimates of utilization distributions (Worton 1989, Millspaugh et al. 2006), desired by many researchers, with the concept of correlated random walk and first-passage time (Kareiva and Shigesada 1983) to identify an animal's directed movements at the spatial scale required for resource selection by birds and mammals to be measured (Nams and Bourgeois 2004, Le Corre et al. 2008). Furthermore, BBMM may be able to identify important components of a species' biology such as migration routes (Hake et al. 2001, Meyburg et al. 2004, Farmer et al. 2010), sites of rookeries (King and Anderson 2005) and feeding (Bamford et al. 2007), and communal roosts (Avery et al. 2002). BBMMs define an area for analysis of these components of a species' biology that measures of directed movements (i.e., correlated random walk) do not.
In our study, BBMM enabled comparisons of estimates of the home ranges of individual vultures with varying propensity for long-distance movement. Although estimates of home ranges with KDE enabled comparisons with previous studies (but see Kernohan et al. 2001), KDE may not be suitable for some species and datasets (i.e., animals that travel long distances and voluminous datasets). Furthermore, an important aspect of BBMM is its ability to identify “hotspots” and corridors that animals use extensively, as has been previously documented in birds and mammals (Sawyer et al. 2009, Farmer et al. 2010, Takekawa et al. 2010). Preliminary results revealed several vultures using municipal landfills near Beaufort within the 50% BBMM, suggesting likely food sources in this area. Perhaps analogous to first-passage time (Fauchald and Tveraa 2003), space-use paths created by BBMM can indicate a focal area of use along corridors of migration. As technological advances in telemetry create new opportunities for data collection, alternatives for presenting data on large birds in the most useful manner should continue to be explored.
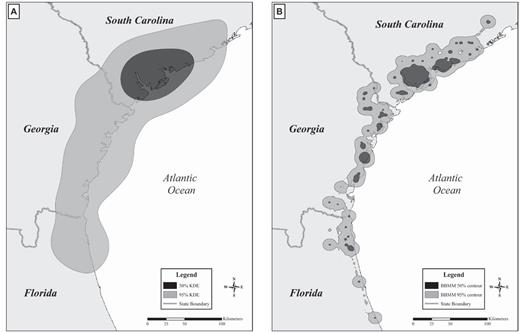
Extent of (A) 50% and 95% fixed-kernel density estimates (KDE) of home ranges and (B) 50% and 95% Brownian bridge movement models (BBMM) for Turkey Vulture #54 equipped with a GPS satellite transmitter at Marine Corps Air Station Beaufort, South Carolina, 2006–2008.
Acknowledgments
Funding was provided by the U. S. Navy, Southern Division, Naval Facilities Engineering Command, and the National Wildlife Research Center. We appreciate the field assistance provided by J. S. Humphrey, T. S. Daughtery, M. P. Milleson, E. A. Tillman, and W. E. Bruce. We thank Ryan Neilson for assistance with the –R software BBMM package. Care and use of all vultures associated with this study were approved by the National Wildlife Research Center's Animal Care and Use Committee (protocol QA-1394).
Literature Cited
