


Abstract.
Since the late 18th century bird populations residing in the Aleutian Archipelago have been greatly reduced by introduced arctic foxes (Alopex lagopus). We analyzed data from microsatellite, nuclear intron, and mitochondrial (mtDNA) loci to examine the spatial genetic structure, demography, and gene flow among four Aleutian Island populations of the Common Eider (Somateria mollissima) much reduced by introduced foxes. In mtDNA, we found high levels of genetic structure within and between island groups (ΦST = 0.643), but we found no population subdivision in microsatellites or nuclear introns. Differences in genetic structure between the mitochondrial and nuclear genomes are consistent with the Common Eider's breeding and winter biology, as females are highly philopatric and males disperse. Nevertheless, significant differences between islands in the mtDNA of males and marginal significance (P = 0.07) in the Z-linked locus Smo 1 suggest that males may also have some level of fidelity to island groups. Severe reduction of populations by the fox, coupled with females' high philopatry, may have left the genetic signature of a bottleneck effect, resulting in the high levels of genetic differentiation observed in mtDNA (ΦST = 0.460–0.807) between islands only 440 km apart. Reestablishment of the Common Eider following the fox's eradication was likely through recruitment from within the islands and bolstered by dispersal from neighboring islands, as suggested by the lack of genetic structure and asymmetry in gene flow between Attu and the other Near Islands.
Resumen.
Desde finales del siglo 18, las poblaciones de aves que residen en el archipiélago aleutiano han sido diezmadas por la introducción del zorro del ártico (Alopex lagopus). Analizamos datos de microsatélites, intrones nucleares y loci mitocondriales (ADNmt) para examinar la estructura genética espacial, la demografía y el flujo génico en las islas Aleutianas entre cuatro poblaciones de Somateria mollissima muy reducidas por los zorros introducidos. Encontramos altos niveles de estructura genética dentro y entre grupos de islas (ΦST = 0.643) en ADNmt, pero no encontramos subdivisiones poblacionales en los microsatélites o los intrones nucleares. Las diferencias en estructura genética entre los genomas mitocondriales y nucleares son consistentes con la biología reproductiva e invernal de S.mollissima, ya que las hembras son altamente filopátricas y los machos se dispersan. Sin embargo, las diferencias significativas entre islas en el ADNmt de los machos y la significancia marginal (P = 0.07) en el locus Smo1 ligado a Z sugiere que los machos pueden también tener algún nivel de fidelidad a los grupos de islas. Una reducción severa de las poblaciones debido al zorro, sumada a la alta filopatría de las hembras, puede haber dejado la señal genética de un efecto de cuello de botella, dando como resultado los altos niveles de diferenciación genética que se observan en el ADNmt (ΦST = 0.460–0.807) entre islas separadas por tan solo 440 km. El restablecimiento de S. mollissima luego de la erradicación del zorro se dio probable mente por reclutamiento desde dentro de las islas y estuvo reforzado por dispersión desde las islas vecinas, como sugiere la falta de estructura genética y la asimetría en flujo génico entre Attu y las otras Islas Near.
Introduction
The Aleutian Archipelago is a volcanic island chain stretching over 1800 km across the North Pacific Ocean (from 165° W to 170° E; Fig. 1). The chain provides the only terrestrial habitat in a largely oceanic region and is an important nesting and winter locale for marine birds such as seabirds and waterfowl (Gibson and Byrd 2007). Isolation has likely promoted genetic diversification; many taxa within the archipelago comprise phenotypically (e.g., Gibson and Byrd 2007, Cook et al. 2010, Pruett et al. 2010) and genetically distinct populations (e.g., Patirana et al. 2002, Pruett and Winker 2005a, b, Pruett et al. 2008,2010). Furthermore, concordance in genetic structure among species has led researchers to hypothesize that the Aleutian Islands harbored cryptic Pleistocene glacial refugia (Pruett and Winker 2005a, 2008, Pruett et al. 2010).
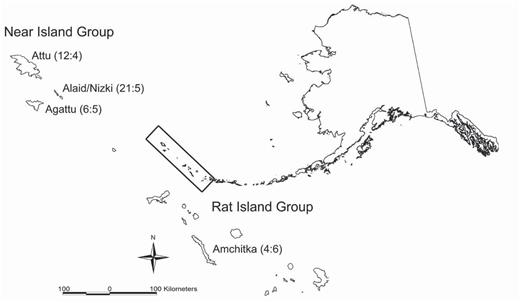
Locations of Common Eiders sampled on the Aleutian Islands, Alaska, with sample sizes shown as sex ratios (male: female) in parentheses.
Like many island ecosystems, most of the Aleutian Island archipelago was free of indigenous terrestrial mammals (Hopkins 1967, Bailey 1993), at least west of the Fox Island group (170° W). Soon after the first arrival of European explorers in the late 1700s, however, arctic foxes (Alopex lagopus) were introduced to the western Aleutian Islands for the fur trade (Black 1984, Bailey 1993). By 1930, foxes were released on most of the islands in the archipelago, and their predation severely reduced or extirpated bird populations including local breeding populations of the Common Eider (Somateria mollissima v-nigrum) (Bailey 1993, Ebbert and Byrd 2002, Gibson and Byrd 2007).
The Common Eider breeds in the Arctic and subarctic and has a circumpolar distribution in coastal marine habitats (Goudie et al. 2000). Although Common Eider populations were dramatically reduced by introduced foxes, local populations quickly rebounded after foxes were removed from certain islands (Byrd et al. 1994, 2005, Gibson and Byrd 2007). While most populations are migratory to varying degrees (Goudie et al. 2000), Common Eiders that breed on the Aleutian Islands overwinter in adjacent nearshore waters and are thought to be nonmigratory (Gibson and Byrd 2007). Female eiders are highly philopatric (Goudie et al. 2000). As a likely consequence, Common Eiders demonstrate fine-scale spatial genetic structure wherever they have been studied (Tiedemann et al. 1999, Sonsthagen et al. 2007, 2009, 2011). Furthermore, female Common Eiders nest in kin groups, which results in microgeographic genetic structure within populations and among females in adjacent nests (McKinnon et al. 2006, Sonsthagen et al. 2010).
Most of the Aleutian Islands are now part of the Alaska Maritime National Wildlife Refuge (AMNWR), and management has included a program to remove introduced foxes (Bailey 1993, Ebbert and Byrd 2002). Rapid declines in Common Eider populations after fox introductions (probably leading to extirpation in some cases) were followed by expansion after fox eradication (possibly involving recolonization from neighboring islands) that may have erased any genetic signature of former population subdivision. Here we investigate the spatial genetic structure and population demography of an Aleutian Island resident, the Common Eider, by using three marker types with contrasting modes of inheritance. Our specific goals were to assess (1) the extent of population genetic structure within and between island groups and (2) the directionality of gene flow between populations that were reduced by introduced arctic foxes.
Methods
Sample Collection
Adult Common Eiders (n = 63) were collected in the nearshore waters of four of the Aleutian Islands comprising two island groups: the Near Islands (Agattu, Alaid/Nizki, and Attu islands) in the westernmost part of the archipelago and the Rat Islands (Amchitka Island), located in the west-central region of the Aleutians (Fig. 1). The Common Eider's distribution in the Aleutian Archipelago is uneven; the species is more abundant in the western and central portions than in the eastern portion (Gibson and Byrd 2007). Our samples were thus collected from the western and eastern limits of the center of abundance in the Aleutian Archipelago. Distances between islands range from 40 km within island groups to 440 km between island groups (Fig. 1). All sampled islands are now fox free. Foxes were eradicated from Agattu (Henry and Snigaroff 1977) and Alaid/Nizki in the 1970s (Kellyhouse and Viers 1976), Amchitka in 1960 (Bailey 1993), and the last fox was removed from Attu in 2000 (Thomson and Ebbert 2005). Common Eiders were collected during the breeding season, 26 May—12 June 1993 from the Near Islands, 3 July—3 August 1993 from Amchitka, 3 May 2001–29 May 2001 from Attu, and 10 May—1 June 2004 from Attu. Birds collected from the Near Islands were observed as mated pairs; five of the females (n = 5/14) had an egg in the oviduct, indicating locally breeding birds. Fourteen individuals collected from Attu and one individual collected from Alaid are vouchered and housed at the University of Alaska Museum, Fairbanks. Samples from the remaining individuals are archived at the Molecular Ecology Laboratory, USGS Alaska Science Center, Anchorage.
Laboratory Techniques
We recorded genotype data from 12 autosomal microsatellite loci (Aph08, Aph20, Aph23: Maak et al. 2003; Bca1, Bca11, Hhi3:Buchholz et al. 1998; Sfiµ10: Libants et al. unpubl. data, GenBank accession AF180500; Smo4, Smo7, Smo8, Smo10, and Smo12: Paulus and Tiedemann 2003) and one Z-linked microsatellite locus (Smo1: Paulus and Tiedemann 2003, Sonsthagen 2006). We recorded sequences from the mtDNA control region (545 bp; Sonsthagen et al. 2007), 280 base pairs of intron 3 of lamin A (LMNA), and 386–387 base pairs of intron 11 of glyceraldehyde-3-phosphate dehydrogenase (GAPDH: McCracken and Sorenson2005).
Genomic DNA was isolated from frozen tissues. Methods for DNA extraction, polymerase chain reaction (PCR) amplification, and DNA sequencing are described in Sonsthagen et al. (2007). For quality control, 10% of samples were randomly selected, reamplified, and genotyped in duplicate. Sequences and their corresponding catalog numbers at the University of Alaska Museum and Alaska Science Center are accessioned in GenBank (EU019596, HQ695040—HQ695087, HQ695312— HQ695315, HQ695687—HQ695731, KC171401—KC171432).
Statistical Analyses
Estimation of genetic diversity. Using PHASE 2.0 (Stephens et al. 2001), we inferred allelic phases of nuclear introns LMNA and GAPDH from diploid sequence data. PHASE uses a Bayesian approach to reconstruct haplotypes from population genotypic data and allows for recombination and the decay of linkage disequilibrium with distance. PHASE has been demonstrated to reliably infer the allelic phase of heterozygous sequences (Harrigan et al. 2008). The PHASE analysis (1000 iterations with a 1000 burn-in period) was repeated three times, and reconstructions were consistent across runs.
We calculated allelic frequencies, allelic richness, inbreeding coefficient (FIS), and expected and observed heterozygosities for autosomal microsatellite loci in FSTAT 2.9.3 (Goudet 1995). Hardy—Weinberg equilibrium and linkage disequilibrium for autosomal microsatellite loci were tested in GENEPOP 3.1 (Raymond and Rousset 1995; Markovchain parameters: dememorization number 1000; number of batches 100, and number of iterations per batch 10 000). We adjusted significance levels on the basis of Bonferroni correction (α = 0.05). Only females were analyzed for the Z-linked locus Smo1, so we could not test for Hardy—Weinberg equilibrium and linkage disequilibrium. We tested sequence data for selective neutrality with Fu's Fs(Fu 1997) and Tajima's D (Tajima 1989) in ARLEQUIN 2.0 (Schneider et al. 2000). For critical significance, values of 5% required a P-value below 0.02 for Fu's FS (Fu 1997). We constructed an unrooted phylogenetic network for each gene in NETWORK 4.1.0.8 (Fluxus Technology, Ltd.) by the median-joining method (Bandelt et al. 1995), to illustrate possible reticulations in the gene trees due to homoplasy or recombination.
Estimation of population subdivision. We assessed population subdivision among sampled islands and island groups by calculating FSTfrom microsatellite data and ΦST from sequence data in ARLEQUIN, adjusting for multiple comparisons by using Bonferroni corrections (α = 0.05). We calculated pairwise ΦST values for the sequence data by using the model of Tamura and Nei (1993) with an invariant site (TrN +I) parameter, as determined in MODELTEST 3.06 (Posada and Crandall 1998) under the Akaike information criterion (Akaike 1974). We used POWSIM 4.1 (Ryman and Palm 2006) to assess the statistical power of detecting population genetic structure on the basis of the microsatellite data set and sample sizes assayed. We ran simulations in POWSIM (1000 dememorizations, 100 batches, 1000 iterations per batch, 1000 runs) with allele frequencies observed within the Aleutian Islands for the 12 microsatellite loci with the same sample sizes used in the present study. We performed five simulations with varying effective sizes (Ne = 50, 100, 200, 300, 400, 500, and 500) at 10 generations to test statistical power.
To detect the occurrence of population structure without a priori knowledge of putative populations, we analyzed microsatellite data in STRUCTURE 2.1 (Pritchard et al. 2000), using an admixture model assuming correlated frequencies to probabilistically assign individuals to putative populations (10 000 burnin period, 100 000 Markov-chain Monte Carlo iterations) with the number of possible populations (K) ranging from 1 to 5. We repeated this analysis five times, and runs were consistent. The K that maximized the likelihood given the data determined the most likely number of clusters (Pritchard et al. 2000).
For an isolation-by-distance analysis we used IBD, version 3.15 (Jensen et al. 2005), with genotypic data from microsatellite loci and nuclear introns and sequence information from mtDNA data, to determine whether more geographically distant pairs of populations are also more genetically differentiated. IBD tests the statistical significance of the relationship between genetic and geographic distance with a Mantel test.
Analysis of population demography. We assessed evidence for historical fluctuations in population size by using BOTTLENECK 1.2.02 (Cornuet and Luikart 1996) for microsatellite loci and LAMARC (Kuhner et al. 1995) for sequence data. Bottleneck compares the number of alleles and gene diversity at polymorphic loci under the infinite-allele and stepwise-mutation models. Simulation data indicate that the former may detect weak population bottlenecks better than the latter, and empirical data suggest the stepwise-mutation model may be less sensitive for detecting recent population declines (Cornuet and Luikart 1996). Therefore, differences in population fluctuations between mutation models may reflect differences in population size over evolutionary time, with the infinite-allele model detecting more recent population decline and the stepwise-mutation model detecting long-term population growth (Sonsthagen et al. 2007). To evaluate the robustness of results, we ran 1000 simulations for each population and changed parameters among five runs. We assessed significance with a Wilcoxon sign-rank test, which determines if the average of standardized differences between observed and expected heterozygosities is significantly different from zero (Cornuet and Luikart 1996). A significant deficiency of heterozygotes relative to the number of alleles indicates recent population growth, whereas an excess of heterozygotes relative to the number of alleles indicates a recent population bottleneck (Cornuet and Luikart 1996). It is important to note that BOTTLENECK compares the deficiency and excess of heterozygotes relative to genetic diversity, not to expectation under Hardy—Weinberg equilibrium (Cornuet and Luikart 1996).
LAMARC estimates a population-growth parameter, g, by using the coalescent and a Markov-chain Monte Carlo genealogy sampler. Maximum-likelihood parameters included ten short chains with 200 out of 4000 sampled trees, and three long chains with 20 000 out of 400 000 sampled trees. Data were analyzed three times, and parameter estimates converged. Positive values of g indicate population growth, whereas negative values indicate population decline. Because this method incorporates aspects of genealogy, it is sensitive to changes in demography and may have an upward bias (Kuhner et al. 1998). Therefore, we used the 99.9% confidence intervals for g to test for significant differences from zero (Waltari and Cook 2005).
Analysis of gene flow. We estimated gene flow between the two island groups (Near Islands and Rat Islands) in bayesass version 1.3 (Wilson and Rannala 2003) and MIGRATE version 3.0.3 (Beerli and Felsenstein 1999, 2001) as well as among islands on the basis of mtDNA in MIGRATE. These programs differ in the models by which they estimate gene-flow rates. BAYESASS uses an assignment method and does not incorporate genealogy. MIGRATE, in contrast, uses a steady-state two-island coalescent model of population differentiation, which incorporates two parameters scaled to the mutation rate: the parameter θ of effective population size (4Neµ) and the rate M (m/µ) of gene flow between populations. Estimates of gene flow can thus be interpreted differently and at different temporal scales. bayesass reflects gene flow that occurred only in the past several generations, whereas in MIGRATE gene-flow estimates are averaged over the past n generations, where n equals the number of generations the populations have been at mutation-drift equilibrium. Furthermore, since the primary mutation mechanism of microsatellite repeat units and nucleotide substitutions differs (Hancock et al. 1999) (see Sonsthagen et al. 2012), results based on mtDNA sequence data provide us with a relatively deeper historical signature than do microsatellite fragment data (see Wang 2010), whereas microsatellite loci reflect coalescences at more evolutionarily recent time scales than does mtDNA (Degnan et al. 1999).
We analyzed the microsatellite data set in bayesass with the default delta values for allelic frequency, migration rate, and inbreeding. Subsequent analyses incorporated different delta values to ensure that proposed changes between chains at the end of the run were between 40 and 60% of the total chain length (Wilson and Rannala 2003). Once delta values (ΔP = 0.16, Δm = 0.07, and ΔF =0.2) were within the accepted proportion of proposed changes (P = 57%, m = 57%, and F = 51%), we analyzed the data three additional times (300 000 000 iterations, 60 000 000 burn-in, and sampling frequency of 2000) with different random seeds, and parameters converged. The Z-linked locus Smo1 was not included in these analyses because it is the only microsatellite marker in its class.
We ran MIGRATE with a full migration model, estimating θ and M individually from the data and comparing them to a restricted model for which θ was averaged and M was symmetrical in both populations. Analyses using mtDNA were based on sequences from female Common Eiders only. We estimated gene flow with maximum-likelihood search parameters: ten short chains (2000 trees used out of 400 000 sampled), five long chains (10 000 trees used out 2 000 000 sampled), and five adaptively heated chains (start temperatures: 1, 1.5, 3, 6, and 12; swapping interval = 1). Models were run three times until parameter estimates converged. We used a log-likelihood ratio test (Beerli and Felsenstein 2001) to evaluate the alternative model (symmetric vs. asymmetric) for goodness-of-fit given the data.
Results
Genetic Diversity
In the 63 Common Eiders we examined, the number of alleles per microsatellite locus ranged from 2 to 25, with an average of 7.2 alleles per locus; genetic-diversity indices by locus are provided in Sonsthagen et al. (2010). The average number of alleles per population ranged from 4.0 to 5.8 (Table 1). Allelic richness ranged from 3.8 to 4.4 with an overall value of 4.3. The observed heterozygosity ranged from 44 to 53% for each population with an overall observed heterozygosity of 50% (Table 1). The inbreeding coefficient (FIS) ranged from -0.012 to 0.125 across sampled sites with an overall mean of 0.047. None of the inbreeding coefficients was significantly different from zero (P > 0.05). All populations were in Hardy—Weinberg equilibrium and linkage equilibrium, and no signature of linkage disequilibrium was detected between any pair of loci. In 20 females, we observed three alleles of Z-linked Smo1. Haplotype diversity ranged from 0.000 to 0.700 (Table 1). The number of alleles per population ranged from 1 to 3 (Table 1).
Sixteen unique alleles from 57 individuals were reconstructed for LMNA (Fig. 2A, Table 2) across 12 variable sites, and 13 alleles were reconstructed from 60 individuals with 13 variable sites, including an insert/deletion for GAPDH (Fig. 2B, Table 2). Observed heterozygosity for LMNA and GAPDH ranged from 57 to 100% and 81 to 100%, respectively, which did not deviate from Hardy—Weinberg equilibrium (P < 0.05). Values of Fu's FS and Tajima's D were negative for Amchitka (Table 1), suggesting population growth.
We identified five unique mtDNA haplotypes, characterized by five variable sites, from 56 individuals. Haplotype (h) and nucleotide (π) diversity ranged from 0.000 to 0.648 and 0.000 to 0.002, respectively (Table 1). The number of mtDNA haplotypes per population ranged from 1 to 4. The value of Tajima's D for Attu was negative (Table 1), suggesting population growth.
Population Subdivision
Overall population subdivision was not significant for most autosomal and Z-linked microsatellite loci, and for microsatellite loci, no differences between islands in FST were significant (Table 3). However, we observed significant genetic structuring of mtDNA, with ΦST ranging from 0.19 within island groups to 0.87 between island groups (Table 3). Inter-island comparisons of the nuclear intron LMNA also revealed significant differences in ΦST between Alaid/Nizki and Attu islands and between Amchitka and Attu islands, though we observed no significant variations in allelic frequencies for GAPDH (Table 3). The differences between the Near (Agattu, Alaid/Nizki, and Attu) and Rat (Amchitka) island groups were not significant in any nuclear marker type (microsatellites: FST= 0.006,P = 0.25; LMNA: ΦST = 0.006,P = 0.30, GAPDH: ΦST = 0.014, P = 0.19), although Smo1 tended toward significance (FST = 0.219, P = 0.07). STRUCTURE did not uncover genetic partitioning within these populations; the likelihood was maximized when K = 1. Simulations in POWSIM revealed significant power (> 90%) for detecting genetic differentiation, FST = 0.012–0.096, for effective sizes ranging from 400 to 50, respectively. Simulations based on effective sizes greater than 500 had low power. In all cases, the alpha error remained below the expected α= 0.05.
Estimates of genetic diversity, including; observed (Ho) and expected (He) heterozygosity, nucleotide (π) and haplotype (h) diversity, number of alleles and haplotypes per population, allelic richness, and sample size (n) assayed from Common Eiders for 12 microsatellite loci, Z-linked microsatellite Smo1, nuclear introns, LMNA and GAPDH, and mtDNA control region. Significanta values of Fu's Fs and Tajima's D are marked with an asterisk.
Estimates of genetic diversity, including; observed (Ho) and expected (He) heterozygosity, nucleotide (π) and haplotype (h) diversity, number of alleles and haplotypes per population, allelic richness, and sample size (n) assayed from Common Eiders for 12 microsatellite loci, Z-linked microsatellite Smo1, nuclear introns, LMNA and GAPDH, and mtDNA control region. Significanta values of Fu's Fs and Tajima's D are marked with an asterisk.
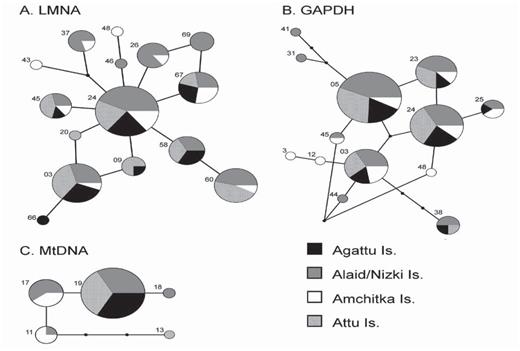
Networks illustrating relationships of (A) 16 LMNA alleles, (B) 13 GAPDH alleles, and (C) five mtDNA control region haplotypes from Common Eiders breeding on the Aleutian Islands, Alaska. Small black squares indicate intermediate ancestral alleles that were not sampled. The size of the node corresponds to its frequency. Numbers correspond to allele/haplotype names.
In contrast to those in microsatellite loci, differences between islands in ΦST were significant between Amchitka and all other islands and between Alaid/Nizki and all other islands (Table 3). A regional comparison between the Near and Rat island groups also uncovered high levels of genetic subdivision (ΦST = 0.548, P < 0.001; female ΦST= 0.740, P < 0.001; male ΦST = 0.615, P < 0.001). When we analyzed females and males separately the pattern was similar, except observed levels of genetic structure were generally higher in the female-only comparisons and differences within the Near Island group were no longer significant (Table 3).
Sequence length, number of variable sites, number of reconstructed alleles, proportion of homozygous individuals (Ho, %), proportion of individuals heterozygous at one site (Hets, %), background recombination rate (ρ), factors exceeding the ρ estimated in PHASE, and the probabilities of reconstructed haplotypes for nuclear introns LMNA and GAPDH sequenced from Common Eiders (Somateria mollissima).
Sequence length, number of variable sites, number of reconstructed alleles, proportion of homozygous individuals (Ho, %), proportion of individuals heterozygous at one site (Hets, %), background recombination rate (ρ), factors exceeding the ρ estimated in PHASE, and the probabilities of reconstructed haplotypes for nuclear introns LMNA and GAPDH sequenced from Common Eiders (Somateria mollissima).
Consistent with the inter-island comparisons of genetic structure with the autosomal and Z-linked loci, there was no correlation between genetic (FST) and geographic distances (microsatellite FST: r = 0.20, P = 0.49; Smo1 FSTr = -0.36, P = 0.71; introns FST: r = 0.80, P = 0.21), nor was there a significant correlation for the mtDNA sequence data (ΦST: r = 0.88, P = 0.12). Lack of a significant correlation, therefore, fails to support an inference of increasing genetic isolation with geographic distance across marker types. However, the high rvalue and the P value tending toward significance observed for the correlations based on mtDNA and nuclear introns is suggestive of increasing genetic isolation with distance.
Population Demography
We found evidence for historical fluctuations in population size within individual islands and for the Aleutian Islands as whole across marker types. In the infinite-allele model, Attu showed evidence of recent population decline (heterozygote excess), consistent with the presence of foxes on Attu until 2000. Alaid/Nizki and Amchitka demonstrated signals of population growth (heterozygote deficiency) under the stepwise-mutation model (Table 4). Nuclear intron sequences gave evidence for population growth on Amchitka, and mtDNA sequence data gave evidence for growth on Alaid/Nizki (Table 4). The Aleutian Island population as a whole exhibited a signature of population growth across marker types (Table 4).
Pairwise and overall FST and ΦST calculated from 12 microsatellite (µsat) loci, Z—linked microsatellite locus Smo1, nuclear introns LMNA and GAPDH, and mtDNA control region estimated from Common Eiders breeding on the Aleutian Islands, Alaska. Significant inter-island variances are marked with an asterisk (α = 0.05).
Pairwise and overall FST and ΦST calculated from 12 microsatellite (µsat) loci, Z—linked microsatellite locus Smo1, nuclear introns LMNA and GAPDH, and mtDNA control region estimated from Common Eiders breeding on the Aleutian Islands, Alaska. Significant inter-island variances are marked with an asterisk (α = 0.05).
Gene Flow
We estimated gene flow between the Near (Agattu, Alaid/Nizki, and Attu) and Rat (Amchitka) island groups on the basis of our inference of genetic partitioning in mtDNA across marker types. Gene flow was asymmetrical, though its directionality varied by marker types and method and thus temporal scale.
We estimated asymmetrical gene flow from the 12 microsatellite loci in bayesass, which suggested more effective migrants per generation from the Near Islands to the Rat Islands (m = 0.28) than from the Rat Islands to the Near Islands (m = 0.01). The Near Islands had a proportion of individuals in each generation that were not migrants (0.98) higher than that the Rat Islands (0.72; Table 5). Gene flow, as estimated from the 12 microsatellite loci in MIGRATE, showed the opposite pattern, being higher from the Rat Islands to the Near Islands (Nem = 7.5) than vice versa (Nem = 2.5; Table 5). Geneflow estimates based on the nuclear intron data in MIGRATE had a signal consistent with the bayesass estimates, in that more individuals dispersed from Near Islands to the Rat Islands (Nem = 32.8) than from the Rat Islands to the Near Islands (Nem = 14.2; Table 5). The variances and the means estimated from the mtDNA control-region sequence in MIGRATE indicate that, on average, gene flow has been greater from the Rat Islands to the Near Islands (Nfm = 5.0) than vice versa (Nfm = 0.7; Table 5).
Results of demographic analyses for 12 microsatellite loci under the infinite-allele model (IAM) and stepwise-mutation model (SMM) and sequence data. Parameter estimates θ (4Neµ for nuclear DNA, 2Nfµ for mtDNA), exponential growth rate (g) with 95% confidence intervals in parentheses for each Common Eider population. Significant growth estimates are marked with an asterisk.
Results of demographic analyses for 12 microsatellite loci under the infinite-allele model (IAM) and stepwise-mutation model (SMM) and sequence data. Parameter estimates θ (4Neµ for nuclear DNA, 2Nfµ for mtDNA), exponential growth rate (g) with 95% confidence intervals in parentheses for each Common Eider population. Significant growth estimates are marked with an asterisk.
Gene flow estimated from assignment (total number of migrants, m) in BayesAss and the coalescent model (number of migrants per generation Nem or Nfm) in MIGRATE between Common Eiders breeding on the Near (Agattu, Alaid/Nizki, and Attu) and Rat (Amchitka) island groups in the Aleutian Islands, Alaska, calculated from 12 microsatellite loci, two nuclear introns, and the mtDNA control region. Parameter estimates are listed for each population pair, as well as the directionality of gene flow between population pairs (east and west) assigned from 95% confidence intervals (in parentheses).
Gene flow estimated from assignment (total number of migrants, m) in BayesAss and the coalescent model (number of migrants per generation Nem or Nfm) in MIGRATE between Common Eiders breeding on the Near (Agattu, Alaid/Nizki, and Attu) and Rat (Amchitka) island groups in the Aleutian Islands, Alaska, calculated from 12 microsatellite loci, two nuclear introns, and the mtDNA control region. Parameter estimates are listed for each population pair, as well as the directionality of gene flow between population pairs (east and west) assigned from 95% confidence intervals (in parentheses).
Gene flow among islands estimated with mtDNA sequence data in MIGRATE revealed asymmetrical gene flow between Agattu and Attu, higher from Agattu to Attu (Nfm = 17.3, 95% CI 5.4–65.1) than vice versa (Nfm = 0.7, 95% CI 0.4– 2.7). Gene flow between Alaid/Nizki and Attu appeared symmetrical on the basis of overlapping 95% confidence limits (Attu to Alaid/Nizki Nfm = 1.7, 95% CI 0.1–13.2; Alaid/Nizki to Attu Nfm = 1.0, 95% CI 0.1–9.6).
The full model had likelihoods significantly higher than those of the restricted model across all marker types, indicating significant asymmetric gene flow has occurred among Common Eiders of the Aleutian Island archipelago for the two-population model [microsatellites In L(full) = -75.8, In L(test) = -258.7, P < 0.001; introns In L(full) = 4.3, In L(test) = -36.3, P < 0.001; mtDNA In L(full) = 83.4, In L(test) = 77.7, P = 0.02] as well as the four-population model [mtDNA In L(full) = 22.3, In L(test) = -282.3, P < 0.001].
Discussion
Population Genetic Structure
Although most inter-island comparisons based on mtDNA control region suggested some spatial genetic structure, we observed few, if any, significant differences at autosomal and Z-linked nuclear loci. Lack of genetic structuring based on nuclear DNA estimates coupled with less partitioning in mtDNA for males than for females is consistent with the Common Eider's breeding biology. While female eiders are highly philopatric, males disperse among colonies (Goudie et al. 2000); in the Netherlands, breeding males disperse up to 1700 km, and young males disperse up to 1200 km (Swennen 1990). Pair formation occurs during nonbreeding months, and male eiders follow females back to breeding sites (Goudie et al. 2000). Although little is known about the Common Eider's winter biology in the Aleutian Islands, pair formation likely occurs within groups of eiders composed of resident females from the particular island group where they breed and males from any island group within the Aleutian Archipelago (Gibson and Byrd 2007; M. Petersen, pers. obs.). Given large dispersal distances reported for other populations, male Common Eiders could easily disperse throughout the Aleutian Archipelago, leading to genetic similarity within the nuclear genome among islands and island groups. However, we found significant inter-island differences in males' mtDNA, and differences in the Z-linked locus Smo1 were marginally significant. Despite an inference of continuing gene flow based on autosomal markers, sex-linked loci suggest that males may exhibit fidelity to island groups, though we can infer site fidelity only in the previous generation (see Lanctot et al. 1999).
High genetic substructuring among islands based on mtDNA estimates may be attributable, in part, to a bottleneck effect coupled with females' high degree of philopatry. Introduction of the fox reduced bird populations throughout the Aleutians. In 1975, just several hundred Common Eiders were observed on Alaid/Nizki and Attu (Byrd et al. 1994, Gibson and Byrd 2007), and no nests were observed on Nizki (Byrd et al. 1994). Once foxes were removed in 1976, Common Eider populations quickly rebounded, with over 2500 birds observed on Alaid/Nizki within 10 years after fox removal (Byrd et al. 1994, Gibson and Byrd 2007) and more than 200 nests observed on Nizki in 1992 (Byrd et al. 1994). The decrease in population sizes from fox introductions coupled with females' high philopatry could have accelerated the development of genetic structure among islands due to genetic drift. This is exemplified by the high levels of genetic differentiation in mtDNA (ΦST up to 0.807) observed between Common Eider populations 440 km apart.
Nonsignificant differences between birds of Attu and those of the other Near Islands and the genetic signature of a population decline on Attu are consistent with the longer presence of foxes on Attu (until 2000) and collection dates of our samples. Given that fox removal was not completed from most of the Near Islands we sampled until the 1970s, and from Attu until 2000, it is likely that an insufficient number of generations had passed for the accumulation of mutations to generate the high levels of mtDNA population structuring observed among islands (Avise 2004, Pruett et al. 2010). The lack, based on mtDNA, of spatial genetic structure and asymmetry in gene flow among Attu and the other Near Islands suggests that the Common Eider's reestablishment was likely not solely through recruitment from within each island but was also facilitated by dispersal from neighboring islands within the island group. Gene-flow estimates suggest that the Common Eider population on Attu was likely augmented, in part, by birds immigrating from Agattu, which was fox-free for 30 years prior to the removal of foxes from Attu. Given that samples from Attu were collected prior to and shortly after the last fox was removed from the island, gene-flow estimates likely reflect recent effective dispersal among the Near Islands before all islands in the group were fox-free. If eider populations on nearby islands were sufficiently large after their recovery, females may have dispersed to unoccupied habitat on Attu; this is supported by recent observations of the eiders' rapid reestablishment on Attu (J. Williams, pers. obs.).
Levels of population structure in mtDNA higher than in nuclear DNA could be attributed to differences in the rate of lineage sorting between the genomes. With mtDNA the effective population size is smaller than with nuclear DNA. Therefore, when mutation and selection are held constant, genetic drift has a greater influence on mtDNA than on nuclear DNA (Avise 2004), which translates into higher estimates of population subdivision. However, all of the inter-island comparisons yielded FSTvalues at the microsatellite loci had lower than expected after the four-fold difference in the effective size of the genomes was accounted for (Zink and Barrowclough 2008), suggesting male-mediated gene flow homogenizing allelic frequencies in the nuclear genome. The effects of incomplete lineage sorting and sex-biased gene flow on genetic structure are not mutually exclusive, and both likely played a role in the degree of spatial genetic structure we observed. However, given the high rates of females' philopatry and males' dispersal reported for the Common Eider elsewhere, differences in the degree of genetic structure between the genomes are likely more attributable to sex-biased gene flow than to incomplete lineage sorting.
Gene Flow
The directionality of gene flow among the islands sampled in the Aleutian Archipelago appears to have changed through evolutionary time. Gene flow estimated in bayesass implies net eastward dispersal of Common Eiders between the Near and Rat Island groups that may be attributable to the fox's persistence through the archipelago. Foxes persisted longer on the Near Islands than at Amchitka in the Rat Islands, and once foxes were eradicated from those islands, seabird and waterfowl populations quickly rebounded (Byrd et al. 2005, Gibson and Byrd 2007). Therefore, the genetic signal that we detected with the short-term estimates of gene flow in BAYESASS may be a result of the increased reproductive output during the recovery of the Near Island populations that resulted in Common Eiders expanding east to the Rat Islands.
The westerly (microsatellites and mtDNA) coupled with an easterly (introns) gene flow between island groups based on the coalescent model may have resulted from a double colonization of the Aleutian Island chain post-Pleistocene. Asymmetry of gene-flow estimates, along with the biases in direction, are consistent with estimates for populations sampled through most of the Common Eider's distribution (Sonsthagen et al. 2011). Few trans-Beringian taxa have colonized the region from two directions; only four of 13 taxa studied by Waltari et al. (2007) colonized Beringia from both the west and the east. In all other cases the colonization was from the west (Asia to North America). Data from Russia, coupled with current information from mainland Alaskan populations, and additional sampling of eiders throughout the archipelago are needed for further insight into the direction, number, and timing of the Common Eider's colonizations of the Aleutian Islands.
Comparison with Other Aleutian Avifauna
In contrast to the Common Eider, other Aleutian avifauna typically exhibit spatial genetic structure at microsatellite and nuclear intron loci (Marbled Murrelet, Brachyramphus marmotatus,Friesen et al. 2005; Rock Ptarmigan, Lagopus mutus,Holder et al. 2004, Pruett et al. 2010; Song Sparrow, Melospiza melodia,Pruett and Winker 2005b, Pruett et al. 2008). The eider's behavioral characteristics likely play a role in the degree of structure observed. Although many of the above species similarly exhibit some level of philopatry (and its attendant breeding-site fidelity) typical of arctic seaducks, Common Eiders form large winter aggregations where intermixing of island populations is likely (Goudie et al. 2000). Restrictions or barriers to dispersal, such as large water crossings, may represent a serious limitation on dispersal for some species such as the Song Sparrow and Rock Ptarmigan but likely do not inhibit natal or breeding dispersal of the Common Eider. Furthermore, the volcanic dynamism of the Aleutian Archipelago may also play a role in the distribution of genetic boundaries within the islands' avifauna. Along the chain, volcanoes erupt frequently; nine of the 27 listed historically active volcanoes have had at least one major eruption since 1990 (DeGange et al. 2010). Such eruptions have undoubtedly periodically redistributed populations among islands and promoted genetic similarity within island groups of species with strong dispersal abilities, such as the Common Eider.
Researchers have hypothesized that in the Pleistocene the Aleutian Islands were a cryptic unglaciated refugium for several arctic species (Pruett and Winker 2005a, b, 2008, Holder et al. 2004, Pruett et al. 2010). Long-term persistence within such refugia promotes diversification and genetic differentiation within a species (Hewitt 1996) and may explain the high levels of inter-island genetic differentiation observed in other taxa. Growth estimates based on the coalescent were positive for the Aleutian population as a whole, a pattern consistent with post-Pleistocene colonization (Waltari and Cook 2005, Sonsthagen et al. 2011). Within the Aleutian Archipelago Common Eiders do not appear to have accumulated genetic differences (i.e., private alleles) unique to island groups, which would be expected from retention and isolation within a refugium. Population declines (on some islands) and extirpations (from other islands) associated with the fox and subsequent dispersal among islands during population recovery may have erased the genetic legacy of the Pleistocene. Within the Aleutians, however, haplotypes have not diverged widely, being located terminally on a network generated from haplotypes representing populations sampled throughout the Common Eider's distribution (Sonsthagen et al. 2011). Thus, although the Aleutian Islands may have served as a Pleistocene refugium for some arctic species, resulting in distinct lineages endemic to each island group, the Common Eider was apparently not one of them (Sonsthagen et al. 2011).
Acknowledgments
Funding was provided by the Minerals Management Service (143501-98-CA-309), Coastal Marine Institute, University of Alaska Fairbanks, U.S. Geological Survey, Alaska Experimental Program to Stimulate Competitive Research graduate fellowship (NSF EPS0092040), and University of Alaska Foundation Angus Gavin Migratory Bird Research Fund. Technological support was provided by Shawn Houston, University of Alaska Life Science Informatics computer cluster (NIH P20RR016466). We thank all of the researchers for generously providing samples; D. Irons and University Alaska Museum; J. Gust and G. K. Sage, U.S. Geological Survey, who provided laboratory assistance; and two anonymous reviewers for comments on an earlier draft of the manuscript. Any use of trade, product, or firm names is for descriptive purposes only and does not imply endorsement by the U.S. government.
Literature Cited
