-
PDF
- Split View
-
Views
-
Cite
Cite
Kim T. Scribner, Richard A. Malecki, Bruce D. J. Batt, Rainy L. Inman, Scot Libants, Harold H. Prince, Identification of Source Population for Greenland Canada Geese: Genetic Assessment of a Recent Colonization, The Condor: Ornithological Applications, Volume 105, Issue 4, 1 November 2003, Pages 771–782, https://doi.org/10.1093/condor/105.4.771
Close - Share Icon Share
Abstract
We used microsatellite markers, mitochondrial DNA (mtDNA), and satellite telemetry to infer the North American geographic origin and racial composition of Canada Geese (Branta canadensis) from newly colonized habitats in Greenland. Using likelihood-based assignment tests we determined that multilocus genotypes of Greenland Canada Geese were consistent with the hypothesis of origin from birds of the Atlantic Population breeding around southern Ungava Bay, Quebec, Canada. The Atlantic Population, based on previous studies of seasonal movements and demography, appeared to be reproductively isolated from the North Atlantic Population. We found that these two populations were genetically differentiated based on microsatellite allele and mtDNA haplotype frequencies. Findings of high levels of genetic discordance among North American breeding populations are consistent with migratory movements, despite high levels of distributional overlap of birds from the North Atlantic and Atlantic Populations during migration and on wintering areas. Findings based on genetic markers were concordant with satellite telemetry conducted during spring migration, which showed that birds destined for Greenland migrate through the southern Ungava Bay breeding colony. Genetic differences among these populations are useful for addressing other issues of ecological or management concern.
Identificación de la Población Fuente de los Gansos Branta canadensis de Groenlandia: Evaluación Genética de una Colonización Reciente
Resumen. Utilizamos marcadores microsatélites, ADN mitocondrial (ADNmt), y telemetría de satélite para inferir el origen geográfico en Norte América y la composición racial de los gansos Branta canadensis en hábitats recientemente colonizados en Groenlandia. Mediante pruebas de asignación basadas en verosimilitud, determinamos que los genotipos multilocus de los gansos de Groenlandia eran consistentes con la hipótesis de origen de aves de la población del Atlántico que se reproduce alrededor del sur de Ungava Bay, Quebec, Canadá. Con base en estudios previos de movimientos estacionales y demografía, la población del Atlántico pareció estar aislada reproductivamente de la población del Atlántico Norte. Encontramos que estas dos poblaciones son genéticamente diferentes en términos de frecuencias alélicas de microsatélites y haplotipos de ADNmt. El hallazgo de altos niveles de discordancia genética entre poblaciones reproductivas norteamericanas es consistente con los movimientos migratorios, a pesar de los altos niveles de superposición de las distribuciones de aves de las poblaciones del Atlántico y el Atlántico Norte durante la migración y en las áreas de invernada. Los resultados basados en los marcadores genéticos concordaron con la telemetría satelital llevada a cabo durante la migración de primavera, la cual mostró que las aves con destino a Groenlandia migran a través del sur de la colonia reproductiva de Ungava Bay. Las diferencias genéticas entre estas poblaciones son útiles para abordar otros asuntos de interés ecológico o de manejo.
Introduction
Colonization of new habitats by avian species, through purposeful introduction or via natural migration, have been extensive within and beyond indigenous ranges. Examples can be found among the migratory species that are seasonal inhabitants of northern latitudes and have occupied current breeding areas only since Pleistocene glaciation (Ploeger 1968, Zink et al. 1995). Founder events associated with colonization of island habitats have been inferred (Clegg et al. 2002). Often, sequential phases of natural expansion and contraction in species' geographic distribution have been tied to shifts in habitats and species interactions (Ricklefs and Bermingham 2002). Translocations have been used to reestablish or to supplement a species or population (Wolf et al. 1996, Tarr et al. 1998).
A variety of techniques have been used to identify racial or taxonomic affinities of waterfowl. Morphology and plumage have been used with some success to discriminate between nesting populations of Canada Geese (Branta canadensis; Johnson et al. 1979) and have also been used to assess the subspecific composition of hunting harvests in the Pacific (Pearce et al. 2000) and Mississippi Flyways (Scribner, Warrillow, et al. 2003). Of the subspecies of Canada Geese breeding or wintering in eastern North America, small-bodied B. c. hutchinsii and large-bodied B. c. maxima and B. c. interior are readily distinguishable on the basis of body size. Discrimination on the basis of phenotype becomes more problematic when the focus is on geographic populations of a single subspecies (Moser and Rolley 1990).
Based on morphometric characteristics of a small number of nonbreeding birds, Fox et al. (1996) suggested that Greenland Canada Geese were of the B. c. interior subspecies. However, there are several disjunct eastern breeding populations of interior Canada Geese. Further, several Greenland birds were described as being most similar in appearance to B. c. occidentalis or B. c. maxima (Kristiansen et al. 1999).
Observational data from band recoveries or from telemetry can be extremely useful for identifying sites of origin and developing associations between wintering and breeding groups (Menkens and Malecki 1992, Malecki et al. 2001). However, independent studies conducted using different sources of data on migratory movements of Greenland Canada Geese were either equivocal or had conflicting conclusions. Based on analyses of fall migratory movements, Kristiansen et al. (1999) found that Canada Geese marked on breeding areas in Greenland migrated south through Labrador, Canada, suggesting possible historical origins with coastal-nesting populations of Canada Geese from the North Atlantic Population. If the expanding populations of Canada Geese on Greenland were found to derive from breeding populations in the North Atlantic Population management unit (Dickson 2000), which are thought to be reduced, they would add significantly to estimates of recruitment from the North Atlantic Population.
Recent conflicting evidence based on satellite telemetry of migrating Canada Geese in the spring (Malecki et al. 2000, 2001) suggested that migratory movements of Greenland-bound Canada Geese proceeded along routes used by, and directly over, breeding populations from southern Ungava Bay, Quebec, Canada, which is part of a separate recognized management unit, the Atlantic Population (Dickson 2000).
Genetic markers such as mitochondrial DNA (mtDNA) and microsatellites have been useful in addressing questions about population structure and ancestral origin for numerous avian species at local and regional levels (reviews in Cooke and Buckley 1987, Mindell 1997), including migratory waterfowl (Scribner et al. 2001, Scribner, Warrillow, et al. 2003). Since many species of waterfowl exhibit natal philopatry (Anderson et al. 1992), reproductively isolated populations evolve over time, and differences in allele frequencies develop (Ely and Scribner 1994). Relative measures of interpopulation differentiation in allele or haplotype frequencies can be informative in reconstructions of population relationships, including those between founder and recipient groups.
In this study we used DNA markers (microsatellites and mtDNA sequences) to compare allele and haplotype frequencies from a population of breeding Canada Geese of recent origin in Greenland to those of putative donor populations that could plausibly (based on geographic proximity) have been the ancestral source. Our objective was to determine whether one or more of the putative donor populations contributed genetically to the contemporary Greenland population.
Methods
Sample and Data Collection
From 1996–2001, adult female Canada Geese throughout subarctic breeding areas in eastern North America and western Greenland were marked with satellite-tracked radio-transmitters (30 g; Model PTT100, Microwave Telemetry, Inc., Columbia, Maryland) while the geese were flightless in late July–early August, by guiding them into catch nets using a helicopter or by walking. To assure the affinity of marked birds to breeding location, only females with young were marked.
Geese were marked in northern Quebec along the Hudson and Ungava Bay coasts in 1996 (n = 16) and 1997 (n = 18; Fig. 1). In 1999, 16 birds were marked in Labrador and Newfoundland, and six were marked in Greenland. We marked 24 birds in Labrador and Newfoundland in 2000, and 10 in Newfoundland in 2001. For this paper, we highlight spring movement patterns for birds marked from breeding regions in years that best typified the pattern of movement monitored over the course of our tracking effort, since spring migration to specific breeding sites has the best chance to evaluate potential relatedness between breeding populations.
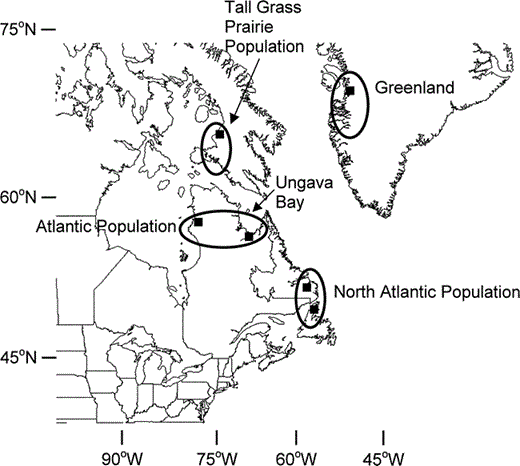
Sampling locations of breeding Canada Geese (Branta canadensis) from putative source populations in eastern North America and newly colonized sites in Greenland. Population names are as defined in Dickson (2000)
Blood or growing feather samples were collected for genetic analysis (n = 19) from five sampling localities on the west coast of Greenland (67.00°N, 50.00°W) from 21–23 July 1999. Samples were also obtained from each of five putative donor populations (Fig. 1A). Samples from the Atlantic Population were collected during 1998 and 1999 from two locales on the eastern and western portions of the Ungava Peninsula: Polemond River in the west (n = 50, 59.30°N, 77.40°W), and western and southern Ungava Bay in the east (n = 50; 59.10°N, 69.20°W). Samples from the North Atlantic Population were collected during 1999 and 2001 from Newfoundland (n = 40; 48.00°N, 55.20°W) and Labrador (n = 55; 52.10°N, 58.40°W). Samples of small-bodied B. c. hutchinsii from the Tall Grass Prairie Population from Baffin Island (n = 86; 66.60°N, 72.50°W) were collected during 1998–2000 (Fig. 1). All samples were from presumed breeding adults.
DNA was extracted from blood and growing feather quills using salt-extraction methods as prescribed in Puregene DNA extraction kits (Gentra Systems, Inc., Minneapolis, Minnesota). DNA was resuspended in 50 μL of TE buffer (10 mM Tris-HCl, pH 8.0, 1 mM EDTA). Fluorometry was used to determine DNA concentrations. Each PCR used 100 ng of DNA.
Analysis of Genetic Markers
A series of genetic markers, developed for waterfowl, were screened to determine which subset of markers provided the greatest discrimination among the candidate source populations (two from the North Atlantic Population, two from the Atlantic Population, and one from the Tall Grass Prairie Population). Markers included microsatellite loci (Bcaμ7, Bcaμ9, Bcaμ11, Hhiμ1, Buchholtz et al. 1998; TTUCG1 and TTUCG5, Cathey et al. 1998; CR-G, A. Baker, unpubl. data) and mtDNA sequence analysis of a variable portion of the mtDNA control region (Pearce et al. 2000, Pierson et al. 2000).
PCR for microsatellite loci was performed in 25-μL volumes using conditions provided by the respective authors. Microsatellite PCR products were screened using 6% polyacrylamide vertical gels. Products were visualized by a Hitachi FMBIO II Multi-View scanner and associated software. Microsatellite fragments were sized manually using a 20-bp internal lane standard. Several individuals of known genotype were used as additional allele-size standards. Microsatellite markers accurately and precisely discriminate among subspecies and breeding populations of Canada Geese in the Pacific Flyway (Pearce et al. 2000) and for midcontinent populations of B. c. interior and B. c. maxima in Ontario and Michigan (Scribner, Warrillow, et al. 2003).
A 385-bp fragment of the 5′ end of the Canada Goose mitochondrial DNA control region was amplified using primers and conditions described in Pierson et al. (2000) and Pearce et al. (2000). These primers were designed to recognize sites flanking the hypervariable portion of the control region (3′ end of domain; Baker and Marshall 1997), and additionally, to amplify and sequence only mitochondrial DNA sequences and not nuclear DNA sequences originating from transposed mtDNA (Sorenson and Fleischer 1996). Sequencing was performed using a SequiTherm Excel DNA sequencing kit (Epicentre, Inc., Madison, Wisconsin), following product protocols for use of fluorescently labeled primers. Sequences were aligned manually.
Statistical Analysis
Genetic diversity and population differentiation
Estimates of allele frequency and levels of genetic variability (number of alleles per locus and heterozygosity) were made using the program BIOSYS (Swofford and Selander 1981). We used the Markov chain method of Guo and Thompson (1992), implemented in program GENEPOP (Raymond and Rousset 1995), to test for deviations of single-locus observed genotypic frequencies from Hardy-Weinberg expectations and for evidence of linkage disequilibrium (between multiple loci) for each population and locus (or locus pair).
Tests of differences in microsatellite allele frequency between baseline breeding populations were conducted using F-statistics (Weir and Cockerham 1984), which summarize partitions of total variance in allelic frequency at each of the microsatellite loci (within and among populations). Tests of significance were conducted using permutations (n = 2000) of alleles within samples (f) and of alleles or multilocus genotypes among samples (θ) using the program FSTAT (Goudet 1999).
Genetic affinities between Greenland and North American populations were assessed using several approaches. First, genetic distances (chord distance; Cavalli-Sforza and Edwards 1967) were estimated from microsatellite data for all pairwise comparisons among the populations and were used to construct a neighbor-joining phenogram (Saitou and Nei 1987). Statistical support for the neighbor-joining phenogram branches was based on bootstrapped population trees created using the program Cornuet (J.-M. Cornuet, unpubl. program) and viewed using TreeView version 1.6.6 (Page 2001). Given the recent nature of the colonization (Fox et al. 1996), and assuming that founder effects and drift have not been pervasive, the expectation is that birds from Greenland should be most genetically similar to the population from which colonists originated.
MtDNA sequence data
Mitochondrial DNA sequences were aligned manually and haplotype designations were based on base-pair substitutions or insertions-deletions. Sequences for each haplotype were submitted to GenBank under accession numbers (AY340598–AY340620 for haplotypes S1–S23, respectively). Additional haplotypes (A, H, L, P, S, T) have been described previously (Scribner, Talbot, et al. 2003) for Canada Geese in western North America.
Phylogeographic analyses
We used MODELTEST version 3.06 (Posada and Crandall 1998) to find the best available model of DNA substitution based on hierarchical likelihood-ratio tests. The model of Tamura and Nei (1993) that incorporates information on the proportion of invariable sites (I = 0.1028) provided the best fit to the data, and was used in tree reconstructions. Phylogenetic analyses were conducted using PAUP*4.0b10 (Swofford 2000). We used maximum-likelihood, distance (minimum evolution), and parsimony methods. Heuristic tree searches were conducted for each analysis, with 20 and 100 random additions of taxa for maximum- likelihood and parsimony analyses, respectively, each followed by tree bisection-reconnection topological rearrangements. Robustness of nodes was assessed using tree reconstructions of bootstrap-resampled data (1000 replicates) under distance and parsimony criteria, and (200 replicates) for maximum-likelihood criteria. We used sequence from Lesser Snow Goose (Chen caerulescens caerulescens) from a homologous portion of the control region (GenBank accession number S70800; Quinn 1992) as an outgroup.
An analysis of molecular variance (AMOVA; Excoffier et al. 1992) was used to partition variance in mtDNA haplotype frequency among individuals within and among populations. Given the high degree of sequence divergence between haplotypes of large-bodied and small-bodied Canada Geese, phylogenetic analyses and AMOVA analyses were conducted on a reduced data set including only large-bodied samples from the North Atlantic Population, Atlantic Population, and Greenland.
Individual assignment tests
Additional quantitative approaches (Waser and Strobeck 1998, Blanchong et al. 2002) were used to assign Greenland birds to an ancestral population of origin based on their genotype scored at each of a series of independent markers. The probability (or likelihood of occurrence) of observing such a multilocus genotype arising from each putative source population was estimated. The majority of current empirical research utilizes likelihood-based tests (e.g., assignment tests; Rannala and Mountain 1997, Waser and Strobeck 1998, Cornuet et al. 1999), and we used a similar approach (Blanchong et al. 2002). The assignment test is essentially a Bayes decision rule constructed on the basis of sample data. The classifier, when applied to discrete multi-character- state data (alleles), assumes a multinomial data distribution, independence among loci, and, for markers with Mendelian patterns of inheritance, Hardy-Weinberg equilibrium. Training or baseline data was used to obtain parameter estimates (allele frequencies) for the underlying model to compute maximum-likelihood estimates of multilocus genotype probabilities of membership for each of the possible contributing populations. Estimates of statistical confidence in individual assignment decisions were assessed from posterior probabilities calculated using a Bayesian model (Blanchong et al. 2002).
Results
Migratory Patterns
Spring movement of geese marked with satellite transmitters in Hudson and Ungava Bays, Quebec, Greenland, Labrador, and Newfoundland typified migration patterns recorded for birds returning to these breeding regions (Fig. 2). Only three of six birds marked in Greenland were monitored during spring migration. These three birds destined for breeding grounds in Greenland migrated directly through the breeding grounds of Atlantic Population Canada Geese in southern Ungava Bay.
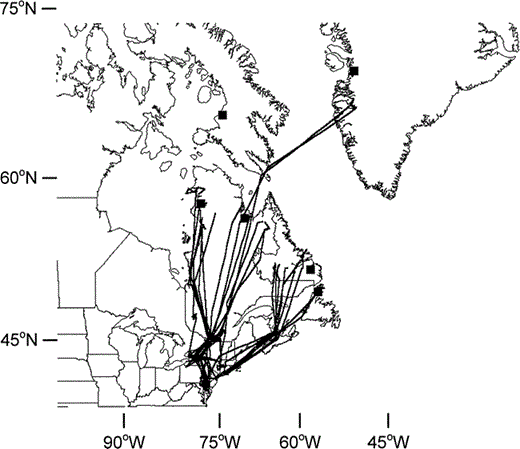
Spring migration routes of Canada Geese from breeding populations within the Atlantic Population, North Atlantic Population, and Greenland recorded using satellite telemetry. Filled squares indicate sampling locations from Figure 1
Genetic Diversity Within and Among Populations
Estimates of genetic diversity for all surveyed breeding populations were high (Appendix) . Allelic diversity ranged from 5.6 to 8.1 alleles per locus, with the lowest estimates observed in Greenland and Labrador. Estimates of observed (Ho) and expected (He) heterozygosity were also high (range 0.574–0.689 and 0.665–0.723, respectively). MtDNA haplotype diversity varied greatly across sampling locales (range 3–12 haplotypes). Allele and haplotype diversities were generally lower in Greenland Canada Geese relative to samples from putative source populations (Appendix).
Estimates of allele and haplotype frequency and levels of genetic variability for six samples of Canada Geese. Alleles are designated by size (in base pairs)
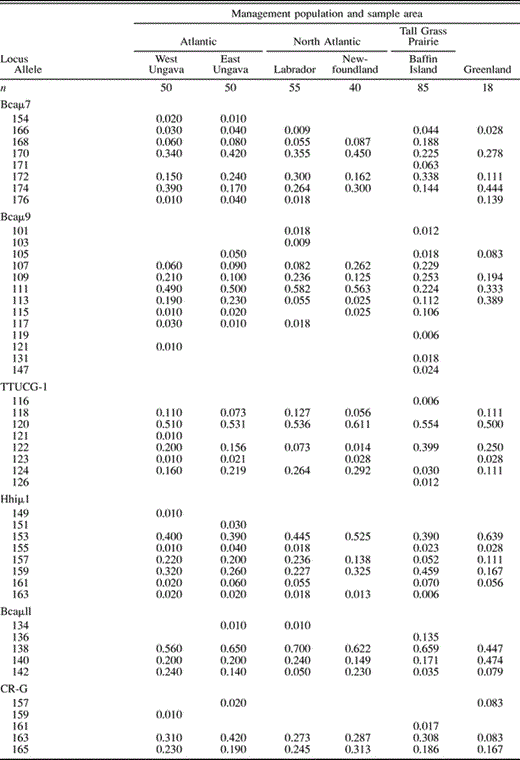
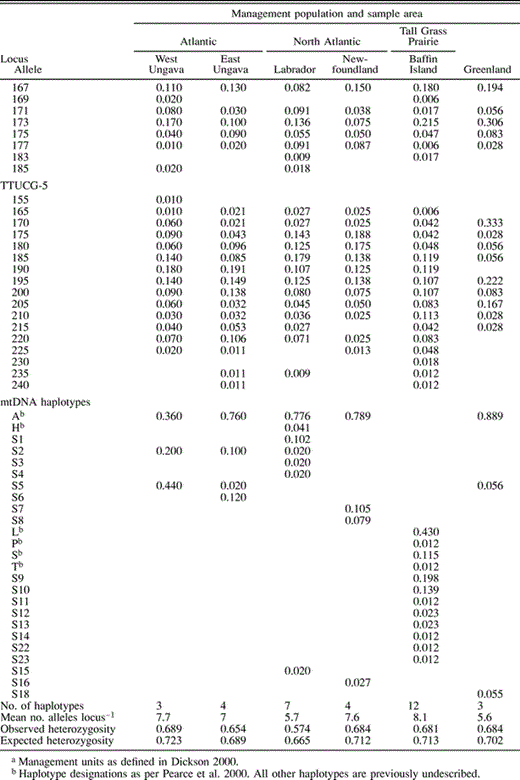
Estimates of allele and haplotype frequency and levels of genetic variability for six samples of Canada Geese. Alleles are designated by size (in base pairs)


The mtDNA neighbor-joining tree (Fig. 3) showed two major haplotype associations representing groups of large- and small-bodied types. The 50% majority-rule consensus bootstrap tree (not shown) revealed that the basal node for large-bodied and small-bodied haplotypes was resolved with strong (100%) bootstrap support. The topology defining relationships among large-bodied haplotypes illustrated the lack of phylogenetic structure in the data. Only one addition haplotype association (small-bodied haplotypes S, S11, and S14; Fig. 3) was resolved with bootstrap support exceeding 50%. One haplotype observed in birds from Greenland (S5) was only observed in Atlantic Population breeders, providing further qualitative support for ties between Atlantic Population and Greenland Canada Geese. However, no consistent phylogeographic trend was observed in the data. Haplotype A was the most common haplotype in all putative source populations and in Greenland (Appendix).
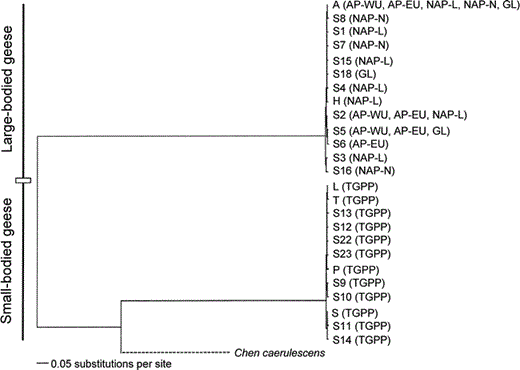
Neighbor-joining tree of Canada Goose (Branta canadensis) haplotypes. The population(s) in which the haplotype was observed are shown in parentheses (GL: Greenland; NAP: North Atlantic Population; L: Laborador; N: Newfoundland; AP: Atlantic Population; EU: eastern Ungava Peninsula; WU: western Ungava Peninsula; TGPP: Tall Grass Prairie Population; Fig. 1). Due to size constraints, the broken line connecting the Chen caerulescens outgroup to the ingroup B. canadensis clade is not proportional to the true branch length
Estimates of microsatellite allele and mtDNA haplotype frequency (Appendix) varied greatly across populations. Significant differences in microsatellite allele frequency (mean FST = 0.037; P < 0.01) and mtDNA haplotype frequency (ΦST = 0.168; P < 0.001) revealed that most populations of Canada Geese are significantly differentiated genetically (Table 1). A large number of mtDNA haplotypes was observed across our samples (Appendix). Small-bodied Canada Geese from Baffin Island had distinct mtDNA not seen anywhere in large-bodied Canada Geese in the Atlantic Flyway or Greenland (Fig. 3). Thus, Tall Grass Prairie Population geese were excluded as ancestral sources of Greenland colonization. Interestingly, samples from two locales within the North Atlantic Population (Newfoundland and Labrador) did not differ significantly in allele or haplotype frequency, though samples from western Ungava Peninsula and eastern Ungava Bay were highly differentiated genetically (Table 1). Genetic affinities among populations based on mtDNA haplotype frequency suggested a closer relationship between Canada Geese from the eastern Ungava Peninsula and samples from the North Atlantic Population relative to the relationship between either of these populations and the samples from the western Ungava Peninsula (Table 1).
Summary of pairwise estimates of variance in microsatellite allele frequency among Canada Goose sampling locales (mean FST = 0.037; above diagonal), and in mtDNA haplotype frequency (ΦST = 0.168; below diagonal)
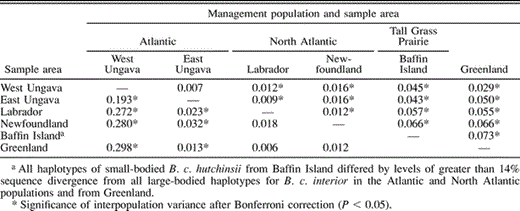
Summary of pairwise estimates of variance in microsatellite allele frequency among Canada Goose sampling locales (mean FST = 0.037; above diagonal), and in mtDNA haplotype frequency (ΦST = 0.168; below diagonal)

Population relationships based on microsatellite data were further described using genetic distances and resolved in a population neighbor-joining tree (Fig. 4). Populations in close geographic proximity (e.g., Labrador and Newfoundland) exhibited greater genetic affinities (similarity in allele frequency) to one another than to other populations. Based on qualitative inspection (relative clustering levels, Fig. 4), the sample from Greenland had the greatest genetic affinity to the sample of Canada Geese from the eastern Ungava Peninsula.

Neighbor-joining population tree based on genetic distances among breeding populations of Canada Geese from putative source populations in eastern North America and newly colonized sites in Greenland (Fig. 1). Numbers above tree branches indicate bootstrap support for branch topography (based on 2000 replicates)
Based on microsatellite data, we assigned each individual from Greenland to a putative population of origin. We estimated that birds from Greenland had genetic affinities most closely associated with breeding populations from the Ungava Peninsula. Sixteen out of 18 Greenland Canada Geese were assigned to the Atlantic Population (eastern Ungava Peninsula) with high confidence (mean 91%). Of the two Greenland birds putatively assigned to the North Atlantic Population, estimates of confidence in assignment decision were equivocal (i.e., the likelihoods were nearly identical for the Atlantic and North Atlantic Populations).
Discussion
Canada Geese rarely bred in Greenland prior to 1980 (Salomonsen 1981). By the early 1990s, the Canada Goose was a locally common breeder that was increasing in number and expanding its range in west Greenland (Boertmann 1994). In 1999, Malecki et al. (2000) conducted aerial surveys for Canada Geese in west Greenland in June and estimated roughly 1700–3500 breeding pairs, with the greatest densities occurring on inland areas located from 66.30°–67.30°N, near the town of Kangerlussuaq. Satellite imagery has shown that snow cover in spring is gone from this region more than one month earlier than near the coast (Glahder 1999).
Band recoveries and resightings of Canada Geese neck-collared in Greenland during fall migration indicated that these birds were apparently a part of the North Atlantic Population (Fox et al. 1996), which primarily breeds in Labrador and Newfoundland and migrates along the Atlantic coastal zone of Canada and the U.S. as far south as coastal North Carolina. One would therefore assume that newly colonizing birds in Greenland would be derived from this Labrador-Newfoundland stock. However, our telemetry and genetic evidence suggested that a strong linkage to Atlantic Population geese from the southern Ungava Bay region of northern Quebec (eastern Ungava Peninsula) is not as spurious as one might first suspect. Malecki et al. (2001) have suggested that geese breeding in the southern Ungava Bay region may represent a small, transitional subpopulation that favors neither of the migration corridors used by Atlantic or North Atlantic Population geese. Fall movements of these birds, monitored with satellite transmitters, show passage through central Quebec, eastern New York, western Vermont, Massachusetts, and Connecticut to wintering areas in the lower Hudson River drainage of New York, western Massachusetts and Connecticut, and northern New Jersey. Spring movement followed the Hudson River system in New York to Lake Champlain and on to breeding areas in the southern Ungava Bay region.
More recent work with satellite transmitters on North Atlantic Population geese (Malecki et al., unpubl. data) indicated that geese breeding in the more westerly portions of Labrador migrated in fall along a more inland pathway to wintering areas along the Atlantic coast; a direct contrast to other birds nesting in Labrador and Newfoundland that traveled south through the coastal maritime region. Spring movements also favored an inland corridor not unlike that traveled by birds from the southern Ungava Bay region. Six geese similarly marked in west Greenland and monitored during fall and winter 1999 (n = 4) and spring 2001 (n = 3) also showed this pattern, suggesting strong evidence for a genetic relationship.
Findings of a high degree of genetic discordance among Canada Goose breeding populations for both biparentally inherited (microsatellite) and maternally inherited (mtDNA) genetic markers in eastern North America are consistent with previous reports from western (Pearce et al. 2000) and central (Scribner, Warrillow, et al. 2003) parts of the North American continent. Significant differences among breeding populations, even those in relative proximity (e.g., western vs. eastern Ungava Peninsula), provides strong evidence for high male and female fidelity to natal areas. These data are particularly notable because of the concurrent collection of, and high degree of concordance between, genetic and satellite telemetry data. Population differences in genetic characteristics of eastern Canada Geese can be used in other investigations of importance to the species' management and conservation.
Acknowledgments
We gratefully acknowledge permission granted by the Greenland Home Rule Authority and the Canadian Wildlife Service to collect samples from breeding Canada Geese for genetic analyses. Special thanks are due J. Kristiansen and T. Fox of the National Environmental Research Institute of Denmark; J. Hughes, K. Dickson, and D. Caswell of the Canadian Wildlife Service; and T. Nichols of the New Jersey Division of Fish and Game for their valuable assistance in conducting the actual field collections. The project was funded by Ducks Unlimited, Inc. Funding during the later stages of manuscript preparation and data analysis was provided by the Partnership for Ecosystem Research and Management (PERM) cooperative program between the Michigan Department of Natural Resources and the Department of Fisheries and Wildlife at Michigan State University, the Michigan Department of Natural Resources, through the Federal Aid in Wildlife Act under Pittman-Robertson Project W-127-R.
Literature Cited


