


Cirrhosis is the 11th leading cause of death and 15th leading cause of morbidity worldwide (1). Liver disease due to viral hepatitis is declining; however, nonalcoholic fatty liver disease (NAFLD) and alcohol-associated liver disease (AALD) are both surging global concerns, often coexisting, with a significant contribution from alcohol as primary etiology or a cofactor. It is estimated that there are 1.5 billion individuals with chronic liver disease, of whom many remain asymptomatic and undiagnosed until advanced stages of disease (1, 2). Obesity is recognized as the predominant risk factor for NAFLD and alcohol consumption for AALD; minimally invasive screening tests in at-risk populations that inform on clinically significant parameters, such as fibrosis, could guide preventive strategies and assessment of prognosis in patients. Timely identification of at-risk patients is especially important due to the reversible nature of early stages of both diseases and the lack of approved effective therapies for more advanced disease.
Recent work by Niu et al. (3) uniquely employs a “paired liver-plasma proteomic analysis” to identify newer prognostic and/or diagnostic targets with therapeutic potential. Briefly, the team assessed the plasma proteome in combination with the biopsied liver proteome via mass spectrometry and, through comparison against accepted gold standards, developed a panel of protein biomarkers. The development process included machine-learning models and stringent biostatistical analyses to score significantly co-dysregulated proteins. The authors applied observations from the derivation cohort to an independent validation cohort to evaluate the performance of these biomarker panels. In addition, several of the shortlisted proteins also had prior literature support for their role in liver diseases. Taken together, Niu et al. report a comprehensive panel for AALD detection via blood-based testing.
Niu et al. included a prospective cohort of 459 derivation and 63 validation AALD patients and 137 healthy controls. Patients with AALD were recruited from 3 outpatient liver clinics, 2 alcohol rehabilitation centers, and the community. The inclusion criteria incorporated alcohol drinkers with the full spectrum of early stages of AALD with no symptoms of chronic liver disease or terminal stages of liver disease. The NAFLD activity score was adopted for the standardized and blinded scoring of liver biopsies by a single pathologist. The 3 cardinal histological features—fibrosis (F), ranging from stage 0 to 4; inflammatory (I) activity (sum of lobular inflammation and ballooning, ranging from 0 to 5); and steatosis (S), ranging from 0 to 3were scored for each biopsy (4). In parallel, the proteome was analyzed in plasma samples from 659 participants and 79 liver biopsies using mass spectroscopy. The efficacy and performance of the hypothesized model were compared to the current gold standard tests: transient elastography (TE), imaging and serological tests approved by European Medicines Agency and Food and Drug Administration.
Differential abundance analysis of the liver proteome reported significant dysregulation, where 658 proteins varied throughout the spectrum of fibrosis progression, 135 proteins with inflammatory activity, and 66 proteins with steatosis. The majority of 717 unique proteins (13% of the identified liver proteins) were upregulated (63%) as fibrosis stage increased, and 84% of proteins dysregulated in inflammation were also co-dysregulated in fibrosis. This overlap in inflammation and fibrosis protein signature is not surprising due to the considerable overlap and crosstalk among signaling pathways that mediate both processes. Thirty-seven percent of proteins were downregulated as fibrosis advanced. Interestingly, when classified according to whether they were secreted or liver-specific (based on 5-fold or higher relative hepatic mRNA expression), 87% of liver-specific proteins were downregulated in the liver proteome with fibrosis progression. Protein abundance was also compared to histology to identify the top correlating proteins. Cell-extracellular matrix interaction proteins, cytoskeletal remodeling proteins, and previously reported hepatic steatosis regulators were the significant and topmost hits.
A total of 420 proteins were common to the plasma and liver proteome. The authors classified these into a cluster that mostly consisted of secreted proteins, where the relative abundance in liver and plasma was correlated, and another cluster that had a poor correlation and consisted of intracellular proteins, with low levels detected in circulation. Cumulatively, 46 proteins common to the liver and plasma proteome were differentially regulated across fibrosis stage, and these were labeled co-dysregulated proteins (Fig. 1). The majority of these comprised proteins participating in immune and inflammatory responses, followed by extracellular matrix constituents, protease inhibitors, enzymes, proteins involved in angiogenesis, and coagulation. The enrichment of these pathways is not surprising given that these resemble the differentially regulated proteins in the liver proteome. Vectorially, most of the 46 proteins were aligned; however, a handful demonstrated opposite patterns, and aldolase B increased from fibrosis stage 0 to 2 and then decreased in fibrosis stage 3 and 4.
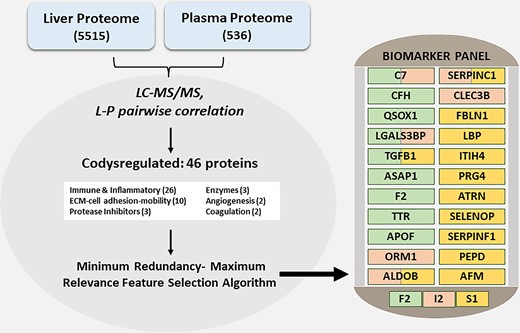
Integrative liver: plasma proteomics for AALD. This graphic summarizes the steps involved in the development of a biomarker panel for AALD integrating the liver and plasma proteome. In the liver, 5515 proteins were detected and 536 proteins were detected in plasma. Liver-plasma pairwise correlation identified 46 co-dysregulated proteins that were modeled via a machine-learning approach to predict significant fibrosis (stage 2, F2), inflammatory activity (numerical sum of ballooning and inflammation according to the NAFLD Activity Score, I2), or steatosis (S1) (3). Abbreviations: C7, complement component 7; CFH, complement factor H; QSOX1, quiescin sulfhydryl oxidase 1; LGALS3BP, lectin galactoside-binding soluble 3 binding protein; TGFB1, transforming growth factor-beta 1; ASAP1, ArfGAP (ADP-ribosylation factor-directed GTPase-activating protein 1) with SH3 domain, ankyrin repeat- and PH domain 1; F2, coagulation factor II, thrombin; TTR, transthyretin; APOF, apolipoprotein F; ORM1, orosomucoid 1; ALDOB, aldolase B; SERPINC1, serpin family C member 1; CLEC3B, C-type lectin domain family 3 member B; FBLN1, fibulin 1; LBP, lipopolysaccharide binding protein; ITIH4, inter-alpha-trypsin inhibitor heavy chain 4; PRG4, proteoglycan 4; ATRN, attractin; SELENOP, selenoprotein P; SERPINF1, serpin family F member 1; PEPD, peptidase D; AFM, afamin.
Machine learning models identified 22 unique proteins and classified them into 3 panels with overlapping proteins; 9 proteins identified advanced fibrosis (F2 panel), 6 proteins indicated inflammatory cell activity (I2 panel), and 12 proteins indicated any liver steatosis (S1 panel). The receiver-operator characteristic curve-area under the curve of these 3 panels was 0.90 (95% CI, 0.899–0.905), 0.85 (95% CI, 0.851–0.858), and 0.91 (95% CI, 0.907–0.915), respectively, indicating strong distinguishability between F2, I2, and S1. As patients with more advanced fibrosis (stages 3 and 4) are at greatest risk of liver-related complications, a streamlined model for identification of advanced stage of fibrosis (F3) was developed and tested in comparison to 5 currently used clinical tests. Another supplemental cross-validation analysis, comparing these panels with 15 currently available diagnostic measures (3) (used for liver disorders), supported the greater clinical utility of these protein-biomarker panels.
One routine clinical diagnostic measure, TE, assesses hepatic steatosis, which is reported as CAP (controlled attenuation parameter), and hepatic fibrosis, which is reported as liver stiffness in kilopascal. Assessment of the proteomics model against healthy controls showed the S1 panel to have better to comparable accuracy when evaluated against steatosis assessment by TE (CAP score). The S1 panel was comparable to CAP in excluding any steatosis. To rule out false-positive predictions in simple or early steatosis, the authors suggested the S1 panel to be slightly better (not statistically significant) than CAP in predicting steatosis, while both have very similar efficacy as a rule-out test to exclude steatosis. Liver stiffness by TE can be falsely elevated due to conditions such as inflammation, hepatic congestion, cholestasis, and liver mass lesions. Therefore, the high negative predictive value of the proteomics model is potentially of great importance for an at-risk population, as the coprediction of steatosis, inflammation, and fibrosis adds to the value of the panel in terms of diagnosis and prognosis.
Having demonstrated good diagnostic performance, the authors turned their attention to clinically relevant liver-related events (LREs) and all-cause mortality to test their model’s clinical prognostic relevance. The F2 fibrosis panel predicted prognosis for liver-related events and all-cause mortality and was superior and comparable to TE, respectively.
Given the high prevalence and overlap of NAFLD and AALD, the findings need to be discussed in the context of earlier reports of NAFLD biomarkers by the group. Overlap in some of the most dysregulated proteins, polymeric immunoglobulin receptor and aldolase B, suggests that these proteomic markers are not etiology specific. Thus, the proteomics markers may be best utilized in at-risk populations to identify the higher risk patients who may benefit most from intensive prevention programs. Further development of etiology-specific proteomic models would be necessary prior to implementation of these as a diagnostic test, especially with regard to the highly prevalent NAFLD, which also contributes significantly to cirrhotic deaths (7.7% in males, 11.3% in females) (1). This will remain challenging given the significant overlap of risk factors among patients and pathophysiological overlap among NAFLD and AALD. Also, an attempt to delineate other metabolically active organ-specific peaks from the paired plasma-liver analysis could critically infer (a) nonautonomous regulation (if any) in the liver during AALD (either protective or detrimental), (b) extent of involvement in AALD advancement, and (c) nonautonomous markers that could also have plausible clinical implications.
This study has been aided by technological advances in data-independent mass spectroscopy (5), which has several inherent advantages such as inclusion of all peptides for fragmentation and analysis, large dynamic range, high reproducibility, and unbiased data for discovery proteomics. Computational advances in machine-learning–based algorithms demonstrate the ability to process large proteomic data sets, compare them with a gold standard benchmark (liver biopsy), and develop diagnostic and prognostic models. In the era of genomic and digital health, multiomics analysis of such data sets, with further integration with multiple classes of data, may replace the reductive approach of moving from unbiased mass spectroscopy to a single candidate approach for test development and validation. Conversely, the high instrument cost, technical expertise, and specialized computational needs limit the generalizability of this approach at present.
In summary, Niu et al. present in a well-validated, large cohort, a promising laboratory test derived from a liver-plasma assessment for clinical prognosis and diagnosis of early to advanced AALD. This proteomics model has the potential to replace clinical liver biopsies in defined contexts, such as pre- and post-intervention biopsies in clinical trials, pending independent validation by other investigators in geographically diverse patient populations.
Nonstandard Abbreviations
NAFLD, nonalcoholic fatty liver disease; AALD, alcohol-associated liver disease; TE, transient elastography.
Author Contributions
All authors confirmed they have contributed to the intellectual content of this paper and have met the following 4 requirements: (a) significant contributions to the conception and design, acquisition of data, or analysis and interpretation of data; (b) drafting or revising the article for intellectual content; (c) final approval of the published article; and (d) agreement to be accountable for all aspects of the article thus ensuring that questions related to the accuracy or integrity of any part of the article are appropriately investigated and resolved.
P.V. Daniel and H. Malhi drafted the manuscript and revised it critically, and both authors approve the final version for publication.
Authors’ Disclosures or Potential Conflicts of Interest
Upon manuscript submission, all authors completed the author disclosure form. The authors declare that no conflict of interest exists.
Employment or Leadership
None declared.
Consultant or Advisory Role
None declared.
Stock Ownership
None declared.
Honoraria
None declared.
Research Funding
H. Malhi is supported by National Institute on Alcohol Abuse and Alcoholism (AA21788) and the Mayo Foundation.
Expert Testimony
None declared.
Patents
None declared.
