


Abstract
Nuclear-derived cell-free DNA (cfDNA) molecules in blood plasma are nonrandomly fragmented, bearing a wealth of information related to tissues of origin. DNASE1L3 (deoxyribonuclease 1 like 3) is an important player in shaping the fragmentation of nuclear-derived cfDNA molecules, preferentially generating molecules with 5 CC dinucleotide termini (i.e., 5 CC-end motif). However, the fragment end properties of microbial cfDNA and its clinical implication remain to be explored.
We performed end motif analysis on microbial cfDNA fragments in plasma samples from patients with sepsis. A sequence context-based normalization method was used to minimize the potential biases for end motif analysis.
The end motif profiles of microbial cfDNA appeared to resemble that of nuclear cfDNA (Spearman correlation coefficient: 0.82, P value 0.001). The CC-end motif was the most preferred end motif in microbial cfDNA, suggesting that DNASE1L3 might also play a role in the fragmentation of microbe-derived cfDNA in plasma. Of note, differential end motifs were present between microbial cfDNA originating from infection-causing pathogens (enriched at the CC-end) and contaminating microbial DNA potentially derived from reagents or the environment (nearly random). The use of fragment end signatures allowed differentiation between confirmed pathogens and contaminating microbes, with an area under the receiver operating characteristic curve of 0.99. The performance appeared to be superior to conventional analysis based on microbial cfDNA abundance alone.
The use of fragmentomic features could facilitate the differentiation of underlying contaminating microbes from true pathogens in sepsis. This work demonstrates the potential usefulness of microbial cfDNA fragmentomics in metagenomics analysis.
Introduction
Circulating cell-free DNA (cfDNA) molecules are nonrandomly fragmented in association with tissues of origin, gaining much recent research interest in fragmentomics (1). Various DNA nucleases, such as DNASE1L3 (deoxyribonuclease 1 like 3), DNASE1 (deoxyribonuclease 1), and DNA fragmentation factor subunit beta, play roles in the fragmentation of cfDNA according to studies involving nuclease-knockout mice and nuclease-deficient humans (13). For example, plasma cfDNA is enriched with CC-end DNA molecules that have been linked to DNASE1L3 activity in a mouse model (4). Such a link has also been observed in DNASE1L3-deficient human participants (5). Han et al. further revealed other nucleases acting on cfDNA fragmentation in which DNA fragmentation factor subunit beta preferentially cleaved cfDNA fragments resulting in A termini (i.e., A-end motif), whereas DNASE1 favored the generation of fragments with T termini (2). Moreover, we and other groups have demonstrated that the use of 5 4-mer end motifs of plasma DNA (i.e., 4 nucleotides at the 5 end of DNA fragments) holds potential for detecting patients with hepatocellular carcinoma (6, 7). Currently, those studies were mainly focused on the properties of nuclear-derived DNA molecules.
Several studies demonstrated that the genomic DNA fragments of microorganisms were detectable in human plasma through next-generation sequencing (8) and were potentially useful as biomarkers for the presence of infection-causing pathogens (912). Such an approach has shown potential for application in infectious disease diagnostics. However, it remains unclear as to the biological properties (e.g., end motifs) of microbial cfDNA and the clinical implication of such properties.
A major technical challenge (13) of analyzing microbial cfDNA lies in the detection of microbial cfDNA derived from infection-causing microorganisms in plasma amid a background of highly prevalent contaminants, possibly from molecular biology grade water (1417), DNA extraction kits (18, 19), and the laboratory environment (20). Several approaches have been proposed for the differentiation of infection-causing pathogen-derived microbial cfDNA and contaminating microbial DNA in metagenomic sequencing (9, 10, 2125). One commonly used approach is to use microbial DNA abundance as a filtering parameter, assuming that the concentration of pathogen-derived microbial DNA should be higher than that of contaminating microbial DNA. However, microbial cfDNA derived from causative pathogens might also be present at low concentrations. Such a method could potentially remove some genuine pathogens present at low biomass, resulting in false negative results. Another approach involves the concurrent preparation of no-template control (NTC) and assumes the microbial sequences identified in NTC samples are contaminants (9, 10, 23). However, this method might erroneously eliminate the sequences of clinically relevant microbes that could be present in contaminants. We reasoned that it would be feasible to differentiate between microbial cfDNA molecules originating from pathogens and those from contaminants based on their differential fragmentomic signatures, if present. Therefore, in this study, we attempted to investigate such feasibility by taking advantage of end motif patterns of plasma DNA and explore its potential clinical implication.
Materials and Methods
Study Design
In this study, we performed massively parallel sequencing on plasma samples from patients with sepsis (sepsis group), participants without infection (noninfection group), and NTC samples (Methods in the online Data Supplement). After taxonomic classification (at the genus level), the microbial sequences of pathogens confirmed by microbiological culture were referred to as infection-causing pathogen-derived microbial cfDNA, and the microbial sequences present in NTC samples were defined as contaminating microbial DNA, potentially derived from extrinsic sources such as reagents, water, or laboratory environment. The microbial sequences found in samples of the noninfection group were deemed as contaminating microbial DNA for downstream validation. Then, we characterized the end motif profile of pathogen-derived microbial cfDNA in comparison with nuclear and mitochondrial cfDNA molecules. We further identified the differential end motifs between pathogen-derived microbial cfDNA from patients with sepsis and contaminating microbial DNA present in NTC samples. Using these differential end motifs, we developed a microbial cfDNA end signature score for the differentiation between microbial cfDNA molecules of pathogens and contaminating microbial DNA molecules (Fig. 1).
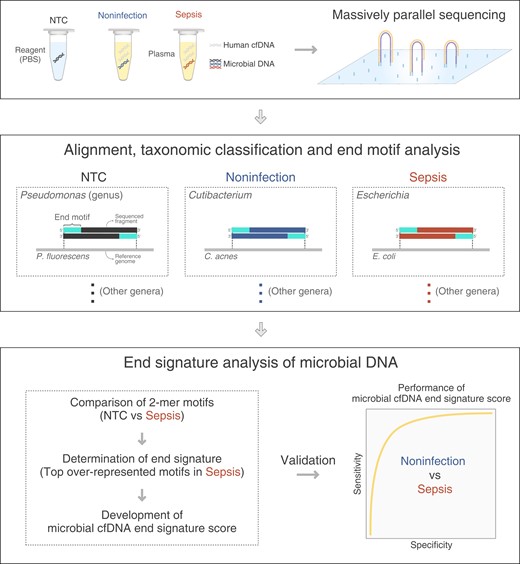
Schematic diagram illustrating the study design. This study involved 3 sample groups: namely, no-template control (NTC) samples, plasma samples from participants with microbiological culture or serology confirmed sepsis (sepsis), and without infection (noninfection). After the completion of massively parallel sequencing, sequencing reads were aligned to reference genomes from microbes and human. The sequencing reads uniquely aligned to microbial genomes were used for downstream analysis. The taxonomic classification at the genus level was performed to identify microbial DNA sequences. Microbial sequences within the NTC samples were defined as contaminating microbial DNA. Microbial sequences of pathogens confirmed by microbiological culture in septic patients were referred to as infection-causing pathogen-derived microbial cfDNA. We characterized the end motif profiles of pathogen-derived microbial cfDNA associated with each genus and identified microbial cfDNA end signature score that could be used to distinguish pathogen-derived cfDNA from DNA contaminations. Microbial sequences detected in participants without infection were used as an independent validation dataset for contaminating microbial DNA.
Patient Recruitment and Sample Collection
The study was approved by the Joint Chinese University of Hong Kong-Hospital Authority New Territories East Cluster Clinical Research Ethics Committee. Patients were recruited from the Intensive Care Unit of Prince of Wales Hospital of Hong Kong. Each patient had at least one set of blood cultures, and additional body fluid cultures were performed according to the suspected site of infection. Patients were classified into a sepsis group or a noninfection group as described in Supplemental Methods. Healthy participants recruited from the Department of Chemical Pathology of the Prince of Wales Hospital in Hong Kong were also included in the noninfection group as additional negative controls. Plasma DNA was extracted and sequenced on the Illumina sequencing platform. The details of sample processing, library preparation, sequencing, and data analysis are described in the Supplemental Methods.
Results
Cohort Information
In total there were 16 patients with sepsis (sepsis group) and 16 patients without infection (noninfection group). All 16 septic patients had microbiologically confirmed infections with pathogens identified in blood and/or body fluid cultures or serology. The sites of infection were biliary (6/16), lung (3/16), liver (2/16), abdomen (2/16), and other body sites. All septic patients were given a beta-lactam antimicrobial (i.e., bactericidal). Patients S6, S9, S14, and S16 were given additional cotrimoxazole or minocycline, which are considered bacteriostatic (Supplemental Table 1). The timing of blood sample collection for culture and sequencing and other clinical information are described in Supplemental Table 1. All 16 patients in the noninfection group had negative microbiological cultures. The clinical information about these patients is shown in Supplemental Table 2. Another 22 healthy participants were recruited and also included in the noninfection group. A total of 32 NTC samples were prepared to define contaminating microbial DNA sequences introduced during sample processing and sequencing (Supplemental Methods).
Identification of Infection-Causing Pathogen-Derived Microbial cfDNA and Contaminating Microbial DNA
The sequencing reads were first aligned to the human genome for all clinical and NTC samples. The unaligned reads were used for taxonomic classification. The microbial abundance was determined at the genus level (Supplemental Methods). Among the 16 septic patients, a total of 25 genera of pathogens were detected. We identified 11 unique genera, as certain genera overlapped among the different samples. Klebsiella was the most prevalent pathogen (7 out of 16 septic patients), followed by Escherichia (5 out of 16 septic patients). The most commonly detected pathogens were bacteria, except for one sample in which a fungus (Candida) was detected. Additionally, more than one pathogen was found in 8 of the 16 septic patients. For each sample, the identified genus (or genera) of pathogen and the corresponding abundance of microbial cfDNA are listed in Supplemental Table 3. Of note, we observed a negative correlation (Spearman 0.52, P 0.04) between the total abundance of pathogen-derived microbial cfDNA and the time interval between plasma DNA sampling and administration of antibiotics among the septic patients (Supplemental Table 1), suggesting that the antibiotic administration might reduce the amount of microbial cfDNA.
We determined the sequences of contaminating microbial DNA from the sequencing data of all NTC samples and identified the top 30 genera in abundance in the pooled sequencing data. The abundances of these 30 genera for individual NTC samples are shown in Fig. 2. We found that most of the top genera detected in NTC samples were prevalent contaminants in reagents or sterile water as previously reported (19, 20). For example, 23 of the 30 genera were reported as a contaminant in negative blank controls prepared by Salter et al. (19). The detected microbial sequences within these 30 genera were used for the downstream end motif analysis.
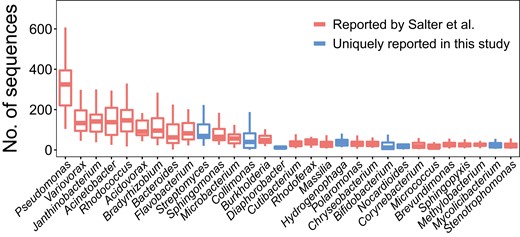
Abundance of microbes in NTC samples. The top 30 of the most abundant genera found in NTC samples are shown in the boxplots. The y-axis shows the number of sequences detected in each NTC sample (n 32). The central line indicates the median value. The bottom and top edges of the boxes are at the 25th and 75th percentiles. The whiskers correspond to 1.5 times the interquartile range (the same below). Boxes in red denote genera reported by Salter et al. (19), and those in blue represent genera uniquely present in this study.
DNA End Motif Analysis with Normalization
We performed 5 4-mer end motif analysis (i.e., a total of 256 motifs) for pathogen-derived microbial cfDNA molecules across different genera detected in the plasma of septic patients. The difference in the genomic contents of different microorganisms would confound the calculation of the frequencies of different end motifs. Therefore, we applied a normalization method by calculating the ratio of observed to expected end motif frequency (i.e., O/E ratio) (Fig. 3; see details in Supplemental Methods). The observed end motif frequency refers to the 5 end motif frequency obtained from the sequencing data of microbial cfDNA fragments, while the expected end motif frequency was determined in silico by counting 4-mer motifs in a reference genome using a sliding window method. An O/E ratio of 1 represents the overrepresentation of one end motif, and vice versa. A higher O/E ratio suggests a higher preference for a particular end motif. We subsequently applied this normalization method to study and compare the end motif profiles of pathogen-derived microbial cfDNA and human-derived cfDNA fragments including nuclear cfDNA and mitochondrial cfDNA.
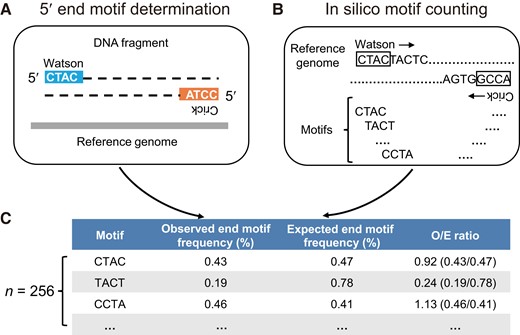
DNA end motif determination and normalization. (A), The observed 5 4-mer end motif frequency of sequenced DNA fragments was determined using both the Watson and Crick strands; (B), A sliding window method was used to determine the expected 4-mer motif frequencies from both the Watson and Crick strands of a given reference genome; (C), The observed end motif frequency was normalized by the expected end motif frequency, and the resultant value was referred to as the O/E ratio.
To validate the normalization method, we studied the DNA end motif in the sequencing data of sonicated genomic DNA of nuclear, mitochondrial, and microbial (Escherichia coli) origin using this method. The heatmap plot was used to visualize the patterns of the O/E ratios of the 4-mer end motifs, across sonicated DNA molecules originating from nuclear, mitochondrial, and microbial genomes (Fig. 4A). After normalization, there was nearly no preference in the 256 end motifs of sonicated DNA from the 3 types of genome. The O/E ratios were close to 1 for all the end motifs and showed minor variations among the sonicated nuclear DNA (interquartile range [IQR]: 0.931.07; coefficient of variation [CV]: 0.12), mitochondrial DNA (IQR: 0.931.06; CV: 0.11), and microbial DNA (IQR: 0.931.09; CV: 0.12). In contrast, the variations among the observed frequencies of end motifs were much higher without normalization (CV: 0.58 [nuclear DNA], 0.44 [mitochondrial DNA] and 0.38 [microbial DNA]; Supplemental Fig. 1). The results indicated that the normalization method could minimize the influence of sequence context present in different genomes on the end motif analysis.

Comparison of end motifs for plasma cfDNA molecules originating from different genomic origins. (A), Heatmap of O/E ratios of 4-mer end motifs for sonicated DNA molecules among nuclear, mitochondrial, and E. coli genomes; (B), Heatmap of O/E ratio of 4-mer end motifs for plasma cfDNA from pooled sequences of nuclear, mitochondrial, and microbial cfDNA from 16 septic patients. The end motifs were ranked in descending order according to O/E ratio of end motifs in nuclear cfDNA; (C), Correlation of end motif rankings between microbial cfDNA and nuclear cfDNA; (D), Correlation of end motif rankings between mitochondrial cfDNA and nuclear cfDNA. Motifs were ranked in descending order according to their O/E ratios. Each dot represents an end motif and the 16 end motifs of CCNN pattern are labeled and highlighted in red.
End Motif Analysis of Plasma Microbial cfDNA in Septic Patients
We subsequently applied this normalization method to analyze the end motif profiles of pathogen-derived microbial cfDNA, nuclear cfDNA, and mitochondrial cfDNA. The plasma cfDNA sequencing data from all 16 septic patients were pooled for the subsequent analysis. In sharp contrast to the end motifs of sonicated DNA molecules (Fig. 4, A), several overrepresented and underrepresented end motifs were observed in all 3 types of cfDNA (Fig. 4, B). Such was evidenced by a wider range of O/E ratios and a higher CV value of the 256 4-mer motifs in nuclear cfDNA (IQR: 0.651.32, CV: 0.56), mitochondrial cfDNA (IQR: 0.681.30, CV: 0.48) and microbial cfDNA (IQR: 0.741.14, CV: 0.34). The end motifs with high frequencies (indicated in the red end of the color spectrum) tended to be C-end for the 3 types of genome (Fig. 4, B). The results indicated that both the microbial and mitochondrial cfDNA were subjected to nonrandom fragmentation, to some extent resembling the characteristics of nuclear cfDNA.
To quantitatively analyze end motif preference, we further ranked the 256 4-mer end motifs of microbial cfDNA in descending order according to the O/E ratio. Nine of the top 10 end motifs of nuclear cfDNA started with CC ends, i.e., the CCNN pattern (N denotes A, C, T, or G), which was consistent with previous reports (5, 6). Such CC ends were deemed DNASE1L3 cleavage signatures of plasma DNA. Interestingly, 9 out of the top 10 4-mer end motifs of microbial cfDNA shared the same CCNN patterns. Additionally, there was a strong positive correlation between microbial cfDNA and nuclear cfDNA (Spearman 0.82; P 0.001) (Fig. 4, C), suggesting that the fragmentation of microbial cfDNA in human plasma might in part share the enzymatic pathway with that of nuclear cfDNA, for example, the involvement of DNASE1L3. Of note, a high correlation was also observed between mitochondrial cfDNA and nuclear cfDNA (Spearman 0.90; P 0.001), and 9 out of the top 10 motifs started with CC (Fig. 4, D). The data further highlighted certain similarity in fragmentation among cfDNA molecules of different origins occurring in blood circulation. Of note, end motif analysis on nuclear-derived cfDNA suggested that the age or sex factors played little role in fragmentation patterns of plasma cfDNA in this cohort (Supplemental Figs. 2 and 3).
Comparison of End Signatures Between Infection-Causing Pathogen-Derived Microbial cfDNA and Contaminating Microbial DNA
We showed that the fragmentation of microbial cfDNA in plasma was similar to that of nuclear and mitochondrial cfDNA, which might involve similar enzymatic processes mediated by nucleases. We postulated that contaminating microbial DNA introduced during sample preparation and sequencing was likely fragmented by other processes different from those in blood. Therefore, we conjectured that the end motif profiles of pathogen-derived microbial cfDNA would be different from the contaminating microbial DNA identified in NTC samples. In view of the low abundance of microbial DNA (usually 1000 DNA fragments), some 4- or 3-mer motifs could only be detected at low frequencies or undetectable even at the genus level (Supplemental Fig. 4). Hence, we adopted 2-mer end motif analysis (16 combinations in total) so that more samples were eligible for the subsequent comparative analysis.
Microbial DNA molecules from the top 30 microbial genera found in NTC samples were defined as contaminating microbial DNA, and microbial DNA from the pathogens confirmed by microbiological culture (25 genera in total) in the 16 septic patients was considered as pathogen-derived microbial cfDNA. The O/E ratios of 2-mer end motifs for the 2 categories of microbial DNA fragments were calculated. As shown in Fig. 5, A, for contaminating microbial DNA within each genus, the O/E ratios were close to 1 (median: 1.01) for each 2-mer end motif, with a mean CV of 0.17 across the different genera. In contrast, the mean CV of the O/E ratios of pathogen-derived microbial cfDNA of the 25 genera was 0.41, which was significantly higher than that of contaminating microbial DNA (P 0.001, MannWhitney U-test). These data suggested that fragmentation patterns were different between contaminating microbial DNA and pathogen-derived microbial cfDNA, as evidenced by the different 2-mer end motif profiles.
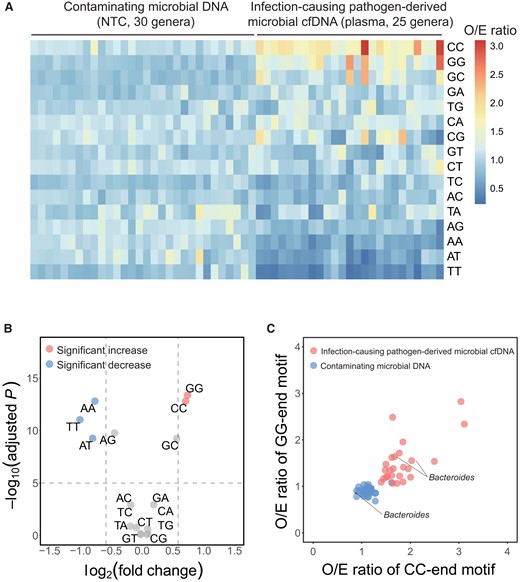
Determination of end motif signatures of pathogen-derived microbial cfDNA. (A), The heatmap illustrates the O/E ratios of 2-mer end motifs between contaminating microbial DNA (30 genera) and pathogen-derived microbial cfDNA (25 genera). End motifs were sorted in descending order based on the mean value of O/E ratios among pathogen-derived microbial cfDNA; (B), Volcano plot showing the fold change vs statistical significance (false discovery rate (FDR) adjusted P value) when comparing pathogen-derived microbial cfDNA and contaminating microbial DNA in terms of O/E ratio. The significantly overrepresented (fold change 1.5, adjusted P 105) and underrepresented (fold change 0.67, adjusted P 105) end motifs in pathogen-derived cfDNA were denoted in red and blue colors, respectively; (C), Scatterplot showing O/E ratios of CC-end motif and O/E ratios of GG-end motif between contaminating microbial DNA (blue dots) and pathogen-derived microbial cfDNA (red dots). The Bacteroides signals were included in both groups and labeled in the graph.
We further identified the most differentially represented end motifs between contaminating microbial DNA and pathogen-derived microbial cfDNA by volcano plot analysis (i.e., P values plotted against fold changes) (Fig. 5, B). For the pathogen-derived microbial cfDNA, CC and GG ends were the 2 most overrepresented end motifs (fold change: 1.63 and 1.67; adjusted P 1.56 1013 and 4.15 1014), whereas TT, and AT ends were the 2 most underrepresented end motifs (fold change: 0.50 and 0.57; adjusted P 9.09 1012 and 5.49 1010). The scatterplot of the O/E ratios of CC- vs GG-end motifs showed that most of the genera of contaminating microbial DNA were clustered together, whereas those genera of pathogen-derived cfDNA were clustered into another group (Fig. 5, C). Of note, sequences from the Bacteroides genus were present in both contaminating microbial DNA and pathogen-derived microbial cfDNA groups. In this case, if microbial DNA was classified in a testing sample as a contaminant solely based on whether it was also found in the NTC sample, then the Bacteroides sequences would have been wrongly interpreted as a contaminant. Instead, using CC- and GG-end signatures, the Bacteroides (from septic patients S1 and S12) was determined as a true pathogen even though it was also present in the NTC sample.
Application of Microbial cfDNA End Signature in Pathogen Detection
We then combined the O/E ratio of the two most overrepresented end motifs in pathogen-derived microbial cfDNA (CC- and GG-end motifs) into one metric, referred to as microbial cfDNA end signature score (Supplemental Methods). Computer simulation analysis via downsampling (Supplemental Methods) suggested that 200 microbial DNA fragments would be sufficient for robust determination of the microbial cfDNA end signature score (Supplemental Fig. 5).
We further explored the potential clinical implication of the microbial cfDNA end signature in pathogen detection. Hence, we sequenced plasma samples from 38 participants without infection (noninfection group). Microbial DNA sequences found in these samples were likely due to DNA contamination. We evaluated the use of the 2 parameters, i.e., microbial DNA abundance (reads per million sequencing reads) and microbial cfDNA end signature score, for differentiation of contaminating microbial DNA and pathogen-derived microbial cfDNA. There were 180 microbial genera (with at least 200 DNA fragments for each genus) detected from the 38 noninfection samples (Supplemental Table 5). Regarding the microbial DNA abundance, although the median DNA abundance was significantly higher for those confirmed microbes identified from septic patients than that of participants without infection (median reads per million: 36.69 vs 4.10; P 9.37 1011, MannWhitney U-test), there was substantial overlap between the 2 groups (Fig. 6, A). The data reflected the difficulty in differentiating pathogenic microbes from contaminating microbes based on abundance alone.
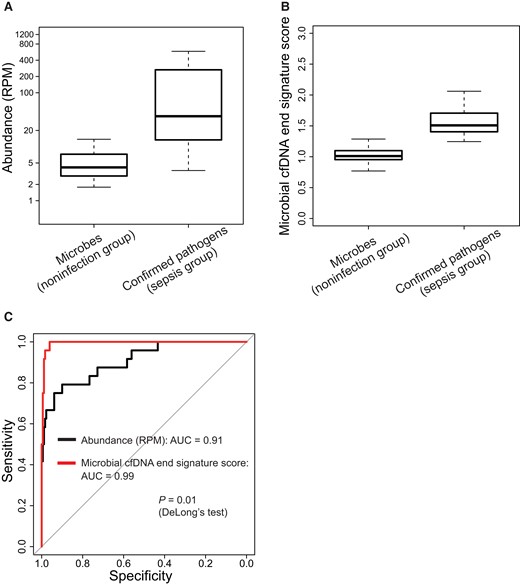
Application of microbial cfDNA end signature score in pathogen detection. The boxplots illustrate the difference in DNA abundance (A) and microbial cfDNA end signature score (B), respectively, between contaminating microbes in participants without infection and confirmed pathogens in septic patients. (C), The performance was further illustrated by ROC analysis. RPM, reads per million sequencing reads.
For the microbial cfDNA end signature score, the median score was significantly higher in those microbes confirmed in culture compared to microbial genera from participants without infection (median: 1.51 vs 1.01; P 3.81 1015, MannWhitney U-test) (Fig. 6, B). Receiver operating characteristic (ROC) analysis showed that the microbial cfDNA end signature score achieved an area under the ROC curve (AUC) of 0.99 in differentiating between pathogenic microbes in septic patients and contaminating microbes in participants without infection, which appeared to be superior to the method based on microbial DNA abundance alone (AUC: 0.91; P 0.01, DeLong test; Fig. 6, C). Additionally, for differentiating pathogenic and contaminating genera with comparable fragment counts (those with fragment counts 1000 were analyzed) within the sepsis group and noninfection group, we still observed a better performance of the end signature score, compared with the microbial abundance-based method (P 0.008, DeLongs test; Supplemental Fig. 6). These results suggested that the use of end motif signatures may facilitate the differentiation of true pathogens from potentially contaminating microbes in microbial DNA analysis.
The potential advantage of microbial cfDNA analysis with end signature score was further highlighted in patient S1. This patient had a perforated bowel with intraoperative peritoneal swabs showing positive culture results for Bacteroides and Klebsiella. The 2 pathogens were also the most abundant microbes in the plasma sequencing data. In addition, the sequencing results revealed another 8 microbial genera (with at least 200 fragments) that were part of the normal gut flora or opportunistic pathogens (26) (Supplemental Table 4). Moreover, 7 out of the 8 genera were above the microbial cfDNA end signature score cutoff deduced from NTC samples (1.28, Supplemental Methods), implying that they might be sample-intrinsic pathogens rather than contaminating microbes introduced during sample processing (Supplemental Table 4). Of note, for those genera passing the filtering criterion of end signature score, the microbial fragments could be further classified into the species listed in Supplemental Table 5.
To further validate the performance of the microbial cfDNA end signature score, we performed microbial DNA end motif analysis on a public dataset from a study by Hong et al. (27). We observed a much higher abundance of contaminating microbial DNA in the public dataset, suggesting that those samples might be subjected to severe contamination during sample processing. The power of microbial DNA end motif analysis in differentiating between contamination and pathogen-derived microbial cfDNA could be well reproduced, greatly outperforming the abundance-based approach (AUC: 0.93 vs 0.55) (Supplemental Fig. 7).
To model the technical sensitivity of pathogenic genera detection in relation to sequencing depth, we performed a computer simulation (see details in Supplementary Material). Given a fractional concentration of microbial cfDNA in plasma at 3.84 106 (i.e., 5th percentile of the microbial cfDNA concentration in our cohort of septic patients), 57 million total sequenced fragments would be required for achieving a detection rate of 95 (Supplemental Fig. 8). Considering the ultra-short nature of microbial cfDNA fragments in plasma, if we could apply an experimental size selection of shorter cfDNA fragments in plasma prior to sequencing in the future (Supplemental Fig. 9), we would expect that 14 million sequenced fragments could enable most of the pathogens (95) to have sufficient reads for end motif analysis.
Discussion
This study revealed characteristic end motifs of pathogen-derived microbial cfDNA molecules detected in plasma samples from septic patients. The end profiles of microbial cfDNA molecules derived from pathogens resembled the characteristics of nuclear cfDNA, which preferentially carry CC ends. Previous studies demonstrated that the CC end was reflective of DNASE1L3 activity in plasma (2, 4, 5). Hence, fragmentations of pathogen-derived microbial cfDNA molecules might also involve enzymatic processes (e.g., DNASE1L3), leading to the nonrandom cleavage patterns of microbial cfDNA in plasma. The finding opens up possibilities of developing fragmentomic biomarkers for the differentiation of true pathogenic microbial cfDNA from contaminating microbial sequences present in massively parallel sequencing results.
To minimize the potential biases for end motif analysis across sequence contexts from different genomes, such as nuclear, mitochondrial, and a variety of microbial genomes, a sequence context-based normalization process would be essential. The use of the ratio of observed end motif frequencies to expected end motif frequencies (O/E ratio) (i.e., sequence context-based normalization process) could help to reduce the influence of sequence contexts on end motif analysis. Among nuclear, mitochondrial, and microbial cfDNA, the resemblance of O/E ratios across 256 end motifs suggests that the cfDNA fragmentation from different sources in human plasma might, at least in part, share similar enzymatic pathways. Interestingly, the most abundant end motif started with the CC dinucleotide in microbial cfDNA molecules, suggesting that DNASE1L3 likely played one of the major roles in the degradation of microbial cfDNA in blood circulation.
With the use of characteristic end motifs of microbial cfDNA that were unappreciated before, we developed an approach for determining whether a microbial genus present in plasma was significantly enriched for end signatures linked to infection-causing pathogens with reference to contaminating microbial DNA. The use of informative end signatures could distinguish microbial DNA of causative pathogens in plasma from that of contaminating microbes. The fragmentomic feature-based approach for screening out the contaminating microbial DNA was shown to be superior to the conventional approach based on the read count parameter (9, 10, 25). Another potential limitation of the conventional approach might be the erroneous removal of genuine pathogens present at low biomass. Moreover, the downsampling analysis suggested that 200 microbial cfDNA fragments would be sufficient for the end motif signature analysis. Thus, the finding in this study offers a novel method to distinguish authentic signals of pathogens from background contamination in metagenomic analysis of plasma DNA sequencing. Nonetheless, similar to conventional microbiological cultures, microbial cfDNA end motif analysis should be interpreted alongside the clinical context. The taxonomic information of all detected microbes and the corresponding abundance would continue to be useful for clinical interpretation.
In this study, to obtain a relatively complete picture of the microbial cfDNA end motifs, we have performed comparatively high-depth plasma DNA sequencing. Future studies could focus on developing approaches for enrichment of microbial DNA from plasma samples, making it possible to obtain sufficient microbial DNA reads for robust end motif analysis even at lower sequencing depths (2830).
The present study has focused on the analysis of fragmentation patterns of pathogen-derived microbial cfDNA. On the other hand, DNASE1L3 activities reflected by cfDNA fragmentomics were reported to be altered in plasma of patients with hepatocellular carcinoma and systemic lupus erythematosus (SLE) (6, 31). Apart from cfDNA fragmentation pattern itself, future studies may consider the direct assessment of enzyme activity of DNASE1L3 or other DNA nucleases as novel biomarkers for organ dysfunction from sepsis or other forms of tissue injury.
In summary, the fragmentation of microbial cfDNA was demonstrated to be nonrandom, sharing certain similar characteristics with nuclear-derived cfDNA. The use of fragmentomic features effectively aided the differentiation of pathogen-derived microbial cfDNA and contaminating microbial DNA. This study opens new possibilities of developing fragmentomic feature-based approaches for dissecting the microbiome in plasma.
Data Availability
Raw sequencing data of all the samples used in this study were submitted to European Genome-Phenome Archive, https://www.ebi.ac.uk/ega/, with the accession number of EGAS00001006321.
Supplementary Material
Supplementary material is available at Clinical Chemistry online.
Nonstandard Abbreviations
cfDNA, cell-free DNA; DNASE1L3, deoxyribonuclease 1 like 3; DNASE1, deoxyribonuclease 1; CV, coefficient of variation; IQR, interquartile range; ROC, receiver operating characteristic; AUC, area under the ROC curve.
Author Contributions
The corresponding author takes full responsibility that all authors on this publication have met the following required criteria of eligibility for authorship: (a) significant contributions to the conception and design, acquisition of data, or analysis and interpretation of data; (b) drafting or revising the article for intellectual content; (c) final approval of the published article; and (d) agreement to be accountable for all aspects of the article thus ensuring that questions related to the accuracy or integrity of any part of the article are appropriately investigated and resolved. Nobody who qualifies for authorship has been omitted from the list.
G. Wang, W.K.J. Lam, L. Ling, P. Jiang, K.C.A. Chan, and Y.M.D. Lo designed the research. G. Wang and S. Ramakrishnan performed the experiments. G. Wang performed bioinformatics data analysis. G. Wang, W.K.J. Lam, P. Jiang, M.L. Ma, L. Ling, and Y.M.D. Lo wrote the manuscript. L. Ling, W.T. Wong recruited clinical samples and interpreted clinical data. G. Wang, W.K.J. Lam, L. Ling, P. Jiang, R.W.K. Chiu, K.C.A. Chan, and Y.M.D. Lo reviewed and interpreted the data.
Authors Disclosures or Potential Conflicts of Interest
Upon manuscript submission, all authors completed the author disclosure form. Disclosures and/or potential conflicts of interest:
Employment or Leadership
Y.M.D. Lo, Clinical Chemistry, AACC. Y.M.D. Lo is a scientific co-founder of Grail and has leadership or fiduciary role in Take2, DRA, and Centre for Novostics. K.C.A. Chan is a director of DRA, Take2, and Centre for Novostics. P. Jiang is a Director of DRA and KingMed Future. R.W.K. Chiu, Board of DRA, Board of Take2, and Secretary of International Society of Prenatal Diagnosis.
Consultant or Advisory Role
P. Jiang, K.C.A. Chan, R.W.K. Chiu, and Y.M.D. Lo were consultants to Grail. R.W.K. Chiu was a consultant to Illumina. P. Jiang is a consultant to Take2 and KMF. W.K.J. Lam served as a consultant to Grail. L. Ling received consulting fees from Merck Co.
Stock Ownership
K.C.A. Chan, R.W.K. Chiu, and Y.M.D.L. hold equities in DRA, Take2, and Grail/Illumina. P. Jiang holds equities in Grail/Illumina, DRA, and Take2. W.K.J. Lam holds equities in Grail/Illumina.
Honoraria
R.W.K. Chiu, Illumina.
Research Funding
This work was supported by a Collaborative Research Agreement from Grail and the Innovation and Technology Commission under the InnoHK Initiative. Y.M.D. Lo is supported by an endowed chair from the Li Ka Shing Foundation. P. Jiang, R.W.K. Chiu, K.C.A. Chan and Y.M.D. Lo, Research Grants Council of the Hong Kong Special Administrative Region (SAR) Government under the Theme-based research scheme (T12-401/16-W). This work was supported by a Faculty Innovation Award from The Chinese University of Hong Kong (FIA2019/B/01) to L. Ling.
Expert Testimony
None declared.
Patents
G. Wang, W.K.J. Lam, P. Jiang, K.C.A. Chan, R.W.K. Chiu and Y.M.D. Lo have filed patent applications based on the data generated from this work. Patent royalties are received from Grail, Illumina, Sequenom, DRA, Take2 Health, and Xcelom.
Other Remuneration
K.C.A. Chan received travel support from BioRad. S.C.Y. Yu, royalties or licenses: Illumina, Xcelom, Take2, DRA. P. Jiang, royalties or licenses: Illumina, Grail, Xcelom, DRA, Take2, Sequenom. R.W.K. Chiu, royalties or licenses: Illumina, Grail, Xcelom, DRA, Take2, Sequenom, support for attending meetings, and/or travel from Illumina. K.C.A. Chan, royalties or licenses: Illumina, Grail, Take2, DRA, Sequenom, Xcelom. Y.M.D. Lo, royalties or licenses: Illumina, Grail, Xcelom, DRA, Take2, Sequenom.
Role of Sponsor
The funding organizations played no role in the design of study, choice of enrolled patients, review and interpretation of data, preparation of manuscript, or final approval of manuscript.
Acknowledgments
We would like to thank Ms. Yongjie Jin, Dr. Huimin Shang, and Mr. Wenlei Peng for their technical assistance.
References
Author notes
Guangya Wang, W K Jacky Lam and Lowell Ling contributed equally to this work.
