


Abstract
Determining serum 25-hydroxyvitamin D [25(OH)D], 24,25-dihydroxyvitamin D [24,25(OH)2D] and the vitamin D metabolite ratio (VMR) allows the identification of individuals with a low vitamin D metabolite profile. Here, we evaluated if such a functional approach provides superior diagnostic information to serum 25(OH)D alone.
25(OH)D, 24,25(OH)2D, and the VMR were determined in participants of the DESIRE (Desirable Vitamin D Concentrations, n = 2010) and the LURIC (Ludwigshafen Risk and Cardiovascular Health, n = 2456) studies. A low vitamin D metabolite profile (vitamin D insufficiency) was defined by a 24,25(OH)2D concentration <1.2 ng/mL (<3 nmol/L) and a VMR <4%. Parathyroid hormone (PTH) and bone turnover markers were measured in both cohorts, whereas 10-year mortality data was recorded in LURIC only.
The median age in DESIRE and LURIC was 43.3 and 63.8 years, respectively. Median 25(OH)D concentrations were 27.2 ng/mL (68.0 nmol/L) and 15.5 ng/mL (38.8 nmol/L), respectively. Serum 25(OH)D deficiency, defined as <20.2 ng/mL (<50 nmol/L), was present in 483 (24.0%) and 1701 (69.3%) participants of DESIRE and LURIC, respectively. In contrast, only 77 (3.8%) and 521 (21.2%) participants had a low vitamin D metabolite profile. Regardless of the serum 25(OH)D concentration, a low vitamin D metabolite profile was associated with a significantly higher PTH, accelerated bone metabolism, and higher all-cause mortality than an unremarkable vitamin D metabolite profile.
The personalized assessment of vitamin D status using a functional approach better identifies patients with accelerated bone metabolism and increased mortality than the use of a fixed 25(OH)D cutoff of 20 ng/mL (50 nmol/L).
Introduction
Vitamin D deficiency affects large parts of the population in developed countries (1). As a key regulator of calcium and phosphate homeostasis, vitamin D is essential for bone mineralization and the prevention of rickets and osteomalacia (2). Vitamin D deficient individuals have impaired intestinal and renal calcium absorption, which may lead to secondary hyperparathyroidism, with parathyroid hormone (PTH) triggering the release of calcium from bone. Subsequent activation of bone-absorbing osteoclasts not only mobilizes calcium, but also causes generalized bone loss leading to reduced bone mineral density (BMD) and osteoporosis. Moreover, the increased secretion of PTH causes phosphaturia, reduces the availability of phosphorus, and alters the calcium–phosphorus product, which further compromises bone mineralization (3).
Existing guidelines recommend the assessment of vitamin D status by measuring serum 25-hydroxyvitamin D [25(OH)D]. This inactive prohormone is the main circulating vitamin D metabolite and is considered to represent the body’s vitamin D reservoir. In current clinical practice, universal cutoffs are used for the interpretation of serum 25(OH)D results (4). These cutoffs are primarily based on risk for adverse bone-related outcomes, such as rickets, osteomalacia, osteoporosis, and fragility fractures (5). However, the use of such universal cutoffs is flawed. People with dark skin have significantly lower 25(OH)D serum concentrations than those with light skin, but comparable or even higher BMD and lower fracture risk (6, 7). This implies that 25(OH)D incompletely reflects biology. Observations that only a small fraction of individuals with 25(OH)D concentrations in the deficient range have impaired bone mineralization further support this concept (8). Another issue is the variable analytical performance of widely used immunoassays (9), which limits the comparison of results.
Isotope dilution liquid chromatography–tandem mass spectrometry (LC-MS/MS) is the preferred technique for the measurement of 25(OH)D and other metabolites, such as 24,25-dihydroxyvitamin D [24,25(OH)2D]. For both metabolites, existing LC-MS/MS-based reference measurement procedures allow their accurate quantitation (10, 11). The simultaneous measurement of 2 or more metabolites provides dynamic information on vitamin D metabolism and is useful in the diagnostic workup of Black individuals (6, 12), patients with 24-hydroxylase deficiency, and other enzyme defects (13, 14). Furthermore, Wagner et al. proposed the vitamin D metabolite ratio (VMR) as a predictor of the 25(OH)D response to vitamin D supplementation (15). A recent study in young Belgians suggests that the simultaneous analysis of 25(OH)D and 24,25(OH)2D permits an individualized assessment of the vitamin D status that may be superior to the use of a universal 25(OH)D cutoff (16). It has been speculated that this allows the identification of individuals with functional vitamin D deficiency, who have no 25(OH)D to spare for catabolism and thus have very low 24,25(OH)2D concentrations (17). Amongst the large number of people with low vitamin D stores, individuals with functional vitamin D deficiency may have an increased risk for adverse health outcomes compared to those without. In line with this concept, Ginsberg et al. reported associations between 24,25(OH)2D, the VMR, and bone related outcomes, such as BMD and fracture risk (18, 19). However, there are no validated criteria for the interpretation of vitamin D metabolites, VMR, and bone metabolism.
Hence, we aimed to investigate the utility of 25(OH)D and 24,25(OH)2D to identify a low vitamin D metabolite profile that is associated with accelerated bone metabolism. In addition, we wanted to explore if a low vitamin D metabolite profile is a better predictor of mortality than a low 25(OH)D concentration. For this purpose, both vitamin D metabolites, PTH, and bone turnover marker (BTM) were measured in 2 large cohorts of adult individuals.
Materials and Methods
Study Cohorts
The Desirable Vitamin D Concentrations (DESIRE) study is an observational study designed to investigate vitamin D metabolites in relation to genetic variants of enzymes involved in vitamin D metabolism. In total, 2010 Austrian blood donors were included between July 2019 and July 2021. For inclusion in the study, the criteria for clearance to donate blood had to be met. The exclusion criteria included individuals under the age of 18 years, individuals suffering from acute or chronic illnesses such as malignant tumors, and women who were pregnant. Routine blood samples were collected for the study prior to whole blood donation. Serum aliquots were prepared immediately and stored at −80°C until analysis.
The Ludwigshafen Risk and Cardiovascular Health (LURIC) study is a prospective observational study that included 3316 White patients hospitalized for elective diagnostic coronary angiography at the Heart Centre Ludwigshafen between June 1997 and January 2000. A detailed description of the LURIC study has been published previously (20, 21). Inclusion criteria were: German ancestry, clinical stability (except for acute coronary syndromes), and availability of coronary angiogram. Exclusion criteria were: any acute illness other than acute coronary syndromes, any chronic disease where noncardiac disease predominated, and a history of malignancies within the past 5 years. Fasting venous plasma was obtained on the day of coronary angiography and stored at −80°C until analysis.
The following blood biomarkers were measured with standard laboratory assays on a COBAS 8000 analyzer (Roche Diagnostics): calcium, PTH, C-terminal crosslinks of collagen type I (CTX), total procollagen-N-terminal-peptide (PINP, DESIRE only), osteocalcin (OCN, LURIC only), C-reactive protein, albumin, alanine aminotransferase, asparagine aminotransferase, gamma-glutamyl transferase, bilirubin, cholinesterase, and creatinine. Creatinine results were used to estimate the glomerular filtration rate with the 2009 Chronic Kidney Disease Epidemiology Collaboration (CKD-EPI)-equation (22).
The participants of the LURIC study were followed over a median observation period of 9.9 years (25th–75th centiles: 8.8–11.0 years). Information about survival was obtained from local person registers. Two physicians blinded to baseline characteristics of the participants classified causes of death by reviewing hospital records and death certificates.
Both studies were carried out in accordance with the Declaration of Helsinki and were approved by the local ethics committees (DESIRE, Medical University Graz: EK 31-344 ex 18/19; LURIC ethics board, physician chamber, Rheinland Pfalz: No. 1997-203). All participants provided written informed consent prior to inclusion. Sample selection strategy for both cohorts is shown in Fig. 1.
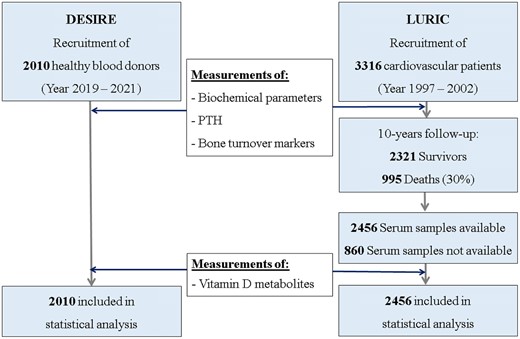
Sample selection strategy for analytic sample for DESIRE (n = 2010) and LURIC (n = 2456).
Determination of Vitamin D Metabolites
25(OH)D and 24,25(OH)2D were measured with an established LC-MS/MS method (13). Intra- and inter-day imprecision for all vitamin D metabolites tested was <9% and <12%, respectively. For all metabolites, limit of detection (LOD) and limit of quantification (LOQ, lowest concentration where the assay gives an inter-assay imprecision of <15%) ranged from 0.12 to 0.60 ng/mL (0.3 to 1.5 nmol/L) and 0.40 to 1.24 ng/mL (1.0 to 3.1 nmol/L), respectively. Recovery varied between 76.1% and 84.3%. Since 2020 this method has performed satisfactorily in the Vitamin D External Quality Assessment Scheme (DEQAS), with target values assigned by the Centers of Disease Control and Prevention (CDC) reference measurement procedure using certified reference material (SRM 2972a) from the National Institute of Standards and Technology [NIST]) (10, 23, 24).
Regardless of their respective 25(OH)D concentration, both 24,25(OH)2D and VMR cutoffs for a low vitamin D metabolite profile have been derived from the DESIRE cohort by exploring the respective descriptive statistical analyses. The 1.2 ng/mL (3 nmol/L) threshold for 24,25(OH)2D represents the upper limit of the first quartile rounded to the nearest whole number. Additional analyses of the DESIRE cohort revealed substantially lower VMR and higher PTH values with minimal overlap to the remaining cohort when 24,25(OH)2D was <1.2 ng/mL (<3 nmol/L) and 25(OH)D was <10 ng/mL (<25 nmol/L). Rounding the median VMR of this subgroup to the next whole number yielded a threshold of 4%. Although these criteria are arbitrary, they are aligned with a previous study, where the association of vitamin D metabolites with cognitive function has been investigated (23). An unremarkable vitamin D metabolite profile was assumed when 24,25(OH)2D3 was at least 1.2 ng/mL (3 nmol/L) and the VMR was 4% and higher. Individuals that satisfied only 1 of the 2 functional criteria were classified as having a suboptimal vitamin D metabolite profile. The conversion of mass units (nmol/L) to SI units (ng/mL) was performed by division by 2.5.
Statistical Analysis
Descriptive statistics of continuous parameters are provided as medians and interquartile ranges (IQRs). Categorical variables are expressed as numbers and percentages. The Mann–Whitney U-test was used to compare non-normally distributed continuous variables. Survival curves were calculated by Kaplan–Meier analyses. Hazard ratios (HRs) were calculated by Cox proportional hazards regression. The proportional hazard assumption was checked by examination of scaled Schoenfeld residuals.
Descriptive statistics and Mann–Whitney U-tests were performed using SPSS statistical software (version 26.0; IBM Corp.). Kaplan–Meier analyses and Cox proportional hazards regression analyses were carried out using R version 4.1.2 (http://www.r-project.org).
Results
Bone Metabolism in Individuals With 25(OH)D Deficiency and A Low Vitamin D Metabolite Profile
A complete set of results was available from 2010 participants of DESIRE and 2456 participants of LURIC with median ages of 45 (IQR 18–74) years and 64 (IQR 19–92) years, respectively (online Supplemental Table 1). Both cohorts had a similar gender distribution with more than 60% male. DESIRE and LURIC are two rather different cohorts regarding participants' age, gender, general health status, hormonal status, medication, and cardiovascular risk profile including C-reactive protein (CRP). These differences can influence the distribution of analytes with a rather high biological variability, such as PTH, PINP, and CTX. In LURIC, the median body mass index (BMI) was 27.1 kg/m2 (IQR 24.7–29.7 kg/m2). For DESIRE, BMI data was not available as this is not part of the standard examination of blood donors in Austria. The median 25(OH)D concentrations in DESIRE and LURIC were 27.2 ng/mL (68.0 nmol/L) and 15.5 ng/mL (38.8 nmol/L), respectively. In the DESIRE and LURIC cohorts, 483 (24.0%) and 1701 (69.3%) participants, respectively, had a 25(OH)D concentration below the 20.0 ng/mL (50 nmol/L) cutoff for vitamin D deficiency. PTH and BTMs were slightly higher in individuals with 25(OH)D concentrations below 20.0 ng/mL (50 nmol/L) than in those above this threshold (Table 1). These differences did not exceed 10%.
Parameters of bone metabolism in participants of DESIRE and LURIC with and without 25(OH)D deficiency, and in individuals with and without low vitamin D metabolite profile.
| Parameter | Functional assessment | Assessment by fixed 25(OH)D cutoff | ||||
|---|---|---|---|---|---|---|
| Low vitamin D metabolite profile | Unremarkable vitamin D metabolite profile | P-value | <20 ng/mL | ≥20 ng/mL | P-value | |
| DESIRE | ||||||
| No. | 77 | 1611 | 483 | 1527 | ||
| 25(OH)D3, median (IQR), ng/mLa | 15.3 (10.6–19.1) | 29.1 (23.8–35.5) | <0.001 | 16.0 (13.4–18.2) | 29.9 (24.7–36.0) | <0.001 |
| 24,25(OH)2D3, median (IQR), ng/mLa | 0.52 (0.32–0.64) | 2.26 (1.76–2.84) | <0.001 | 1.00 (0.69–2.50) | 2.27 (1.78–2.88) | <0.001 |
| VMR, median (IQR), % | 3.3 (2.8–3.6) | 7.8 (6.7–9.2) | <0.001 | 6.3 (4.8–7.9) | 7.6 (6.4–9.0) | <0.001 |
| PTH, median (IQR), ng/L | 33.7 (24.6–47.8) | 26.8 (20.7–33.8) | <0.001 | 29.1 (22.1–38.1) | 27.0 (20.9–33.7) | <0.001 |
| PINP, median (IQR), µg/L | 55.2 (44.8–76.6) | 47.4 (36.4–62.1) | 0.072 | 51.6 (38.8–68.5) | 47.4 (36.3–62.3) | 0.002 |
| CTX, median (IQR), µg/L | 0.25 (0.17–0.31) | 0.21 (0.15–0.29) | <0.001 | 0.23 (0.16–0.30) | 0.21 (0.15–0.30) | 0.015 |
| LURIC | ||||||
| No. | 521 | 925 | 1701 | 755 | ||
| 25(OH)D3, median (IQR), ng/mLa | 9.0 (6.2–12.2) | 23.4 (19.6–29.2) | <0.001 | 11.2 (7.8–15.4) | 25.6 (2.1–30.4) | <0.001 |
| 24,25(OH)2D3, median (IQR), ng/mLa | 0.24 (0.12–0.40) | 1.89 (1.48–2.48) | <0.001 | 0.59 (0.31–0.94) | 1.95 (1.52–2.64) | <0.001 |
| VMR, median (IQR), % | 2.7 (1.7–3.4) | 8.1 (6.9–9.7) | <0.001 | 5.3 (3.7–7.0) | 7.6 (6.2–9.3) | <0.001 |
| PTH, median (IQR), ng/L | 36.0 (26.0–49.0) | 26.0 (20.0–34.0) | <0.001 | 31.0 (23.0–42.0) | 26.0 (20.0–34.0) | <0.001 |
| OCN, median (IQR), µg/L | 20.0 (14.9–29.8) | 17.9 (13.6–22.8) | <0.001 | 18.4 (13.6–24.9) | 18.1 (13.8–22.9) | 0.439 |
| CTX, median (IQR), µg/L | 0.36 (0.24–0.53) | 0.29 (0.21–0.42) | <0.001 | 0.37 (0.21–0.46) | 0.30 (0.22–0.43) | 0.068 |
a Vitamin D metabolite concentrations are presented in SI units (ng/mL). The mass units (nmol/L) were converted to SI units (ng/mL) by dividing by 2.5.
A low vitamin D metabolite profile was found in 77 (3.8%) and 521 (21.2%) participants of DESIRE and LURIC, respectively. The median 25(OH)D concentrations in these individuals were 15.3 ng/mL (38.3 nmol/L) and 9.0 ng/mL (22.5 nmol/L), respectively. An unremarkable vitamin D metabolite profile was found in 1611 and 925 individuals in DESIRE and LURIC, respectively. Notably, the median 25(OH)D concentration of this group was <20.0 ng/mL (<50 nmol/L) in both cohorts. Both individuals with and without a low vitamin D metabolite profile included cases with 25(OH)D concentrations above and below 20.0 ng/mL (50 nmol/L, Fig. 2).
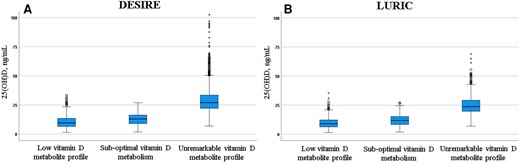
Distribution of 25(OH)D concentrations in DESIRE and LURIC studies according to functional vitamin D status. (A), Of the whole DESIRE cohort, 77 participants had a low vitamin D metabolite profile, 322 had a suboptimal vitamin D metabolism, and 1611 participants had an unremarkable vitamin D metabolite profile; (B), Of the whole LURIC cohort, 521 had a low vitamin D metabolite profile, 1010 had a suboptimal vitamin D metabolism, and 925 had an unremarkable vitamin D metabolite profile; A low vitamin D metabolite profile was defined as 24,25(OH)2D <1.2 ng/mL (3 nmol/L) and a VMR <4% as calculated by multiplying the ratio of 24,25(OH)2D/25(OH)D by 100. Participants with only 1 of the 2 functional criteria were classified to have suboptimal vitamin D metabolism.
Comparing PTH and BTMs in individuals with and without a low vitamin D metabolite profile revealed markedly accelerated bone metabolism in the first group (Table 1). The differences between individuals with a low and an unremarkable vitamin D metabolite profile reached up to 28% for PTH and 20% for CTX. Also, the bone formation markers PINP and OCN trended higher in individuals with a low vitamin D metabolite profile. When compared to individuals with 25(OH)D concentrations <20 ng/mL, a low vitamin D metabolite profile was associated with significantly higher PTH (DESIRE: P = 0.002; LURIC: P < 0.001) and PINP (DESIRE: P = 0.040; LURIC: P < 0.001) concentrations in both cohorts. CTX was also higher in the presence of a low vitamin D metabolite profile, but only in LURIC (P < 0.001). In contrast, comparable PTH and BTM concentrations were seen in individuals with an unremarkable vitamin D metabolite profile and those with 25(OH)D concentrations ≥20 ng/mL (≥50 nmol/L, Table 2).
Comparable bone metabolism in participants with an unremarkable vitamin D metabolite profile, regardless of the 25(OH)D concentration.
| Parameter | 25(OH)D ≥20 ng/mL | Individuals with an unremarkable vitamin D metabolite profile | Individuals with 25(OH)D <20 ng/mL and an unremarkable vitamin D metabolite profile | P-valuea | P-valueb | P-valuec |
|---|---|---|---|---|---|---|
| DESIRE | ||||||
| No. | 1527 | 1611 | 153 | |||
| PTH, median (IQR), ng/L | 27.0 (20.9–33.7) | 26.8 (20.7–33.8) | 26.2 (20.2–34.6) | 0.906 | 0.707 | 0.876 |
| PINP, median (IQR), µg/L | 47.4 (36.3–62.3) | 47.4 (36.4–62.1) | 47.8 (38.7–63.4) | 0.765 | 0.926 | 0.975 |
| CTX, median (IQR), µg/L | 0.21 (0.15–0.30) | 0.21 (0.15–0.29) | 0.22 (0.16–0.28) | 0.936 | 0.783 | 0.728 |
| LURIC | ||||||
| No. | 755 | 925 | 251 | |||
| PTH, median (IQR), ng/L | 26.0 (20.0–34.0) | 26.0 (20.0–34.0) | 27.0 (20.5–36.0) | 0.153 | 0.950 | 0.165 |
| OCN, median (IQR), µg/L | 18.1 (13.8–22.9) | 17.9 (13.6–22.8) | 16.7 (12.9–22.9) | 0.042 | 0.231 | 0.213 |
| CTX, median (IQR), µg/L | 0.30 (0.22–0.43) | 0.29 (0.21–0.42) | 0.28 (0.19–0.40) | 0.048 | 0.319 | 0.181 |
For both cohorts, median (IQR) concentrations are shown for all individuals with 25(OH)D concentrations ≥20 ng/mL, individuals with an unremarkable vitamin D metabolite profile, and those with 25(OH)D concentrations <20 ng/mL, but an unremarkable vitamin D metabolite profile.
a25(OH)D ≥ 20 ng/mL vs 25(OH)D < 20 ng/mL, but without low vitamin D metabolite profile.
b25(OH)D ≥ 20 ng/mL vs all individuals without low vitamin D metabolite profile.
c25(OH)D < 20 ng/mL, but without low vitamin D metabolite profile vs all individuals without low vitamin D metabolite profile.
Assessing vitamin D status on metabolic principles resulted in the reclassification of 153 (31.7%) and 251 (14.8%) participants with 25(OH)D concentration <20.0 ng/mL (<50 nmol/L) in DESIRE and LURIC, respectively, as they showed an unremarkable vitamin D metabolite profile. In these individuals, PTH and all BTMs were similar to those with 25(OH)D concentrations ≥20.0 ng/mL (≥50 nmol/L, Table 2). Also, 16 and 18 individuals with 25(OH)D concentrations ≥20.0 ng/mL (≥50 nmol/L) were actually found with a low vitamin D metabolite profile.
A total of 322 and 1011 participants of DESIRE and LURIC fulfilled only 1 of the 2 criteria for a low vitamin D metabolite profile. These individuals showed lower PTH, CTX, OCN, and PINP concentrations than those with a low vitamin D metabolite profile. However, when compared to individuals with an unremarkable vitamin D metabolite profile, the median PTH, CTX, and PINP (only in DESIRE) concentrations were slightly higher indicating suboptimal bone metabolism. In the LURIC cohort, BMI results did not differ significantly between all 3 vitamin D metabolite profile groups (low metabolite profile vs suboptimal vitamin D metabolism: P = 0.304; low metabolite profile and an unremarkable vitamin D metabolite profile: P = 0.225; suboptimal vitamin D metabolism vs unremarkable vitamin D metabolite profile: P = 0.096).
Vitamin D Status and All-Cause Mortality
During the follow-up-period, 653 (23.6%) participants of LURIC died. Both ways of establishing vitamin D sufficiency were associated with a comparable 10-year mortality. Participants with a 25(OH)D concentration of ≥20.0 ng/mL (≥50 nmol/L) had an all-cause mortality of 19.5% (147/755), whereas an unremarkable vitamin D metabolite profile was associated with a mortality of 20.5% (190/925). Vitamin D-deficient individuals had a substantially higher mortality, regardless of the criterion used for diagnosis. Low 25(OH)D concentrations of <20.0 ng/mL (<50 nmol/L) were associated with a mortality of 30.6% (521/1701). Compared to the other stratified groups, all-cause mortality was highest in individuals with a low vitamin D metabolite profile (36.5%, n = 190/521) (Fig. 3). Using the latter group as reference, the 251 individuals with low 25(OH)D concentrations but an unremarkable vitamin D metabolite profile also had a substantially lower all-cause mortality with an HR (95% CI) of 0.532 (0.403–0.704). All-cause mortality was lowest in the group with an unremarkable vitamin D metabolite profile that also had sufficient 25(OH)D concentrations, HR (95% CI) 0.374 (0.300–0.467).
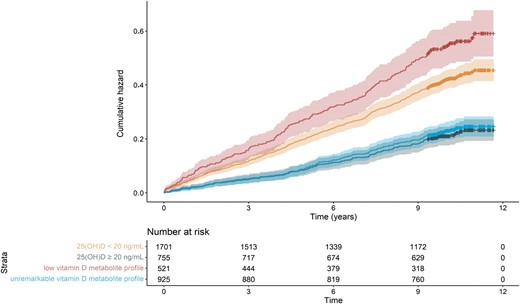
Cumulative hazard for all-cause mortality in the LURIC study. All-cause mortality was 36.5% (190/521) in individuals with a low vitamin D metabolite profile and 20.5% (190/925) in individuals with an unremarkable vitamin D metabolite profile; 25(OH)D concentrations of <20 ng/mL (<50 nmol/L) were associated with a mortality of 30.6% (521/1701); 25(OH)D concentrations ≥20 ng/mL (>50 nmol/L) were associated with an all-cause mortality of 19.5% (147/755). The x-axis displays the time in years elapsed since baseline visit. A low vitamin D metabolite profile was defined as 24,25(OH)2D <1.2 ng/mL (<3 nmol/L) and a VMR <4% as calculated by multiplying the ratio of 24,25(OH)2D/25(OH)D by 100.
Discussion
Functional assessment of vitamin D metabolism better discriminates patients with and without accelerated bone metabolism than the interpretation of 25(OH)D measurements using fixed cutoffs. In the presence of a low vitamin D metabolite profile, the serum concentrations of PTH and BTMs are significantly higher than in 25(OH)D deficiency. Furthermore, a low vitamin D metabolite profile is associated with a higher mortality rate. With the functional assessment of vitamin D metabolism proposed here, it was possible to identify a low vitamin D metabolite profile in 31.7% of individuals with low 25(OH)D concentrations in whom vitamin D supplementation may be particularly urgent.
The present results support previous studies that proposed the simultaneous measurement of 25(OH)D and 24,25(OH)2D by LC-MS/MS as a valid tool for a personalized evaluation of vitamin D deficiency (6, 12, 16). This approach assumes that critically low vitamin D reservoirs suppress 25(OH)D catabolism through a reduction of 24-hydroxylase activity, which results in very low 24,25(OH)2D concentrations. In 1200 juvenile individuals, Cavalier et al. observed that the lower the 25(OH)D concentration, the higher the number of individuals with 24,25(OH)2D concentrations below the LOQ (16). The LOQ of their 24,25(OH)2D method was 0.5 ng/mL (1.25 nmol/L) and thus calculation of the VMR was not possible in more than 25% of the individuals with low 25(OH)D. Given that 24,25(OH)2D could be quantitated in over 99% of all individuals with 25(OH)D concentration ≥20.0 ng/mL (≥50 nmol/L), they speculated that values below 0.5 ng/mL (<1.25 nmol/L) indicate biochemical vitamin D deficiency. Further support for a functional assessment of vitamin D metabolism comes from a study that assessed vitamin D and bone metabolism in Black and White participants (6). Despite 40% lower 25(OH)D concentrations in Black participants, the average VMR was similar in Black and White participants. Likewise, Black participants showed comparable bone health to White participants. In 2011, Wagner et al. previously suggested that the 24,25(OH)2D3:25(OH)D3 ratio may have the potential as a clinical marker of vitamin D catabolism (15).
In addition to a superior performance in diagnosing vitamin D deficiency, a functional assessment of vitamin D status is also helpful in identifying patients with 24-hydroxylase deficiency (13).
Our dynamic assessment of vitamin D metabolism seems to overcome some of the evident limitations associated with the estimation of vitamin D reservoirs by 25(OH)D and the use of fixed cutoffs for diagnosing deficiency. In particular, it seems to offer improved diagnostic specificity. Previous studies have shown that only a small fraction of individuals with 25(OH)D concentrations in the deficient range have impaired bone mineralization (8) and accelerated bone metabolism (25, 26). In addition, PTH varies substantially amongst individuals with low 25(OH)D concentrations (27–29). The vitamin D binding protein (VDBP) concentration and genotype also influence the 25(OH)D concentration (30), but do not necessarily alter bioavailable vitamin D (12, 31). Recognizing the diagnostic limitations of measuring only 25(OH)D, it is important to emphasize that out of 2184 participants from DESIRE and LURIC with deficient 25(OH)D concentrations, in 404 (18.5%) the vitamin D metabolite profile was unremarkable. The absence of clinically relevant vitamin D deficiency in these individuals is supported by the fact that bone metabolism was comparable to those with sufficient 25(OH)D concentrations. Moreover, all-cause mortality was similarly low in individuals with an unremarkable vitamin D metabolite profile and individuals with 25(OH)D concentrations of 20 ng/mL (50 nmol/L) and higher.
Another main advantage of measuring 25(OH)D and 24,25(OH)2D by LC-MS/MS is the excellent comparability of results between laboratories, when properly validated methods are used (32). Reference measurement procedures based on LC-MS/MS and standard reference materials have been developed for both metabolites allowing full traceability (10, 33). The widely available immunoassays for 25(OH)D have variable analytical performance with a bias of up to ±20%, and do not measure 24,25(OH)2D. Although many immunoassays are aligned to the existing reference system and possess certification by the Vitamin D Standardization and Certification Program (VDSCP), which is organized by the CDC in the United States, biased results still occur in a significant proportion of patients (34–37).
A main strength of this study is the inclusion of two large, independent cohorts. The functional assessment of vitamin D status could better identify individuals with accelerated bone metabolism and increased mortality risk, regardless of the circulating 25(OH)D concentration. The use of an established LC-MS/MS method with very low LOQs that allowed an accurate quantitation of the VMR in all participants further strengthens our results (13, 32). It can be expected that our approach for diagnosing a low vitamin D metabolite profile can easily be applied by other laboratories that use a fully validated LC-MS/MS method traceable to the existing reference system. However, there are also some limitations that merit consideration. As DESIRE and LURIC were not designed to assess bone health, important information, such as BMD and fracture data are missing. Furthermore, the individuals in both cohorts were White without any acute or chronic illness except coronary artery disease (LURIC). Therefore, the present results may not apply to other populations, such as Black or Asian populations, pregnant women, osteoporotic, and renal patients, or patients with severe inflammatory diseases. Also, this study showed the utility of a functional assessment of vitamin D metabolism for bone metabolism and all-cause mortality, but not for other disease entities that have been linked to vitamin D deficiency, such as malignancies, infectious disease, autoimmune disease, hypertension, or cardiovascular disease. Finally, the associations between a low vitamin D metabolite profile and BTMs were stronger in LURIC than in DESIRE, which is probably due to differences in health status between the 2 cohorts. LURIC participants were substantially older, had a higher disease burden, and significantly lower 25(OH)D concentrations. Together, these factors may have accentuated vitamin D-related effects on bone metabolism in this cohort. In addition, the lack of information on BMI in DESIRE impedes estimating the impact of differences in body composition on circulating vitamin D metabolites and BTM concentrations.
Conclusions
The present results provide evidence that a personalized assessment of patient vitamin D status offers superior diagnostic specificity. Patients with a low vitamin D metabolite profile are characterized by a substantially accelerated bone metabolism and increased all-cause mortality, regardless of their 25(OH)D concentration. On the other hand, in individuals with an unremarkable vitamin D metabolite profile, bone metabolism and all-cause mortality are similar to those who fulfil the currently recommended criterion for vitamin D sufficiency, even if 25(OH)D is low. Measuring 25(OH)D and 24,25(OH)2D by LC-MS/MS minimizes the inherent analytical issues of vitamin D immunoassays. Therefore, the functional assessment of vitamin D metabolism is a significant step forward towards personalized patient management. Future studies have to evaluate if a low vitamin D metabolite profile is also associated with BMD, fracture risk, and nonskeletal diseases. Therefore, more research is needed before a low vitamin D metabolite panel can be accepted as a superior indicator of functional vitamin D deficiency. Finally, establishment of functional vitamin D assessment in routine clinical practice would also require randomized controlled trials showing that individuals with a low vitamin D metabolite profile benefit from vitamin D supplementation.
Supplemental Material
Supplemental material is available at Clinical Chemistry online.
Nonstandard Abbreviations
25(OH)D, 25-hydroxyvitamin D; 24,25(OH)2D, 24,25-dihydroxyvitamin D; VMR, vitamin D metabolite ratio; DESIRE, Desireable Vitamin D Concentrations; LURIC, Ludwigshafen Risk and Cardiovascular Health; PTH, Parathyroid hormone; BMD, bone mineral density; BTM, bone turnover marker; CTX, C-terminal I; PINP, type I procollagen-N-terminal-peptide; LOQ, limit of quantification; IQR, interquartile range; HR, hazard ratio; BMI, body mass index.
Author Contributions
The corresponding author takes full responsibility that all authors on this publication have met the following required criteria of eligibility for authorship: (a) significant contributions to the conception and design, acquisition of data, or analysis and interpretation of data; (b) drafting or revising the article for intellectual content; (c) final approval of the published article; and (d) agreement to be accountable for all aspects of the article thus ensuring that questions related to the accuracy or integrity of any part of the article are appropriately investigated and resolved. Nobody who qualifies for authorship has been omitted from the list.
Markus Herrmann (Conceptualization, Resources, Supervision, Writing—original draft-Equal), Sieglinde Zelzer (Data curation, Formal analysis, Methodology, Validation, Writing—original draft), Etienne Cavalier (Conceptualization, Writing—review & editing), Marcus Kleber (Investigation, Software, Visualization, Writing—review & editing), Camilla Drexler-Helmberg (Data curation, Resources, Writing—review & editing), Peter Schlenke (Data curation, Resources, Writing—review & editing), Pero Curcic (Data curation, Investigation, Writing—review & editing), Martin H. Keppel (Software, Writing—review & editing), Dietmar Enko (Project administration, Writing—review & editing), Hubert Scharnagl (Investigation, Resources, Writing—review & editing), Stefan Pilz (Investigation, Project administration, Writing—review & editing), and Winfried März (Conceptualization, Project administration, Resources, Writing—review & editing)
Authors’ Disclosures or Potential Conflicts of Interest
No authors declared any potential conflicts of interest.
Role of Sponsor
No sponsor was declared.
References
Author notes
Sieglinde Zelzer Co-first author.
