


To the Editor:
Cardiovascular disease continues to be the leading cause of morbidity and mortality in much of the world and especially in the United States. Exposures to risk factors often begin in youth; therefore, accurate monitoring of lipid status is crucial during childhood (1, 2). The recent American Academy of Pediatrics/American Heart Association/National Heart, Lung and Blood Institute/National Lipid Association guidelines advocate for universal screening to target treatment for high-risk children identified by increased total cholesterol and LDL cholesterol (LDL-C; >170 mg/dL [4.40 mmol/L] and >110 mg/dL [2.85 mmol/L], respectively) (3). Accurate monitoring of LDL-C is crucial as its concentration is used in dose adjustments of statin therapies for pediatric patients (4). The Friedewald equation for calculating LDL-C has been widely adopted for clinical use since its introduction in 1972; however, it does not always provide an accurate estimation of LDL-C at low concentrations and in patients with high triglyceride (TG) concentrations (5). In 2020, using residual samples from patients tested at the NIH Clinical Center, Sampson et al. formulated a new equation for more accurate estimation (5). We aimed to compare the NIH equation with the Friedewald equation for LDL-C estimation in a retrospective analysis of a pediatric population.
Patient data were extracted from the Seattle Children’s Hospital lab information system, EPIC Beaker, as approved by the Seattle Children’s Hospital Institutional Review Board. A total of 14 355 lipid panel results from 8719 patients aged <1 month to 21 years (median age: 14 years) were included in this analysis. Data included measured values for TG, high-density lipoprotein cholesterol, and non–high-density lipoprotein cholesterol, between calendar years 2019 and 2021. The lipid panels were performed by colorimetric method on the Vitros® 4600 Chemistry System (Ortho Clinical Diagnostics). LDL-C concentrations were calculated by applying either the Friedewald equation or the NIH equation.
Out of the 14 355 lipid panels, 326 panels included TG concentrations between 400 and 800 mg/dL (4.52 and 9.04 mmol/L), representing 2.27% of the cohort; 106 panels included TG concentrations of >800 mg/dL (9.04 mmol/L), representing 0.75% of the cohort. Excluding those with TG concentrations >800 mg/dL (9.04 mmol/L), LDL-C was within the same reference range (i.e., low, normal, or high) for 95% of the samples when using the 2 equations (13 563 out of 14 249). The remaining 5% (n = 686) discordant results included 427 reclassified from low to normal, 50 reclassified from normal to low, and 209 reclassified from normal to high (Fig. 1, A), when applying the NIH equation. There was no reclassification observed from the high category. Of note, for the data sets with TG between 400 and 800 mg/dL (4.52 and 9.04 mmol/L), 44% (145 out of 326) resulted in a Friedewald LDL-C estimation of <70 mg/dL (1.81 mmol/L), which had been classified as low based on the population reference range. Upon reapplying the NIH equation, 41% (59 out of 145) were reclassified from low to normal. Overall, the equations produced highly correlated LDL-C values (slope = 0.97, R = 0.98). The Friedewald equation produced more results <70 mg/dL (1.81 mmol/L; 24.6%) compared to the NIH equation (21.65%) (Fig. 1, B). More results were <70 mg/dL (1.81 mmol/L) when calculated with the Friedewald equation than with the NIH equation (P < 0.001, 2 proportion z-test). A statistically significant difference was observed between the mean of all results calculated from the Friedewald equation and the NIH equation (92.78 mg/dL [2.40 mmol/L] vs 95.58 mg/dL [2.48 mmol/L], P < 0.001, Welch t-test).
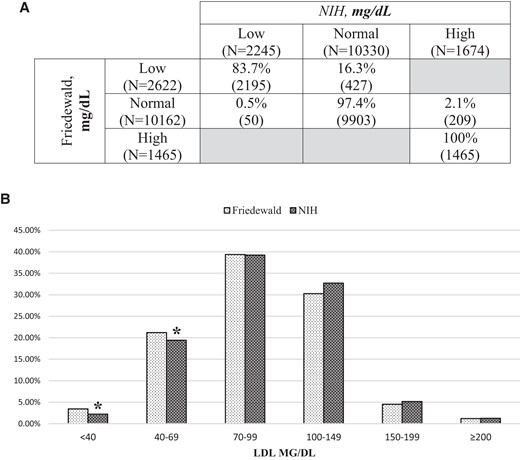
(A), Reclassification summary of LDL-C category among the targeted pediatric cohort upon implementation of the NIH equation; (B), Proportional comparison of estimated LDL-C categories (*P < 0.05, 2 proportion z-test). For conversion of cholesterol concentration in mg/dL to mmol/L, multiply by 0.0259.
In summary, several key observations were drawn: (a) A high degree of concordance was observed for LDL-C categorization using the NIH equation vs the Friedewald equation in this pediatric cohort; (b) the NIH equation resulted in an overall marginally higher estimation of LDL-C compared to the Friedewald equation; (c) by implementing the NIH equation, 5% of results were reclassified to either low or normal for hypdertyrglyceridemic patients (TG = 400–800 mg/dL, 4.52–9.04 mmol/L) (Fig. 1, A). Collectively, these observations suggest that the NIH equation compares well with the Friedewald equation for LDL-C estimations in a pediatric population, while producing a higher rate of reclassification in patients with increased triglycerides.
Author Contributions
All authors confirmed they have contributed to the intellectual content of this paper and have met the following 4 requirements: (a) significant contributions to the conception and design, acquisition of data, or analysis and interpretation of data; (b) drafting or revising the article for intellectual content; (c) final approval of the published article; and (d) agreement to be accountable for all aspects of the article thus ensuring that questions related to the accuracy or integrity of any part of the article are appropriately investigated and resolved.
Authors’ Disclosures or Potential Conflicts of Interest
No authors declared any financial disclosures or potential conflicts of interest.
Acknowledgment
We thank Dr. Andrew N. Hoofnagle for his expertise and assistance throughout this study.
