


Abstract
Modern artificial intelligence (AI) and machine learning (ML) methods are now capable of completing tasks with performance characteristics that are comparable to those of expert human operators. As a result, many areas throughout healthcare are incorporating these technologies, including in vitro diagnostics and, more broadly, laboratory medicine. However, there are limited literature reviews of the landscape, likely future, and challenges of the application of AI/ML in laboratory medicine.
In this review, we begin with a brief introduction to AI and its subfield of ML. The ensuing sections describe ML systems that are currently in clinical laboratory practice or are being proposed for such use in recent literature, ML systems that use laboratory data outside the clinical laboratory, challenges to the adoption of ML, and future opportunities for ML in laboratory medicine.
AI and ML have and will continue to influence the practice and scope of laboratory medicine dramatically. This has been made possible by advancements in modern computing and the widespread digitization of health information. These technologies are being rapidly developed and described, but in comparison, their implementation thus far has been modest. To spur the implementation of reliable and sophisticated ML-based technologies, we need to establish best practices further and improve our information system and communication infrastructure. The participation of the clinical laboratory community is essential to ensure that laboratory data are sufficiently available and incorporated conscientiously into robust, safe, and clinically effective ML-supported clinical diagnostics.
Introduction
In the past 10 evolution of artificial intelligence (AI) and machine learning (ML) technologies. AI-based systems are now capable of partially or fully automating well-defined tasks with performance metrics that are comparable to those of expert human operators. As a result, many areas throughout the healthcare industry are incorporating AI/ML-based technologies into amenable workflows. Laboratory medicine and in vitro diagnostics (IVD) are on the leading edge of this wave, as AI is increasingly implemented within business intelligence tools, instrumentation cleared by the Food and Drug Administration, and laboratory-developed tests. In addition, much of the data generated by the clinical laboratory is naturally suited for AI as these data are often structured, discrete, and high-fidelity and produced in large volumes. Accordingly, AI and clinical decision support systems (CDSSs) often rely heavily on laboratory data.
As the use of AI continues to increase, laboratorians will benefit from improved AI literacy and technological awareness so that we can become effective stewards of the technology and laboratory data alike. To this end, this review begins with a brief introduction to AI and ML and then proceeds to survey the breadth of ML approaches and relevant applications. Subsequent topics include an overview of AI/ML-based technologies currently implemented in the clinical laboratory or having demonstrated the potential for such use, AI-based systems outside the clinical laboratory and how they leverage laboratory data, barriers to the adoption of AI, and future directions of AI and laboratory medicine.
Machine Learning Overview
In 1950, Alan Turing authored a seminal paper in the philosophical journal Mind, wherein he proposed the question: “Can machines think?” (1). A short time later, McCarthy et al. assembled a group of computer scientists and mathematicians for a 2-month summer research workshop at Dartmouth College to collectively pursue the formative study of a new field termed “artificial intelligence” (2). AI encompasses a wide spectrum ranging from general AI, referring to the creation of intelligent thinking machines, to narrow AI, or computational algorithms, that can learn specific tasks. Early implementations of AI were primarily comprised of “if, then” rules used to automate protocol-driven processes. Such rule-based algorithms are used throughout clinical practice today and can be classified as nonadaptive AI (e.g., autoverification and antibiotic susceptibility reporting cascades). ML, which later emerged as a subdiscipline of AI, leverages techniques that are considered adaptive in that they can learn patterns from among data within a defined framework. The primary focus of this review is to consider contemporary IVD and laboratory management technologies that leverage ML techniques. While the boundaries between AI, ML, and even traditional statistics are fuzzy, in this discussion of ML, we broadly included algorithms in which the components and/or the relationships between those components were learned by a machine rather than either hard-coded by a human or derived using simple summary statistics.
The discipline of ML can be further subcategorized into supervised, semisupervised, and unsupervised ML. Most contemporary applications in the clinical laboratory use supervised ML, which will be the primary focus of this review. For the interested reader, further information on basic ML definitions and concepts can be found in recent literature (3, 4). Additional definitions of ML vernacular, referred to in this report, can be found in Table 1.
Definitions of common machine learning vernacular.
| Term | Definition | Example |
|---|---|---|
| Artificial intelligence (AI) | Referring to a broad set of technologies which are capable of automated decision making, or similarly intelligent behavior, via the analysis of data. Fundamentally, AI can be categorized as being either nonadaptive (e.g., rule-based) or adaptive (e.g., machine learning). | Nonadaptive AI: Autoverification of laboratory results |
| Adaptive AI: Automated classification of leukocytes from digital image of peripheral blood smear using a trained machine learning algorithm | ||
| Machine learning (ML) | A subdiscipline of AI which leverages mathematical functions to analyze input data and, without explicit instruction, provide inferences from the data. | See Fig. 1 |
| ML algorithm | A collection of mathematical functions that are used for a machine learning task. | See Fig. 1 |
| ML model | The resulting file, or artifact, created from training an ML algorithm. | Logistic regression: vectors of coefficients |
| Neural network: computational graph with associated matrix of weights. | ||
| Supervised ML | An approach to training ML algorithms in which the provided input data is associated with an outcome label. Commonly, the intent is for the model to learn how to map input data to the appropriate output data (label). | A model used to classify leukocytes may have initially been provided digital images of individual leukocytes with an associated label (e.g., lymphocyte, monocyte, etc.). Following algorithm training, the model could then be shown an image of a leukocyte without a label and infer a morphologic classification, within the scope of the original set of training labels. |
| Unsupervised ML | An approach to ML in which the ML algorithm analyzes input data without an associated label, to infer patterns, structure, or clusters within the data set. | Principal component analysis (i.e., dimensionality reduction) |
| T-Stochastic Neighbor Embedding (tSNE) | ||
| Semisupervised ML | An approach that uses a combination of supervised and unsupervised ML. This approach is commonly employed when there is a large amount of training data, with a limited amount of labeled data. | Photographs of person A, taken on a smartphone, may be initially collated into a separate “person A album.” This may be done initially without end-user input (unsupervised). The photo application may then prompt the user to provide explicit labeling (supervised) of photos the unsupervised algorithm was unsure of, to better classify pictures of person A. |
| Underfitting | A model that fails to learn the inherent structure of the data provided to it during training. | A model that demonstrates suboptimal performance on the training data set. |
| Overfitting | A model that learns the inherent structure of the training data set so well, that when it is confronted with new data, that was not well represented in the training data set, performance is consequently poor. | A model that demonstrates optimal performance on the training data set, but suboptimally on the test data set, may be suffering from overfitting. |
Representative examples of how machine learning applications are being applied in laboratory medicine using structured and unstructured data.
| Raw data | Label | ML algorithm | Clinical purpose |
|---|---|---|---|
| Structured data | |||
| Basic demographic and clinical information, and CBC/differential results | PBFC results classified as negative or positive | DT or GLM | Predict PBFC results as negative or positive, proposed as an approach to triage PBFC utilization |
| Urine steroid metabolites quantified by GCMS and demographic data | Normal or abnormal; if abnormal, then classify by disease category. | RF, WSRF, or XGBT | Map data to comment templates to generate semi- or fully automated interpretive comments |
| Unstructured data | |||
| Bounding-box coordinates and cropped images of individual intestinal protozoa, yeast, and PBCs | Species-level classification (e.g., Giardia duodenalis cyst, Blastocystis sp., etc.) | Deep CNN | Detection and classification of potential intestinal protozoa, yeast, or PBCs. Classifications reviewed by user prior to result verification. |
| Images of leukocytes from Romanowsky stained peripheral blood smears | Leukocyte differential; 17-cell types | ANN | Automatically classify leukocytes, subject to expert human operator review prior to result release |
Abbreviations: ANN = artificial neural network; AANN = auto-associative neural network; DT = decision tree; GLM = generalized linear model; PBC = peripheral blood cell; PBFC = peripheral blood flow cytometry; RF = random forest; WSRF = weighted-subspace random forest; XGBT = extreme gradient boosted tree.
![Infographic of supervised machine learning using generalizable examples of structured and unstructured input data. (A) Structured data: predicting a dichotomous variable (i.e., “sepsis” vs. “no sepsis”), using a collection of annotated analytes (analyte-A, analyte-B, . . . , analyte-E). The structured data can be analyzed by a machine learning algorithm, such as those denoted above the red line. The output of the machine learning algorithm would include a predicted probability for each possible class. The top-predicted class could then be compared to the original input label to assess model performance. (B) Unstructured data: predicting a categorical variable (i.e., erythrocyte morphology), using a 70 × 70 × 3 [height × width × 3-color channel (red/blue/green)] image of an erythrocyte. Images are unstructured matrices of numbers that typically range from either 0 to 1 or 0 to 255. These data can be analyzed by a machine learning algorithm, such as those denoted below the red line. The output of the machine learning algorithm would include a predicted probability for each class, which would collectively sum to 1. The top-predicted class could then be compared to the original input label to assess model performance.](https://oup.silverchair-cdn.com/oup/backfile/Content_public/Journal/clinchem/67/11/10.1093_clinchem_hvab165/1/m_hvab165f1.jpeg?Expires=1750188014&Signature=iwmk~42rQ41w7ojuMdpt6n~iixzdwIT71yRVPYnp378wZAS6HfvDhB4gWAvzB~mbtQjWAieKJCr8xq9psMCjekk2XaB5tVVPkBlJ33SNfqINgYdlP-A9cdabNnA2xG~LMGg7ECjuTSturpAPd7haZ2gBJlrD4cZ-XkSlbaAt1E92nZAbPab0CEEt4WTYokbhcdRxicEOJPilQ-9x8CCWZ9uYFtC~k~GWFL-uZ6BaqISi24mKPxa2ZzryzI5FFhaO46jSirXEveDY9~HrAGGYa53N9SSkUJJL~qh5aIwQM~Q7LwFgRwF5UhYSzqO3-Q1DGHh1BOOerL7bfiE7k5KlSQ__&Key-Pair-Id=APKAIE5G5CRDK6RD3PGA)
Infographic of supervised machine learning using generalizable examples of structured and unstructured input data. (A) Structured data: predicting a dichotomous variable (i.e., “sepsis” vs. “no sepsis”), using a collection of annotated analytes (analyte-A, analyte-B, . . . , analyte-E). The structured data can be analyzed by a machine learning algorithm, such as those denoted above the red line. The output of the machine learning algorithm would include a predicted probability for each possible class. The top-predicted class could then be compared to the original input label to assess model performance. (B) Unstructured data: predicting a categorical variable (i.e., erythrocyte morphology), using a 70 × 70 × 3 [height × width × 3-color channel (red/blue/green)] image of an erythrocyte. Images are unstructured matrices of numbers that typically range from either 0 to 1 or 0 to 255. These data can be analyzed by a machine learning algorithm, such as those denoted below the red line. The output of the machine learning algorithm would include a predicted probability for each class, which would collectively sum to 1. The top-predicted class could then be compared to the original input label to assess model performance.
Supervision is synonymous with the use of training labels (i.e., annotations) ascribed to each of the samples within a data set. These labels are frequently assigned a priori by a human subject matter expert. The labels serve as the ground truth during the learning process. The machinery that is used for rote learning of informative patterns involves a multitude of mathematical approaches (e.g., neural networks, support vector machines, and regression algorithms) and reviews of these techniques are abundant in the literature. Importantly, most of these algorithms use an error function to monitor and direct iterative refinements to the patterns that are identified from the data. The optimization of such an error (or loss) function is arguably the raison d’être of ML.
In supervised ML, a data set is comprised of 2 components: (i) raw data (input features) and (ii) labels (training outcome). Raw data are commonly categorized as either structured or unstructured. Structured data can be intuitively visualized as a data set of fields and values, such as a data table with column headers and rows that are described by a data model. Conversely, unstructured data such as digital images have more complex encodings and require more manipulation. Training labels can take many forms, including continuous variables (e.g., concentrations for a calibration curve), dichotomous variables (e.g., benign or malignant), or categorical variables (e.g., artifact, benign, premalignant, or malignant). Taken together, raw data and labels are used to train an ML model, which can then be applied to partially or completely automate a laboratory process (Fig. 1; Table 1). Over the last 2 decades, ML has been applied to an ever-expanding set of use cases. In the following section, we will review salient examples of ML applications in the clinical laboratory, including those in clinical practice or described in the emerging literature.
Applications of Machine Learning in Laboratory Medicine
While we are currently in a resurgence of the application of AI to healthcare, ML is ubiquitous in laboratory medicine and can be easily overlooked. The most common application of ML in the laboratory is the conversion of raw measurement signals into analyte concentrations, typically achieved by constructing calibration curves that model signal-to-concentration relationships using linear regression (5). ML also assists with data interpretation as it can distill multivariate data into a more intuitive form. A representative and widely adopted example of this is prenatal open neural tube and aneuploidy screening, wherein the predicted disease risk is generally estimated using a combination of regression and related discriminant analyses of protein biomarkers (6, 7). A calculated disease risk based on a set of laboratory results is a natural extension beyond simply reporting the individual results of many individual assays. Indeed, the current resurgence of ML has begun to reveal the much broader potential for this historically accepted but underutilized practice, now leveraging larger data sets with more variables and patients and more sophisticated methods.
Clinical Chemistry and Immunology
Chemistry and Immunology laboratories are particularly well suited for leveraging ML because they generate large and highly structured data that can be input into computational methods. These tools can help to translate raw data (e.g., spectra, profiles) into discrete results, review data for autoverification, and suggest clinical interpretations of multivariate results.
For the interpretation and quality control of electrophoresis traces and mass spectra, laboratories generally rely on labor-intensive procedures. Accordingly, there is growing interest in tools that can automate these processes to improve throughput and quality (8, 9). Electrophoresis of serum proteins is a long-standing and widely used diagnostic modality for screening and monitoring of monoclonal gammopathy-related disease (10, 11). However, result interpretation or verification generally involves labor-intensive review performed by highly trained individuals, which makes scaling this approach to other use cases time- and cost-prohibitive (12). To this end, there are several published reports that describe various approaches to automating gel or capillary electrophoresis pattern interpretation, mostly using artificial neural networks (12–15). While these techniques currently demonstrate suboptimal specificity and are not yet widely adopted in clinical practice, integrating them within commercially available electrophoresis platforms as interpretation support tools would likely dramatically improve the efficiency and consistency of these evaluations.
For the analysis of mass spectra, ML approaches can support the translation of spectra into concentrations and quality review by enabling or increasing autoverification. Commercial products have recently become available for automated peak quantitation and quality analysis that have been shown to improve workflows (16, 17). ASCENT (Indigo BioAutomation) uses an exponentially modified Gaussian model to estimate peak areas and has shown good performance even in the setting of low-concentration analytes and modest signal-to-noise ratios (17). ML approaches have also been proposed for the automated and more sensitive quality review of spectrometry data and discrete results of general chemistries (8, 9).
Downstream of result generation, ML-based decision support tools show considerable promise in assisting pathologists’ interpretation of complex multianalyte data. At the most basic level, ML approaches can help to jointly interpret discrete laboratory results with concrete relationships, like thyroid-stimulating hormone and free thyroxine (18). Extending further, ML can support and potentially improve upon manual interpretation for larger multianalyte panels such as steroid and amino acid profiles (12, 19–21).
Clinical chemistry laboratories also generate digital images (i.e., unstructured data), which given the recent advancements in computer vision, are highly conducive to semiautomated analysis. Urine sediment analysis is a labor-intensive process in which sedimentary particles are identified and quantitated by a skilled medical laboratory scientist. With ML, this analysis can be automated using one of the many highly performant image classification techniques that are currently available. Currently, there are many commercial products that offer digital imaging and subsequent classification of urine sedimentary particles, which can be presented to the end-user for review and verification (22–26). However, as these tools are young, manual review of pathological samples is still generally recommended (26). In immunology, ML-based image analysis is commonly combined with immunofluorescent assays for the detection and classification of antineutrophil cytoplasmic antibodies (27, 28). While there are currently only a few instances of digital imaging in the clinical chemistry laboratory, there are many potential opportunities (e.g., sample tube imaging on automated preprocessing units) for which automated analysis by ML tools will likely be essential.
There are also many emerging laboratory testing approaches for which sophisticated and rapid computational tools are foundational. For instance, there is considerable interest in bringing mass spectrometry into the operating room for real-time biochemical profiling of surgical tissue samples (29, 30). In recent proof-of-concept applications, tissue-based samples (e.g., gas-phase ionic species or water droplet) are collected by a handheld surgical device and input to a mass spectrometer via a tube conduit. The resulting mass spectra are then analyzed in real time to enable rapid, in situ biochemical profiling. While this emerging IVD technology remains in the development stages, current approaches incorporate ML methods to distinguish between benign and malignant tissue spectra. Recent publications have described this approach for the identification of malignancies of various tissue types, including ovarian, thyroid, and lung (29, 31).
Hematopathology
While ML has seen many forms of progress in recent years, one of the primordial advances, with respect to the current ML resurgence, was in the context of digital image analysis (32). In 2012, Krizhevsky et al. successfully integrated convolutional neural networks within a deep neural network, which resulted in a significant improvement in automated image classification performance relative to the state-of-the-art predicate method (32, 33). Subsequently, the computer vision field saw widespread adoption and expansion of this approach, which has led to highly performant image classification algorithms (34). Not surprisingly, there has been substantial interest in the adoption of image classification technologies in medical specialties such as radiology and anatomic pathology, where the collection of digital images continues to accelerate (35–37). Laboratory medicine will similarly be image-rich, particularly in the context of hematopathology.
Hematopathology as a specialty puts significant consideration on the visual interpretation of patterns, such as the morphologic characterization of cells (38, 39). Accordingly, there is a long history of researchers and manufacturers combining digital imaging and computer vision technologies to automate some facets of the hematopathology workflow with efforts dating back as far as the 1970s. For example, Bacus et al. used digital imaging and feature engineering to model erythrocyte morphology classification based on cellular features (e.g., size and spicularity) (40). Since this time, there have been successful reports of automated classification of peripheral blood cells using a variety of modern ML technologies. Core lab commercial applications have been available since the early 2000s and, more recently, an increasing number of point-of-care devices (38, 39, 41–44).
One widely adopted, Food and Drug Administration (FDA)-cleared image analysis system enabled by ML is the Cellavision DM96 (45). The Cellavision system uses a static (i.e., locked weights) artificial neural network–based approach to precharacterize leukocytes and erythrocytes for an automated differential count and morphologic analysis, respectively. Like other image classification systems in the laboratory, substantial equivalence for this analyzer was established in the setting where a certified laboratory technologist was required to verify or modify suggested classifications for each cell prior to result release (45). Despite the need for expert review, there are numerous reports that detail high classification accuracy and good correlation with manual differential counts (46, 47). More recently, there are emerging applications that do not require expert operator review, particularly for point-of-care testing. Some examples include the HemoScreenTM (PixCell Medical) and the Sight OLO® (Sight Diagnostics), both of which offer a 5-part cell differential using ML-based image analysis but without the requirement for expert operator review (48).
Malaria diagnosis by digital imaging of peripheral blood has received significant attention from international research communities (49). A recent review by Poostchi et al. offers a thorough overview of this topic and nicely organizes the considerable heterogeneity across published studies (49). These tests face particularly daunting challenges, such as conducting multiplanar focusing, handling noisy interfering objects (e.g., parasite-like inclusions), and enumerating objects of interest at high magnification from a digital microscopic image in the setting of overlapping cells (50). Recent reports are now pursuing approaches that use deep learning that may be able to overcome some of these difficulties (50–52). However, general performance remains suboptimal, and it is likely that more progress will be needed before we see widespread clinical implementation of these tools (49).
Beyond digital image analysis, other areas of ML-based laboratory support have been described in hematopathology. Optimizing test utilization is an area of rising interest, particularly in the context of emerging value-based reimbursement models and stewardship strategies for labor-intensive test methods. To this end, there are many publications that investigate the use of routine hematologic data to predict the likelihood of more complex test result abnormalities to guide ordering practices. As an example, Turbett et al. described a statistically driven method of triaging testing for anaplasmosis using complete blood count measurements (53). While their approach did not formally leverage an ML framework, this workflow is amenable to ML modeling and has been described elsewhere in published conference proceedings (54). Similarly, Zhang et al. investigated the use of decision trees and regression models to identify peripheral blood flow cytometry specimens, which were more likely to be abnormal. Using this approach, a generalized linear model achieved 100% sensitivity and 54% specificity (area under the curve = 0.919) (55).
Lastly, multiparameter flow cytometry is a partially structured, high-dimensional data set, which by those 2 criteria is inherently well suited as an input for ML modeling. Consequently, it has received increasing attention in ML-based literature over recent years (56–58). Recently, Gaidano et al. describe a decision tree model to classify B-cell non-Hodgkin lymphoma with an overall accuracy of 92.68% (59). Similarly, Ng et al. demonstrated the use of a random forest classifier that could be used to screen out negative cases with 100% sensitivity (60). Conference proceedings have described the use of neural network–based approaches to decision support tools for multiparameter flow cytometry interpretation (61, 62). Unsupervised clustering and dimensionality reduction techniques are increasingly applied to flow cytometry data, addressing some of the potential ambiguity of manual gating, which impacts numerical data, and is of particular relevance to investigative projects (63). However, to date, these approaches have had limited impact on clinical practice where multidimensional data are generally interpreted by inspection of bivariate plots. Dimensionality reduction can be combined with ML classifiers, which may be collectively leveraged to assist in diagnostic interpretation (64). A persistent challenge is that clinical use often relies on recognition of subtle change to variable expression patterns, as well as understanding nuances of the specific instrumentation and reagents being used which are aspects not readily characterized by automated clustering methods. While there is great potential for leveraging ML-based technologies to analyze multiparameter flow cytometry data, efficient and clinically focused applications that incorporate ML remain limited at this time.
Clinical Microbiology
Clinical microbiology is historically a manually intensive section of the clinical laboratory. In recent years, however, there has been increasing interest in employing automated workflows to improve efficiency and help to mitigate the ongoing nationwide shortage of medical laboratory scientists (65–67). With this shift in practice, there are opportunities for the integration of ML-based tools in these new workflows.
Bacteriology cultures
Total laboratory automation systems that enable culture-based microbiology testing are generally comprised of three main components: an inoculation unit, an incubation system, and a high-resolution imaging system. Digital plate imaging offers many advantages by creating a retrievable record of bacterial growth, allowing remote plate reading, and enhancing visual inspection using various lighting conditions (68). In addition, opportunities to employ ML to aid in analyzing these complex images, which have traditionally been interpreted manually, are also emerging. A convergence of maturing technologies including back-end automation of bacteriology cultures (digital imaging of petri plates using Kiestra or WaspLAB), affordable storage of large digital image files, and affordable computational power are creating these opportunities. Computer algorithms are currently being developed and employed as decision support tools for bacteriology culture interpretation (69–71). It is reasonable and feasible for software to interpret at least some Petri plate image results, such as “no growth” bacterial cultures, and to autoverify these interpretations without human intervention, although this is not yet practiced in laboratory medicine.
In addition to automated interpretation of traditional growth media, more advanced interpretations of bacterial cultures are likely to be the next step in development and clinical implementation. The Accelerate Pheno® (Accelerated Diagnostics) is a recently FDA-cleared IVD device that uses digital dark-field microscopy images of single-cell bacterial cell growth in the presence of varying concentrations of antimicrobial agents to determine minimum inhibitory concentrations (MIC) and susceptibility interpretations. This device relies on a hierarchical system that combines multivariate logarithmic regression and computer vision (72). Using this approach, the Accelerate Pheno® system can provide rapid (e.g., hours) phenotypic MICs using direct samples from positive blood culture bottles. While further research is needed to evaluate its impact on patient care, it remains a timely example of ML-based tools being used in concert with unique, culture-based technology.
Microscopic analysis of primary specimens
Beginning with Leeuwenhoek, microbiology’s cornerstone has been the visual examination of primary samples. In clinical microbiology, these analyses include microscopic evaluation for bacteria (e.g., Gram stain), fungi, acid-fast bacilli including mycobacteria, ova and parasite exam, and blood parasites (e.g., apicomplexa). These microscopic analyses are used for screening or to achieve a definitive clinical diagnosis. Inherent strengths of ML tools align well with many image analysis use cases in clinical microbiology. These use cases include rare-event detection (e.g., acid-fast bacilli) and segmentation/classification (e.g., Nugent-scored Gram stain). ML tools have demonstrated utility in early studies for these applications: Nugent score Gram stain interpretation for bacterial vaginosis diagnosis (73), classification of bacteria in positive blood cultures (74), mycobacteria detection in sputa (75–77), ova and parasite detection and classification from stool samples (78), and blood parasite detection and quantification (79–81).
In clinical microbiology practice, classification algorithms can be tuned based on the desired role in clinical practice. Generally, rare event detection algorithms (e.g., acid-fast bacilli detection) are most useful when weighted toward high sensitivity at the expense of specificity, wherein the machine can screen an image for suspect events and a human expert can make the final decision as to whether the rare event is artifact or microbe. Similarly, high-sensitivity algorithms could be used to screen and autoverify no-growth urine cultures by analyzing nutrient agar Petri dishes. The utility of these tools is to improve the efficiency of the time employed by the expert medical laboratory scientist reviewing the specimen and to potentially improve the sensitivity or reproducibility of the test (78, 82).
A recent and representative example of high-sensitivity algorithms was recently examined in the context of enteric parasite diagnostics. Mathison et al. described their clinical validation of convolutional neural network–based software, developed as a decision support tool to detect and classify intestinal protozoa found within digital images of trichrome-stained fecal specimens (78). The method presented in this report achieved high concordance with manual microscopic review and demonstrated superior sensitivity relative to the predicate method, as shown with serial dilution experiments. Similarly, Smith et al. described the application of convolutional neural networks to the interpretation of blood culture Gram stains, demonstrating sensitivity above 90% for Gram-positive cocci in clusters and chains and Gram-negative rods (74). These works demonstrate that ML-based technologies can achieve high-performance metrics and, in conjunction with expert review, can be helpful in a clinical microbiology setting. As digital imaging of microscopic analysis expands in microbiology, we are likely to see more applications such as these (5, 82–84).
Interpretation of microbial sequencing data and PCR
Next-generation sequencing (NGS) and real-time PCR interpretation can both benefit from computer-aided interpretation. Algorithms can be used in place of cycle thresholds for quantifying the initial target of a PCR assay (85). Whole-genome sequencing data may one day be used in place of phenotypic test results for predicting clinical efficacy of antibiotics (86), and early work has demonstrated that machines can predict antimicrobial resistance and susceptibility in certain instances (87–90). Relying on ML algorithms to interpret real-time PCR and to predict phenotypes or taxonomic identities using trained software instead of mechanistic decision trees could change how clinical microbiology is practiced. Nontargeted sequencing techniques, such as shotgun metagenomics, may rely on these techniques and offer important potential to enhance pathogen discovery, strain typing, and resistance prediction from clinical samples (91).
Molecular Diagnostics
The development of high-throughput and high-multiplexity nucleic acid technologies has transformed the field of molecular diagnostics. These methods have been enabled in part by advances in ML. For example, at their core, many NGS methods analyze thousands of images of millions of microscopic clusters of labeled nucleic acids (92). These tools generate massive amounts of data, necessitating robust pipelines for big data management that would be impossible for humans to interpret alone (93, 94). In addition, massive multiplexity requires sophisticated approaches to identify analytically valid results and interpretations amidst the sea of data (93). As previously discussed, ML is well suited for assisting in the analysis of large, well-structured data. Over the last decade, publications involving genomics and ML abound (94).
Modern NGS assays generate high-dimensional, structured data sets that can provide highly useful diagnostic and prognostic insights. However, given the size and complexity of these data sets, analysis of NGS data sets is labor-intensive and time-consuming. Accordingly, many software products use ML to streamline various aspects of the NGS data analysis pipeline. Like other areas of ML application, this technology can be used to make human interpretations more efficient or to provide new diagnostic capacity. These platforms can assist with variant calls, curation, and clinical interpretations (95, 96). These approaches may provide particular benefit in the annotation of variants of uncertain significance identified in the clinical setting. Early methods that relied on similarity of sequence or structure often had limited performance to predict clinical impact (97, 98), but newer methods are being developed to provide interpretations from functional analysis (99) to clinical impact (100). ML techniques have also been used to generate more complex interpretive results from broad genomic assays (e.g., generating polygenic risk scores for complex diseases), which are now available via both clinician-ordered and direct-to-consumer pathways (95, 101–103).
While molecular diagnostics in laboratory medicine predominantly interrogate nucleic acid sequences and the concentration of specific molecules, similar methods can be applied to other kinds of biological variation. These -omics–oriented tests can encompass studies including epigenomics, transcriptomics, proteomics, metabolomics, and microbiomics (104). These tests often include an ML component in the processing or analysis of the raw data being generated, often at a large scale. However, as a new clinical diagnostic area, the ability to combine multiple sets of -omics data (i.e., multiomics) and integrate high-fidelity phenotypic data represents a challenging yet promising, data-driven direction for molecular diagnostics. Much research is aimed at identifying clinically useful biomarkers using 1 or more testing modality (105–107). With the cost of these assays rapidly decreasing, our ability to identify meaningful information from such complex data is ever-improving. While the breadth of multiomic diagnostic testing strategies is beyond the scope of this review, they collectively represent the rapidly growing next frontier for ML and laboratory medicine (108).
General Laboratory Medicine Practice
The total testing process is a commonly referenced framework used for evaluating laboratory testing from quality assurance and quality control standpoints. Errors in the preanalytical phase of testing are thought to account for the highest frequency of laboratory errors but are challenging to prevent as many of the relevant processes are often beyond laboratory oversight (109). To this end, there are several recent publications that investigate the utility of ML techniques for identifying preanalytical errors. Recent and representative examples include the use of optical character recognition to identify mislabeled samples (110), the detection of spuriously increased glucose results due to intravenous fluid contamination(111), and logistic regression and support vector machines to detect “wrong blood in tube” errors (112). Both approaches demonstrated how a combination of commonly available laboratory results can be utilized for preanalytical quality assurance purposes. While such approaches are not yet widely adopted, they are representative of potentially value-added components, which may be integrated with commercially available laboratory information systems or middleware.
Regarding the analytic phase, intermittent testing of quality control material is the gold standard for evaluating analytic methods for instability (113). Moving averages are an alternative approach for identifying method drifts or shifts whereby the mean of consecutive patients’ results are compared to control limits established for a specific patient population (114). This approach could identify problems in between the testing of external quality control samples, which can be as infrequent as daily. However, choosing the parameters of a moving averages protocol to maximize sensitivity and minimize false alarms is challenging. To this end, Ng et al. described an ML-based approach to detect systematic error among patient results using a simulated annealing model to optimize moving average protocols (e.g., control and truncation limits) and were able to implement these protocols in their production environment (115). Similarly, as part of quality assurance in the analytic phase, result verification processes aim to identify test errors prior to result release, which is commonly implemented using a rule-based system (i.e., nonadaptive AI) to accept or reject results. Demirci et al. recently described an adaptive, ML-based approach using artificial neural networks to develop a model that could be used for autoverification purposes. The model was found to be 91% sensitive and 100% specific as compared to result verification decisions by 7 clinical chemists (116).
Bordering between analytical and postanalytical, abnormal result flagging remains a critical aspect of laboratory services and a major driver of clinical decision-making (117, 118). Determination of clinically meaningful reference intervals is challenging, particularly when considering subpopulations of community testing cohorts (e.g., sex- or age-specific reference intervals) and poorly standardized assays. Several methods have been developed to leverage in-practice clinical data for defining or refining reference intervals (119–121). Poole et al. describe an unsupervised ML approach to identifying clinical diagnoses associated with extreme results and then excluding patients with these diagnoses from reference interval calculation, as typically seen with the a posteriori approach (121). Such approaches show great potential for ensuring reference intervals used are most appropriate for local patient populations. Indeed, as laboratory software continues to expand in functionality, these examples demonstrate the potential of leveraging data generated as part of routine clinical practice to improve that clinical practice by using ML methods. One final example of ML applications in general laboratory practice is resource stewardship, including blood banking and transfusion, wherein predictive analytics can guide the prospective utilization of blood products (122).
Laboratory Data and Machine Learning Outside of the Laboratory
Laboratory data are a critical component of the diagnostic process. From chronic disease to acute infection, almost all clinical decision-making will leverage the results of a laboratory test to guide the diagnosis, treatment, or prediction of the outcome of disease. Within the clinical laboratory, basic mathematical calculations, rule-based engines, and ML-based tools are all routinely used. But additional applications of these data exist in tools developed external to the clinical laboratory, spanning from real-time clinical predictive models to health system business intelligence.
The interest in leveraging ML to drive electronic health record (EHR)-based tools, such as CDSSs, is an area of increasing interest (123). CDSSs create the links between data, algorithm, and end-user to be able to deliver information at the point of care and allow for changes in clinical decision-making. Like other applications of AI and ML, CDSSs can range from rule-based triggers through black-box ML. The goal of these systems is to provide the user with suggested clinical pathways or interventions based on the existing, high-dimensional data within the clinical record. Clinical laboratory data are often a key component of clinical predictive models and CDSSs, as these data are often structured and are typically available as soon as a test result is verified, unlike manually entered data, such as flow sheet and clinical notes, which may not be finalized until the end of a provider’s shift. The goals of applying more advanced ML-based approaches to CDSS include the reduction of alert fatigue by providing more appropriate alerts at more precise times, by leveraging and distilling more EHR data as compared to manually developed rule-based approaches. Such models have been commonly implemented to identify and provide treatment guidance, including for detecting acute kidney injury (124–126) and oncology treatment recommendation (127), as well as to predict clinical outcomes, including acute deterioration (128, 129) and postoperative outcomes (130, 131).
Within the laboratory, calculations and predictive models, regardless of how basic they are, are regulated by the Centers for Medicare and Medicaid Services via accreditation by deemed organizations such as the College of American Pathologists. For example, the College of American Pathologists provides validation and documentation requirements for calculations of the international normalized ratio and estimated glomerular filtration rate, as well as for the validation of autoverification rules. Outside of the laboratory, the regulation of AI and CDSS is less clear and is an area of active discussion and evolving guidance from the FDA (132–135). While laboratory data provide a rich, structured data set to drive these algorithms, active integration of laboratorians in the development, implementation, and management of these tools is critical as common laboratory decisions, such as the deployment of a new assay or changing a reference interval, could have unintended consequences on both rule-based and AI-driven CDSSs. In addition to the data and algorithmic validity of these approaches, it is also crucial to assess the impact of such tools on the relevant clinical outcomes. Even in situations when experts would expect an ML-triggered intervention would be likely to improve clinical outcomes and very unlikely to cause harm, recent studies have found that this may not always be the case (136).
Key Barriers
While the potential for the application of ML in laboratory medicine is massive, the progress to date has been modest. This gap is due to a combination of many factors, including the complexity of pathophysiology, risks of automation, limited access to data and tools, and inadequate data quality.
The complexity of pathophysiology
A fundamental challenge is that medicine is complicated. Laboratory tests provide snapshots of bits of descriptive information. However, there are many ways in which normal physiology can be disrupted, and within each pathology, there is considerable between-patient variability. Whether ML models can be built with sufficient sophistication to achieve the desired clinical performance for complex problems, such as screening for asymptomatic disease, remains an open question. Additional testing comes at higher costs and runs the risk of false-positive findings and overmedicalization. Thus, when considering whether to implement ML for a particular clinical use case, we need to understand the full implementation context and evaluate ML approaches as we would any other clinical practice or laboratory test by performing analytical validations and verifying or establishing clinical effectiveness (137).
Risks of implementing ML in practice
The decision to implement a new process in clinical practice requires a comprehensive assessment of risks and benefits. There is considerable uncertainty and potential risk in adopting any innovative technology, including ML for clinical care. Because of the novelty of some ML approaches, the guidelines and regulations for developing, assessing, and monitoring ML tools are under active development. This lack of best practices has allowed premature or poor applications of ML in clinical practice and contributed to the overall slow implementation of useful tools (136, 138, 139).
One way of mitigating the risks of implementing ML is for models to make recommendations to laboratorians or providers rather than automatically determining clinical actions. A step in this direction that can mitigate risk while enabling more automation is to use ML models that are interpretable whenever possible. Interpretability is an enigmatic and heterogeneously defined concept. As specified in the FDA’s draft guidance for clinical decision support (September 2019), one formulation is whether the end-user can “independently review the basis for [a model’s] recommendations.” An example of this concept is that for imaging models, it is easier to validate models, verify individual results, and monitor performance of a model that can highlight specific fields of relevance to the model’s prediction, such as red blood cells suspicious for a parasite (Fig. 2). Such a model is not fully interpretable because we cannot understand the model’s thinking, but it is considerably more interpretable than a completely black-box model. Ideally, if the model’s user can understand precisely why an ML model is calling a cell, or patient, positive or negative, they can develop trust in the model and, when appropriate, second-guess a model’s prediction.
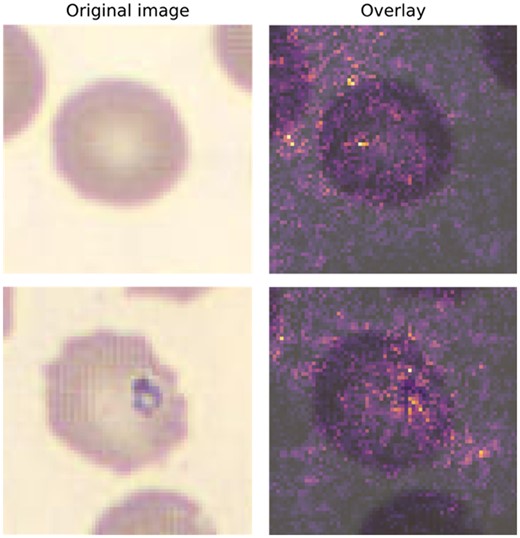
Visual example of explainable AI using integrated gradients (IG). Original peripheral blood smear was created and imaged on a DI-60 Integrated Slide Processing System (Cellavision AB) using a 100×-objective and a 0.5× magnifier for an effective magnification of 50×. Images are 70 × 70 (height × width) with 3-channel RGB, and a resolution of 5 pixels per micron. The top row represents a normal cell, which was classified by an ML model as normal (i.e., true negative). The bottom row represents an erythrocyte with a Babesia spp inclusion and was classified by a ML model as a parasite (i.e., true positive). The IG method highlights pixels in each image that appeared to most heavily influence the model prediction. Highlighted pixels are then pseudocolored using an intensity scale (e.g., greater influence on class prediction = brighter) and subsequently overlaid on the original image (right-most column).
Upcoming regulatory framework
AI- and ML-based software that can continuously learn presents a novel challenge for existing premarket approval pathways by the FDA. While the FDA has cleared AI/ML-based software in the past, until recently, these applications have only leveraged algorithms that are locked and are not continuously updating via analysis of newly acquired data (133). Due to the locked nature of these models, the output, or answer, will be the same for a given set of input data throughout the life span of the product. Accordingly, novel regulatory frameworks are needed for algorithms designed to continuously analyze new data, learn, and behave adaptively. To this end, in recent years, the FDA has incrementally progressed toward the development of a formal regulatory framework for the approval and oversight of AI/ML-based software (i.e., Software as a Medical Device), with particular focus on how to manage their adaptive nature. Principal components of this newly proposed framework include predetermined change control plans, which specify “what” aspects of the algorithm will change and “how” the manufacturer will effectuate that change. In addition, the FDA will seek to ensure good ML practices are used in product development and oversight of ML algorithms, promote transparency regarding device function, minimize algorithm bias and optimize robustness, and monitor real-world performance. Similarly, the FDA has also issued draft guidance on the separate but related topic of CDSSs, which, in some instances, may also be classified as Software as a Medical Device (140).
As medical devices leveraging AI/ML continue to proliferate in the clinical laboratory and EHR, understanding pre- and postmarket approval pathways will be essential. It remains unclear whether the initial validation and ongoing monitoring of ML algorithms would be the responsibility of the vendor, end-user, or a combination thereof. Concepts outlined in draft regulatory guidance, regarding good ML practice and methods for algorithm validation, are generally analogous to good laboratory medicine practice. Validation and monitoring of algorithms will reduce the risk of bias, overfitting, and performance degradation over time and, much like a laboratory test, can limit the impact of such issues on patient care and outcomes (4, 134, 141). Furthering ML education in laboratory medicine will likely assist laboratory professionals in understanding the fundamental purpose of why AI/ML technologies require close monitoring, thereby improving the adoption and implementation of these practices. Lastly, validation and monitoring ML algorithms will likely come with difficulties in collating the necessary data and presenting it to end-users for efficient review.
Limited access to data and tools
Training models to grasp medical complexity requires a lot of data. The magnitude of information needed often necessitates learning from data collected as part of clinical practice. Unfortunately, these data exist in silos, and there are many obstacles to aggregating said data.
Clinical data are siloed in part because of concern for patient privacy and ambiguity regarding who owns patients’ data. The use of patient data for research requires explicit consent or a waiver of consent because of the risk of reidentification and unauthorized access to sensitive data (142, 143). While the potential long-term benefits to the practice of medicine are substantial, the concern for the individual has been held as paramount. Movements toward more broadly consenting patients for research are now empowering patients to decide whether to share their data and contribute to these efforts (144).
The usefulness of patients’ data has also made such data a valuable commodity that health systems have been reticent to share. However, this has been changing rapidly as health systems and patient groups are making data available in federated research networks (145–147), contributing to health information exchanges (148), publishing deidentified data sets for proof-of-concept research (149), and sharing data with interested companies. In addition, within clinical practice, EHR applications have begun enabling sharing of data between different health systems.
A related challenge to data access and aggregation is limited interoperability, which refers to the inconsistency of the processes and practices for transmitting data between devices and software applications (150, 151). There are specifications for how to transmit laboratory data between devices, such as an instrument and the laboratory information system (152). However, the specifications that are in common use are so broad that enormous effort is needed to program each interface, and substantial amounts of information can be lost between the instrument and the EHR. As a result, aggregating data across clinical practices requires enormous harmonization efforts. To harmonize data, each aggregation effort invests inordinate time in the formulation of and mapping to a common data model with standard vocabularies (153). However, to our knowledge, none of these aggregation efforts contain the metadata needed to sufficiently interpret and harmonize laboratory test results, likely due to the complexity of the data, poor access to the pertinent metadata, and limited participation from and engagement with clinical laboratory experts.
Improvement to the interoperability of laboratory data is possible as there are new and evolving specifications. The Fast Healthcare Interoperability Resources specification is richer, more detailed, and built atop computer industry standard conventions (154). More detailed and precise specifications have also been developed specifically for communication within clinical laboratories, published as the Laboratory Analytical Workflows by the IVD Industry Connective Consortium and the Integrating the Healthcare Enterprise and further codified in Clinical and Laboratory Standards Institute AUTO16. These specifications spell out how to transmit critical information regarding laboratory test results, such as the unique device identifiers that precisely label a test result’s performing instrument and method. These achievements bring the potential to considerably streamline laboratory data exchange but have been minimally adopted thus far. If laboratory community members were more engaged in and advocating for interoperability, it could catalyze the implementation of these new standards.
These same barriers also exist within individual clinical laboratories. Our information systems and interfaces are not designed to flexibly enable the implementation of new computational tools. Poor interoperability between devices and information systems makes it extremely challenging to access data or to connect external tools that use ML. Moreover, our information systems’ rigidity severely limits their ability to implement more sophisticated computational methods internally. There is progress being made on these fronts, but it has been glacial. This slow pace is likely due to a combination of factors, including the absence of coordinated demand from the clinical laboratory community, immense inertia to change, limited competition among information system vendors, and the misalignment of incentives across various stakeholders.
Poor data quality and AI ethics
Beyond the challenges of accessing big data, the quality of the available data has also been a substantial barrier to progress. Even if we had interoperable devices and complete metadata, the limited standardization and harmonization of laboratory tests add considerable complexity to learning ML models that can generalize across clinical practices. In addition, as clinical data are not collected for the purpose of secondary research, the data include considerable bias, including the consequences of inequities of care associated with patients’ race (155). This bias can manifest as differential data missingness or can surreptitiously affect predictors or outcomes. Naïve ML approaches to learning predictive models that do not account for the data ascertainment schema or inappropriately make use of biased surrogate outcomes risk maintaining or exacerbating these biases (156). The ethical use of ML requires conscientious consideration of the clinical use case how the ML application will affect diverse patients. The importance of such efforts is illustrated by the controversy of the inclusion of race in the calculation of estimated glomerular filtration rate (157). Race was included in the estimated glomerular filtration rate prediction model because it improved predictive performance in the available training data, but its inclusion reinforces race-based medicine, only modestly improves performance, and likely exacerbates underlying inequities in the care of patients with chronic kidney disease (158).
Future Directions and Opportunities
Medical device manufacturers are actively exploring diagnostic approaches that are newly feasible with AI. We can likely expect the further expansion of IVD technologies into important and potentially unanticipated directions. A salient and recent example is how the Accelerate Pheno® is used to provide rapid antimicrobial susceptibility test results from real-time digital image analysis of bacterial cell growth. Similarly, Chen et al. recently described the application of AI to quantify protein biomarkers within a microbubbling digital assay format using bright‐field smartphone microscopy (159). Further, researchers are continuing to investigate whether AI can enable measurements of nontraditional analytes such as those found in the analysis of breath, the pupillary light reflex, or vocal patterns (160–162). While the latter examples may fall beyond the scope of traditional laboratory medicine, it remains an open question how such tests would fit into existing point-of-care management strategies and regulatory structures.
Computational pathology is an emerging field that incorporates AI and extends beyond digital pathology and whole-slide imaging. Computational pathology is a pathologist-led diagnostic approach involving the integration and analysis of raw clinical data, including multiple data sources (e.g., laboratory information system, EHR, imaging, etc.) (163). Luo et al. recently published a straightforward example of this that involved the combination of patient demographic information and routinely available laboratory measurements to predict disease or future laboratory results. They demonstrated high accuracy with their method and highlighted the potential value of multianalyte analyses (164). While the results of preliminary efforts in computational pathology are promising, there are a multitude of challenges to be considered when using real-world data. One of the major challenges confronted when deploying prediction models in production environments is the sparsity of data. Researchers have investigated technical solutions to ameliorate the issues associated with sparse matrices, and ML-based methods to impute missing data have shown promise in improving the accuracy of laboratory data-based predictions (165). Further progression of computational pathology will undoubtedly require the close coordination between computational specialists, pathologists, and clinicians to ensure high-quality and clinical useful results.
As discussed in previous sections, there are many open questions regarding the best practices and regulatory frameworks for ML in clinical practice. Research on ML has demonstrated repeatedly that the technology is susceptible to many kinds of errors such as overfitting. This may limit the generalizability of a model to future data and result in unexpected deviations from previous apparent performance. These types of errors intuitively resemble the random and systematic error we observe with IVD assays. Although the precise error mechanisms are different, much can be learned from well-established clinical laboratory frameworks for ensuring quality. Laboratory practices of quality control and quality assurance are excellent correlates for appropriate postdeployment monitoring of ML models in production environments. While such monitoring is not yet required, draft guidance on these issues from the FDA and other regulatory bodies suggests that mandates in this area are forthcoming. However, delineations of responsibility for such provisions remain to be defined (134). Furthermore, ML-driven approaches can maintain or exacerbate healthcare disparities due to biases present in the data or within existing care delivery systems. It is critical that best practices and regulatory frameworks consider how to evaluate for and mitigate these effects.
Beyond the technically oriented future of AI, socialization of AI technology with laboratorians and clinicians is an area of active discussion among professional organizations and researchers. A recent survey of laboratory professionals indicated that a quarter of respondents were concerned about potential job loss and quality issues with AI implementation. In addition, 72% of respondents were unsure or indicated they have never been in contact with an AI application in their daily activities. These results may suggest that, as the presence of AI continues to increase in the laboratory, there will be a need to promote education on technological awareness, ML literacy, and the scope and purpose of AI among laboratorians (166). Historically, computer science and AI have progressed much faster than clinical medicine. While there is a perceived benefit of implementing newly developed AI technologies in real time as they emerge, there remains a need to resolve the discrepant pace of the 2 fields and emphasize the need for evidence-based implementations of AI/ML-based models (167). Lastly, as many of the models being implemented, both in and outside the laboratory, rely on data generated by the laboratory, laboratorians are uniquely qualified to be stewards of these technologies, which offers a potential area of growth opportunity for the profession (168).
Finally, additional opportunities exist for business intelligence applications in laboratory medicine, particularly in how the clinical laboratory demonstrates value to healthcare delivery organizations amidst shifting reimbursement paradigms. While laboratory services have historically been reimbursed in a fee-for-service structure, value-driven healthcare initiatives are poised to change the utilization and management of laboratory resources. Recently, the Laboratory 2.0 concept has been introduced to encourage the application of laboratory practice principles and the analysis of laboratory data to optimize clinical care practices traditionally outside of the laboratory’s domain (169). While there are limited examples of business intelligence platforms assisting in laboratory management in this regard, this is an area of big potential and where we are likely to see expansion soon.
AI and ML have and will continue to dramatically alter the way in which laboratory data are analyzed and drive clinical care decisions. The ongoing development of more sophisticated ML methods, coupled with emerging laboratory measurement technologies, should lead to further improvements in clinical efficiency and patient outcomes. It is paramount that these approaches be rigorously designed, evaluated, and monitored to ensure quality, achieve effectiveness, and minimize harm. Laboratorians have an important role to play in the development and stewardship of ML in laboratory medicine to enable us to realize the full potential of data-driven healthcare.
Nonstandard Abbreviations
AI, artificial intelligence; ML, machine learning; IVD, in vitro diagnostics; CDSS, clinical decision support system; FDA, Food and Drug Administration; MIC, minimum inhibitory concentrations; NGS, next-generation sequencing; EHR, electronic health record.
Author Contributions
All authors confirmed they have contributed to the intellectual content of this paper and have met the following 4 requirements: (a) significant contributions to the conception and design, acquisition of data, or analysis and interpretation of data; (b) drafting or revising the article for intellectual content; (c) final approval of the published article; and (d) agreement to be accountable for all aspects of the article thus ensuring that questions related to the accuracy or integrity of any part of the article are appropriately investigated and resolved.
Authors’ Disclosures or Potential Conflicts of Interest
Upon manuscript submission, all authors completed the author disclosure form. Disclosures and/or potential conflicts of interest:
Employment or Leadership
None declared.
Consultant or Advisory Role
W. Schulz, Hugo Health, Instrumentation Laboratories, Interpace Diagnostics; D. Rhoads, Talis Biomedical, Luminex (Scientific Advisory Board); T. Durant, Roche, Instrumentation Laboratories.
Stock Ownership
W. Schulz, Refactor Health.
Honoraria
None declared.
Research Funding
D. Herman, grant from Roche Diagnostics to institution; D. Rhoads, BD, Biofire, Cepheid, Luminex, OpGen.
Expert Testimony
None declared.
Patents
None declared.
Other Remuneration
D. Herman, travel reimbursement for consulting from Roche Diagnostics.
References
510(K) Summary: DiffMaster Octavia.
Technology | Fabric Genomics.
23andMe offers new genetic report on type 2 diabetes. 23andMe Blog.
Food and Drug Administration. Proposed regulatory framework for modifications to artificial intelligence/machine learning (AI/ML)-based software as a medical device (SaMD).
Food and Drug Administration. Clinical Decision Support Software: Draft Guidance for Industry and Food and Drug Administration Staff'.
