


Abstract
Nonadherence to standard operating procedures (SOPs) during handling and processing of whole blood is one of the most frequent causes affecting the quality of serum and plasma. Yet, the quality of blood samples is of the utmost importance for reliable, conclusive research findings, valid diagnostics, and appropriate therapeutic decisions.
UHPLC-MS-driven nontargeted metabolomics was applied to identify biomarkers that reflected time to processing of blood samples, and a targeted UHPLC-MS analysis was used to quantify and validate these biomarkers.
We found that (4E,14Z)-sphingadienine-C18-1-phosphate (S1P-d18:2) was suitable for the reliable assessment of the pronounced changes in the quality of serum and plasma caused by errors in the phase between collection and centrifugation of whole blood samples. We rigorously validated S1P-d18:2, which included the use of practicality tests on >1400 randomly selected serum and plasma samples that were originally collected during single- and multicenter trials and then stored in 11 biobanks in 3 countries. Neither life-threatening disease states nor strenuous metabolic challenges (i.e., high-intensity exercise) affected the concentration of S1P-d18:2. Cutoff values for sample assessment were defined (plasma, ≤0.085 μg/mL; serum, ≤0.154 μg/mL).
Unbiased valid monitoring to check for adherence to SOP-dictated time for processing to plasma or serum and/or time to storage of whole blood at 4 °C is now feasible. This novel quality assessment step could enable scientists to uncover common preanalytical errors, allowing for identification of serum and plasma samples that should be excluded from certain investigations. It should also allow control of samples before long-term storage in biobanks.
Blood samples are one of the most frequently used materials in medical research and practice. Conclusions with wide-reaching consequences are drawn from investigations involving serum and plasma. Consequently, the quality of blood samples is of the utmost importance for valid diagnostics and appropriate therapeutic decisions, as well as for reliable, conclusive research findings. Indications of good-quality samples can be based on whether blood samples are collected and handled in a reproducible manner following standard operating procedures (SOPs)13 (1). However, even highly standardized processes are not infallible, and random and systematic errors (e.g., inaccuracies during blood collection or handling, delays during blood transportation, interruptions in the cold chain) may occur. These errors greatly affect the quality of the samples (1–4).
Currently, substantial efforts are being undertaken worldwide to set up high-quality standardized biobanks that will store billions of sample aliquots, including those from national cohort studies (5–11). An important goal of these national cohorts is to draw precedent-setting conclusions for use by national healthcare systems (12, 13). The processes undertaken in biobanks are extremely controlled to avoid any negative effects on the sample quality (14). Accreditation for biobanking provides strict parameters to maintain quality (e.g., through the College of American Pathologists). However, the greatest effects on sample quality can occur before the blood samples arrive at the biobanks. Besides hemolytic samples, other common unavoidable problems in clinical and research settings affecting sample quality are inaccuracies during handling of whole blood and the delayed separation of blood cells from serum and plasma. Currently, there is no widely used valid quantitative test to assess these inaccuracies and delays before centrifugation and storage of samples for years.
Inaccuracies in blood handling outside of laboratories cause 60% to 80% of errors in clinical diagnostic testing (1, 15–18). Unexpected test results often cause the validity of the tests to be questioned rather than the sample quality (2). Currently, quality assessments of blood samples used in routine clinical testing laboratories, research, and biobanking involve qualitative tests for hemolysis, icterus, and lipemia (19), but these tests are not in widespread use. In light of the potentially long-term consequences of relying on misleading findings, e.g., in biomarker studies, the use of only high-quality samples would be highly desirable, and even vital in some circumstances.
Here we report a biomarker that is suitable for reliable check for adherence to SOP-dictated time for processing to plasma and/or time to storage of whole blood at 4 °C regardless of whether there is knowledge of the preanalytical collection and processing procedures, i.e., from blood collection to centrifugation and the separation of blood cells from the serum or the plasma.
Materials and Methods
STUDY DESIGN, BIOMARKER SCREENING, AND VALIDATION
We carried out nontargeted biomarker screening of EDTA plasma from 30 carefully phenotyped subjects who had fasted overnight and were randomly selected from healthy controls of a prediabetes study (20). The findings were confirmed using a validated targeted analysis that involved samples from 79 healthy individuals from the same study (20). Ten milliliters of EDTA blood were drawn from each participant and immediately divided into 5 aliquots. Subsequently, plasma was either immediately processed or processed after 2 h and 4 h at 22 °C [room temperature (RT)] or 4 °C (in ice water). The samples were all centrifuged at 4 °C (3100g for 7 min) and immediately stored at −80 °C in 100-μL aliquots until they were used in a UHPLC-MS-driven metabolomics analysis. Cutoff values for classifying good-quality plasma samples were calculated as described below. An outline of the study is provided in Fig. 1 of the Data Supplement that accompanies the online version of this article at http://www.clinchem.org/content/vol64/issue5. The robustness of the candidate biomarkers was assessed using blood collected from patients in an intensive care unit (ICU), which included patients with severe sepsis (n = 6), patients with liver cirrhosis (n = 6), and a patient with liver cirrhosis and sepsis (n = 1), and patients who had undergone cardiopulmonary resuscitation (n = 4). Furthermore, samples from individuals of 2 exercise studies were included. Exercise study 1 involved circuit training until exhaustion and blood collection directly before and after the exercise bout (n = 7), and exercise study 2 involved cycling for 3 h at 50% of the maximum volume of oxygen that each participant could use (VO2 max) with 4 blood collection time points: directly before the exercise bout and after 1 h, 2 h, and 3 h (n = 10). The blood samples involved in the robustness tests were all immediately cooled after they had been collected and were subsequently centrifuged and processed within 1 h. Moreover, the concentrations of (4E,14Z)-sphingadienine-C18-1-phosphate (S1P-d18:2) were quantified in 1408 samples (346 plasma samples and 1062 serum samples) originally collected during single-center and multicenter research trials from biobanks located in Germany (Tübingen), France (Lyon), and China (Dalian, Shanghai, Changchun, Beijing, Xiamen, and Jinan). We also investigated the effects of clotting time and cooling on the serum concentrations of S1P-d18:2. All investigations were approved by the ethics committees of the relevant university medical faculties. The participants provided written informed consent before beginning the study.
NONTARGETED UHPLC-TRIPLE TOF-MS METABOLOMICS ANALYSIS
For the identification of potential biomarkers, plasma samples were pretreated as described in the online Data Supplement and investigated in a nontargeted metabolomics analysis using a Waters ACQUITYTM UHPLC system coupled to an AB SCIEX TripleTOF® 5600 system. An ACQUITY ethylene-bridged hybrid C8 column (1.7 μm, 2.1 × 100 mm) and a high-strength silica T3 column (1.8 μm, 2.1 × 100 mm) were used in positive and negative mode, respectively. Detailed chromatographic and mass spectrometric conditions are provided in the online Data Supplement.
TARGETED UHPLC-TRIPLE QUADRUPOLE-MS ANALYSIS
For the quantification of candidate biomarkers, a targeted analysis was established using a UHPLC system (LC 30 AD, Shimadzu) coupled to a TQ 8050 triple quadrupole mass spectrometer (Shimadzu). S1P-d18:2 was separated on a 2.1 × 30-mm ACQUITY 1.8-μm high-strength silica T3 column (Waters). Multiple reaction monitoring in the positive mode was applied. The multiple reaction monitoring parameters for S1P-d18:2 were as follows: precursor, m/z 378; product, m/z 262; Q1 prebias, 25 V; CE, 18 V; and Q3 prebias, 20 V. All further analytical details, as well as the sample pretreatment before mass spectrometric analysis and method validation, are provided in the online Data Supplement. Furthermore, raw data from the method validation are provided as skyline files (see Material file in the online Data Supplement; see also online Data Supplement for instructions where to get this freeware and how to use it).
QUANTIFICATION OF S1P-D18:2 IN STANDARD REFERENCE MATERIALS
Applying the targeted approach, the concentration of S1P-d18:2 was determined in NIST-1950-plasma and NIST-909C-serum standard reference material (Sigma-Aldrich).
INVESTIGATION OF CLOTTING TIME AND EXPOSURE OF SERUM SAMPLES TO 4 °C FOR 2 AND 4 HOURS
The possible effects of different clotting times on the concentration of S1P-d18:2 in serum were investigated using samples collected in tubes with a coagulation enhancer (n = 50) and samples collected in tubes without a coagulation enhancer, which were associated with multiple time points (n = 43 at each time point). Blood was collected (according to the manufacturer's instructions) into either serum S-Monovette tubes containing beads coated with the coagulation enhancer kaolin, or S-Monovettes with no additives (both Sarstedt). After drawing, the blood in the S-Monovette tubes was allowed to clot at RT for 30 min (kaolin) or 60 min (no additives). Additional blood collection tubes without a coagulation enhancer were left to clot for 60 min and then were immediately cooled to 4 °C for 2 h and 4 h before centrifugation and serum preparation. The serum tubes were centrifuged at 3100g at 4 °C for 7 min. The resulting serum was immediately stored in 100-μL aliquots in cryotubes (Nunc) at −80 °C until further analysis.
STATISTICAL ANALYSIS
The panel data (e.g., data on blood kept at various temperatures) were evaluated using linear mixed-effects models to account for serial correlation between measurements of blood samples from the same individuals kept under different storage conditions. ROC curve analyses were used for the pairwise assessments of the diagnostic accuracy of the candidate biomarkers tested. These analyses were also used to calculate the analytical sensitivity and specificity. The Youden index was then used in accordance with our previous study (21) to identify an optimal cutoff value to characterize good-quality plasma. P values <0.05 and a false discovery rate of <0.05 were considered statistically significant. Stata 13.1 and SPSS 23.0 (IBM) were used for the data analyses.
Results
IDENTIFICATION OF BIOMARKERS THAT CAN REFLECT DEVIATIONS FROM SOPs DURING PROCESSING OF BLOOD SAMPLES
Nontargeted metabolomics was used to compare samples that were immediately processed with those samples that were immediately cooled and kept at 4 °C for up to 4 h or samples that were kept at RT for up to 4 h. First, there were large changes (>10%) in the concentrations of many plasma metabolites (out of 1843 ion masses) in the samples that had been kept at RT for 2 h and 4 h (i.e., 9.2% and 16.1% of the ion masses exhibited changes, respectively). In contrast, the whole blood samples that were immediately cooled and kept at 4 °C for 2 h and 4 h exhibited changes in just 0.5% and 1.8% of the ion masses, respectively. Metabolites showing good stability in whole blood under the investigated conditions are listed in Table 1 of the online Data Supplement. The time points 2 h and 4 h were chosen because in clinical and research settings the separation of plasma from blood can realistically be done in 2 h in most studies and in 4 h in almost all studies.
Subsequently, a subset of 188 identified metabolites out of the 1843 ion masses was used to elucidate potential biomarkers that could reflect delayed processing of blood samples. The metabolite ion masses m/z 378.239 and 89.026 were found to be the most promising candidate biomarkers (see Fig. 2 of the online Data Supplement). These 2 potential biomarkers of sample quality were identified as (4E,14Z)-sphingadienine-C18-1-phosphate (m/z 378.239; common name, sphingosine-1-phosphate d18:2; S1P-d18:2) and lactate (m/z 89.026). Details of the unequivocal identification of S1P-d18:2 are presented in the online Data Supplement (see Fig. 3 and Tables 2 and 3 in the online Data Supplement).
VALIDATION OF S1P-D18:2 AND LACTATE AS POTENTIAL BIOMARKERS
For validation, a rapid targeted mass spectrometric method was first developed (total analysis time, 6 min) including evaluation of the performance for precision, linearity, and stability in autosampler (see Figs. 4–6 and Table 4 in the online Data Supplement). The results of the nontargeted metabolomics approach shown in Fig. 1 of the online Data Supplement were reproduced in plasma samples from 79 individuals (Fig. 1, A and B), except for a slight but significant increase in the concentration of lactate in the samples that were kept at 4 °C for 4 h (Fig. 1B). Fig. 1C shows the results of the ROC curve analyses. S1P-d18:2 was associated with an area under the ROC curve (AUC) of 0.993, and lactate was associated with an AUC of 0.979.
Evaluation of the suitability of 2 candidate biomarkers to reflect the effects of the delayed processing of whole blood samples on plasma quality.
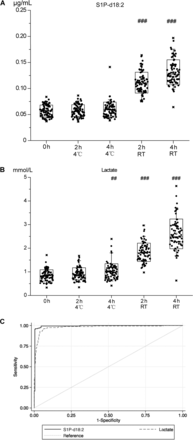
The concentrations of S1P-d18:2 and lactate in plasma (n = 79 per time point) were quantified in a targeted approach using UHPLC-electrospray ionization-triple quadrupole-MS (A and B). A comparison of blood that was immediately cooled after collection for up to 4 h before plasma preparation vs blood kept at RT for up to 4 h before plasma preparation was performed. Mixed-effects linear regression models were used; #, P < 0.05; ##, P < 0.002; ###, P < 0.0001 vs blood that was immediately processed after blood drawing (named 0 h). ROC curve analyses of S1P-d18:2 and lactate for the classification of good-quality plasma; the S1P-d18:2 AUC is 0.993 and the lactate AUC is 0.979. Solid line, S1P-d18:2; dashed line, lactate (C).
ROBUSTNESS TESTS OF S1P-D18:2 AND LACTATE
We investigated blood samples from individuals experiencing extreme physiological and pathophysiological conditions, i.e., life-threatening diseases and strenuous exercising. This was carried out to test the robustness of S1P-d18:2 and lactate in their ability to distinguish between changes occurring by delayed blood processing vs changes in factors related to the extreme physiological and pathophysiological conditions.
First, cutoff values for the classification of good-quality plasma were calculated using the concentrations measured in the validation study in the samples that were processed immediately and those that were kept at 4 °C for 2 h and 4 h (Fig. 1). The cutoff values for S1P-d18:2 and lactate were found to be ≤0.085 μg/mL and ≤1.306 mmol/L, respectively. Fig. 2A shows that the plasma concentrations of S1P-d18:2 in all the test conditions were below the cutoff value; however, Fig. 2B shows the pronounced increases observed in the concentrations of lactate in some samples of ICU patients with severe sepsis and cardiopulmonary resuscitation, as well as in those collected in the circuit training study. This indicated that lactate was an inadequate biomarker; therefore, it was excluded from subsequent investigations.
Robustness tests of 2 candidate biomarkers using blood associated with individuals experiencing extreme physiological and pathophysiological conditions.
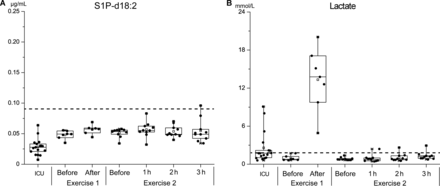
S1P-d18:2 (A) and lactate (B) results of the robustness tests. Dashed line, cutoff values indicating good-quality samples according to S1P-d18:2 and lactate concentrations. The cutoff values for good-quality samples were calculated as described in the Materials and Methods section using the concentrations of the biomarkers in the plasma sample sets shown in Fig. 1, A and B, which were generated from blood that was immediately processed and blood that was exposed to 4 °C for 2 h and 4 h. The cutoff value for S1P-d18:2 is ≤0.085 μg/mL, and that for lactate is ≤1.306 mmol/L.
There were also lower concentrations of S1P-d18:2 in the samples from ICU patients compared with the samples from both exercise studies (Fig. 2A). We speculated that anemia may cause these lower concentrations because ICU patients often suffer from anemia, and erythrocytes have been reported to be the major origin of total S1P and total dihydro-S1P in blood (22). A subsequent investigation of the correlation between the hematocrit and the concentration of S1P-d18:2 in the samples from the ICU patients corroborated this hypothesis (r2 = 0.45; P = 0.003) (see Fig. 7 in the online Data Supplement).
PRACTICALITY TESTS TO ASSESS THE ADHERENCE TO SOP-DICTATED TIME FOR PROCESSING TO PLASMA AND/OR TIME TO STORAGE OF WHOLE BLOOD AT 4 °C
Subsequently, to perform a representative test of practicality, we investigated 346 randomly selected plasma samples from 3 biobanks located in Germany, France, and China. Only samples that were collected in accordance with SOPs were included. Based on these SOPs, the blood drawn for all the plasma samples should have been cooled immediately, kept at 4 °C and processed within 2 h (biobanks A and B), or as soon as possible (biobank C). According to the records of biobank C, half of the 99 plasma samples were frozen within 4 h after the blood was drawn, and the other half were frozen after 6 to 9 h.
Fig. 3 shows the concentrations of S1P-d18:2 in these plasma samples. The samples from biobanks A and B were originally collected during single-center trials by a specialized team at a single hospital ward, which was reflected in the predominance of S1P-d18:2 concentrations below the cutoff (Fig. 3, A and B). The concentrations of S1P-d18:2 of the samples from biobank C, which were originally collected in a multicenter research trial by field teams working at several recruitment sites, were varied (Fig. 3C). Although a sampling record implied good sample quality, the reality appeared to differ. This underlines the highly relevant nature of assessments of sample quality.
Practicality tests using plasma samples from single-center and multicenter research trials in 3 countries.
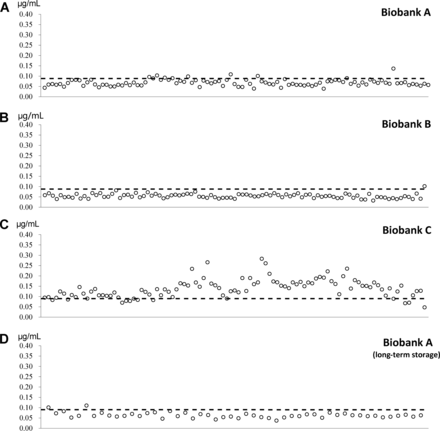
Randomly selected plasma samples from biobank A (n = 100) and biobank B (n = 97) that were originally collected during single-center research trials by specialized teams at hospital wards in 2 countries (A and B). Randomly selected plasma samples from biobank C (n = 99) that were originally collected during a multicenter research trial by field teams working at several recruitment sites in a single country (C). Fifty plasma samples from biobank A after 5 years of storage (D). Dashed line, cutoff value for good-quality samples.
Additionally, we studied the effect of long-term storage on the concentration of S1P-d18:2. We detected no differences between 100 randomly selected plasma samples that had been stored for 6 months (Fig. 3A) and 50 randomly selected plasma samples that had been stored for 5 years in the same biobank (Fig. 3D).
PRACTICALITY TESTS TO ASSESS THE ADHERENCE TO SOP-DICTATED TIME FOR PROCESSING TO SERUM AND/OR TIME TO STORAGE OF WHOLE BLOOD AT 4 °C
To study S1P-d18:2 as a quality marker for serum, we first compared blood in serum collection tubes with and without coagulation enhancers because the presence or absence of coagulation enhancers determines the rate of clotting. We detected significant differences in the S1P-d18:2 concentrations associated with 30 min and 60 min of clotting (Fig. 4A). These are the most common clotting times recommended by the manufacturers of serum collection tubes. Subsequently, we also tested the effects of cooling the blood to 4 °C for 2 h and 4 h after clotting; in these circumstances, we detected slight increases in the concentration of S1P-d18:2 (Fig. 4A).
Assessment of the adherence to SOP-dictated time for processing to serum and/or time to storage of whole blood at 4 °C in single-center and multicenter research trials using S1P-d18:2.

Effects of different clotting times using samples collected in tubes with a coagulation enhancer (n = 50) and samples collected in tubes without a coagulation enhancer (n = 43 at each time point) (A). Mixed-effects linear regression models were used; $$$, P < 0.0001 for 60-min vs 30-min clotting time; ###, P < 0.0001 2 h or 4 h at 4 °C after 60-min clotting time vs immediate preparation after 60-min clotting time. Concentrations of S1P-d18:2 in samples that were collected in different single-center trials at the same hospital and stored in the same biobank (B). Top panel, serum collected by a specialized team at a single hospital site (n = 113). Bottom panel, 3 sets of samples from biobank D that were collected in single-center trials by nurses and medical doctors in routine clinical settings in accordance with SOPs (n = 80). Concentrations of S1P-d18:2 in serum samples (n = 869) that were originally collected during a multicenter research trial on liver diseases (at 8 hospitals in 6 cities; stored in 7 biobanks) (C). Solid line, cutoff value (mean + 3 SD) for good-quality samples, i.e. processed in adherence to the SOP during collection and handling of blood samples (<0.154 μg/mL), which was defined using the sample set from biobank D (top panel of B) that was collected by a specialized team.
Fig. 4B shows the results of the concentrations of S1P-d18:2 in serum samples that were stored in the same biobank and that had originated from 4 single-center research trials that were run at the same hospital but collected by different teams. Some of the samples were collected by a specialized team (Fig. 4B), and the others were collected by nurses and medical doctors under routine conditions in clinical settings (Fig. 4B). Clear differences in the concentrations of S1P-d18:2 were observed, with the samples that were collected during routine clinical work showing higher concentrations of S1P-d18:2.
The cutoff value for serum shown in Fig. 4, B and C (mean + 3 SD, 0.154 μg/mL), was calculated from serum samples collected under tightly controlled conditions, i.e., using the S1P-d18:2 concentrations shown in the top panel of Fig. 4B. Furthermore, we investigated the concentrations of S1P-d18:2 in >800 serum samples that were originally collected during a multicenter research trial on liver diseases, including hepatocellular carcinoma, liver cirrhosis, and hepatitis, as well as healthy controls (Fig. 4C). The samples were collected in accordance with identical SOPs, except for the samples that were stored in biobank G, which used its own (similar) SOP. The clotting time was 30 min at RT followed by cooling. Centrifugation and storage of serum at −80 °C were performed as soon as possible. In addition to highlighting the general consistency in S1P-d18:2 concentrations, Fig. 4C further underlines the robustness of S1P-d18:2 because none of the liver diseases (hepatocellular carcinoma, liver cirrhosis, and hepatitis) was associated with significant changes.
CONCENTRATIONS OF S1P-D18:2 IN REFERENCE MATERIALS FROM NIST
In NIST standard reference material S1P-d18:2 concentrations of 0.07 (±0.0029) μg/mL for plasma (NIST-1950) and 0.061 (±0.0014) μg/mL for serum (NIST-909c) were measured (mean of 5 independent analyses ± SD). Both concentrations were below the cutoff values for the classification of good-quality plasma and serum samples.
Discussion
The improvement of the value of biomarker research, as well as strategies to avoid poor reproducibility of results, is an ongoing debate in medical sciences and beyond (23–25). The unwitting inclusion of serum and plasma samples of insufficient quality may contribute to poor reproducibility and misleading findings in biomarker studies, but currently no objective and reliable assessment of sample quality is generally used in medical research (except the identification and exclusion of hemolytic samples). The assessment of adherence to SOP-dictated time for processing and/or time to storage of whole blood at 4 °C, i.e., the timespan between blood drawing and centrifugation, by quantifying the concentration of S1P-d18:2 could enable clinical chemists and other scientists to uncover common preanalytical errors, allowing the identification of serum and plasma samples that should be excluded from certain investigations. Importantly, this quality assessment is possible without any knowledge of how the samples were collected and handled. For profiling studies (e.g., metabolomics biomarker analyses) or the long-term storage of samples in biobanks, only good-quality samples should be used.
The validation, robustness, and practicability tests revealed that S1P-d18:2 was a reliable biomarker under the investigated conditions; it was not affected by hepatocellular carcinoma, liver cirrhosis, hepatitis, severe sepsis, prior cardiopulmonary resuscitation, or strenuous exercise. On the other hand, marked increases in the concentration of S1P-d18:2 in blood samples occurred in vitro when the sample tubes were kept at RT. S1P-related analytes, like sphingomyelins, did not show such pronounced changes owing to improper sample handling (see Fig. 8 in the online Data Supplement). Compared with the in vitro increases of S1P-d18:2, the in vivo conditions known to increase total S1P concentrations in humans, such as exercise (26), appear to be minor and, to the best of our knowledge, would not affect the quality assessment. Nevertheless, we cannot exclude that diseases and conditions not tested in our study could influence S1P concentrations. In such cases, we highly recommend a pretest analysis using blood samples that were collected with stringent adherence to the relevant SOP.
It has been hypothesized that S1P-d18:2 largely originates from erythrocytes, as demonstrated for total S1P and total dihydro-S1P (22). This hypothesis is supported by the detected clear correlation between the hematocrit and S1P-d18:2 and recent reports on total S1P species (27, 28). As a consequence and also current limitation, the use of the quality assessment in studies on anemia needs to be adjusted because the appropriate cutoff value for S1P-d18:2 for samples from those individuals with anemia is likely to differ from the cutoff value for samples from those without anemia. However, for ethical reasons, we could not define a cutoff value by collecting blood from patients with anemia.
The poor reproducibility of biomarker and other research studies is a point that is currently being intensely debated (23–25), and the temperature and time to processing of blood is one of several preanalytical variables that can lead either to samples being outliers or to large scatter in metabolite measurements. In general, the sample collection procedures used in biomarker and other studies, although tightly controlled by protocols and SOPs, are heterogeneous with respect to logistical, personnel-related, and organizational conditions. Our findings demonstrate that obtaining reproducible good-quality samples is achievable in daily practice, but the risk of random and systemic errors is high, particularly in stressful situations. The use of specialized and meticulous teams to focus on sample collection, proper conditions during transportation, and blood processing may minimize this risk. However, human error is to be expected. We detected that a relatively short delay in blood processing (of 2 h or 4 h at RT) led to numerous significant changes.
Ideally, whole blood samples intended for isolating plasma should be cooled immediately and then processed within minutes, which is not possible in most cases, to ensure a reproducible product. Given the feasible SOPs and the common logistic preconditions, we recommend that plasma collection tubes be immediately cooled. Subsequently, the separation of the blood cells from the plasma should be performed within 2 h, and this should be followed directly by freezing. If the logistical conditions allow for a consistently faster processing speed, this should be implemented. If processing is feasible only within 4 h, the reproducibility of novel biomarkers and other findings should be validated using more rapidly processed samples because even in the cooled samples we detected slight changes (i.e., >10% changes in the concentrations in 1.79% of the 1843 metabolite ion masses after 4 h).
To the best of our knowledge, there have been few published studies on tools to detect changes in the quality of whole blood samples that have undergone delayed processing (4, 29, 30). In these studies, either the use of complex, difficult-to-analyze biomarker patterns has been suggested (4) or less robust parameters (such as lactate) have been used (29, 30). A limitation to the application of S1P-d18:2 in the assessment of serum, which can be eliminated with reasonable effort, is the need to define distinct cutoff values that apply to samples collected in various types of serum collection tubes, as well as samples associated with different clotting times. This is in clear contrast to the widely applicable EDTA-plasma cutoff value of 0.085 μg/mL. It is worth noting that samples with concentrations that are above the cutoff value can still be deemed to be suitable for use in investigations of robust routine parameters with documented long-term stability when the whole blood samples are kept at RT.
To conclude, the quantification of S1P-d18:2 in serum and plasma samples provides a new step to check for adherence to SOP-dictated time for processing to plasma or serum and/or time to storage of whole blood at 4 °C. The possible effects of the use of this quality assessment include an improvement in the reproducibility of biomarker studies. Given the enormous financial expenditures over the past decades on the biobanking and the analysis of blood samples, it would be highly worthwhile to introduce a reliable strategy to assess the quality of serum and plasma samples (beyond checking for hemolysis, icterus, and lipemia) before their storage or use. In light of our findings, we propose that S1P-d18:2 can be used as a reliable biomarker to uncover frequent inaccuracies in one of the most error-prone preanalytical steps, i.e., the phase between blood drawing and the separation of blood cells from serum and plasma.
13 Nonstandard abbreviations
- SOP
standard operating procedure
- RT
room temperature
- ICU
intensive care unit
- S1P-d18:2
(4E,14Z)-sphingadienine-C18-1-phosphate
- AUC
area under the curve.
Author Contributions:All authors confirmed they have contributed to the intellectual content of this paper and have met the following 3 requirements: (a) significant contributions to the conception and design, acquisition of data, or analysis and interpretation of data; (b) drafting or revising the article for intellectual content; and (c) final approval of the published article.
Authors' Disclosures or Potential Conflicts of Interest:Upon manuscript submission, all authors completed the author disclosure form. Disclosures and/or potential conflicts of interest:
Employment or Leadership: L. Fritsche, Helmholtz Zentrum München's Institute of Diabetes Research and Metabolic Diseases at Eberhard-Karls-Universität Tübingen.
Consultant or Advisory Role: None declared.
Stock Ownership: None declared.
Honoraria: None declared.
Research Funding: G. Xu, grants that were part of the National Key Research and Development Program of China (2017YFC0906900) and the National Science Foundation of China (81472374), and a grant from the Sino-German Center for Research Promotion (Ref. GZ 753), awarded by the National Science Foundation of China and the German Research Foundation; R. Lehmann, grants from the Sino-German Center for Research Promotion (Ref. GZ 753), awarded by the National Science Foundation of China and the German Research Foundation, and (Ref. LE 1391/1–1), awarded by the German Research Foundation; a grant from the German Federal Ministry of Education and Research (Ref. 01GI0925), awarded to the German Center for Diabetes Research.
Expert Testimony: None declared.
Patents: None declared.
Role of Sponsor: The funding organizations played no role in the design of study, choice of enrolled patients, review and interpretation of data, or final approval of manuscript.
References
