


Abstract
Little is known about the status of renal replacement therapy (RRT) in the post-Soviet countries. We therefore investigated the epidemiology and treatment outcomes of RRT in Ukrainian patients and put the results into an international perspective.
Data from the Ukrainian National Renal Registry for patients on RRT between 1 January 2010 and 31 December 2012 were selected. We calculated the incidence and prevalence of RRT per million population (pmp) and the 3-, 12- and 24-month patient survival using the Kaplan–Meier method and Cox regression.
There were 5985 prevalent patients on RRT on 31 December 2012 (131.2 pmp). Mean age was 46.5 ± 13.8 years, 56% men and 74% received haemodialysis (HD), while peritoneal dialysis and kidney transplantation both represented 13%. The most common cause of end-stage renal disease was glomerulonephritis (51%), while only 12% had diabetes. In 2012, 1129 patients started dialysis (incidence 24.8 pmp), with 80% on HD. Mean age was 48 ± 14 years, 58% men and 20% had diabetes. Three, 12- and 24-month patient survival on dialysis was 95.1%, 86.0% and 76.4%, respectively. The transplant rate in 2012 was 2.1 pmp.
The incidence and prevalence of RRT and the transplantation rate in Ukraine are among the lowest in Europe, suggesting that the need for RRT is not being met. Strategies to reduce the RRT deficit include the development and improvement of transplantation and home-based dialysis programmes. Further evaluation of the quality of Ukrainian RRT care is needed.
Introduction
Population ageing and increasing prevalence of diabetes mellitus and hypertension have resulted in an increased burden of end-stage renal disease (ESRD) [1]. Nevertheless, the magnitude of these predisposing factors substantially varies across countries [2, 3]. As health expenditure on renal replacement therapy (RRT) may reach up to 3% of national healthcare budgets [4], also economic factors have been suggested to drive the number of patients taken onto dialysis. The important variation in the incidence of RRT between countries has been associated with demographical, economical and organizational differences [5] and recently also a relationship between macroeconomic factors and dialysis survival outcome has been established [6]. However, little is known on the epidemiology and outcome of RRT patients in post-Soviet countries and on the quality of care provided to their patient populations.
Ukraine, one of the 15 states formerly included in the Union of Socialistic Soviet Republics (USSR), is currently one of the largest countries in Europe. Since its independence in 1992 the country remains in a transitional state, not only politically and economically, but also regarding health care, with consequences for the availability of RRT. In 2002, the Ukrainian National Renal Registry was established to obtain countrywide information on patients with chronic kidney disease (CKD) Stages I–V, with the aim to inform regional and national authorities on the state of their nephrological care and where possible to influence their decisions regarding its organization.
This study reports on the epidemiology and treatment outcomes of RRT in Ukrainian patients and puts the results into an international perspective using information from European and global studies in the same patient group.
Materials and methods
Data collection and follow-up
Each nephrological centre in Ukraine is obliged by the Ministry of Health to register every new patient with diagnosed CKD. For patients on RRT, the registration form contains the date of starting dialysis or transplantation, type of vascular access, therapy complications and changes, type of donor kidney and status of graft function as well as selected clinical and medication data. By the end of each calendar year the patient's information is updated by his or her nephrologist and the data are sent to the national registry in Kiev via the regional centre for nephrology and dialysis.
Currently, the registry contains data of ∼500 000 patients with CKD Stages I–V. The most extensive data are available for the patients on RRT, as they are best monitored. Out of the National Renal Registry database we therefore selected all patients treated with RRT, as reported by renal centres from all 27 Ukrainian regions between 1 January 2010 and 31 December 2012.
Data on Ukrainian demography were collected from the official website of the Ukrainian State statistical committee (www.ukrstat.gov.ua). Data on life expectancy at 60 years (the number of years an individual aged 60 years would be expected to live) was derived from www.ec.europa.eu/eurostat. In addition, the following macroeconomic indicators were collected:
Gross domestic product (GDP) per capita purchasing power parity (ppp). This measure of national wealth is expressed in US dollars and adjusted for ppp, which eliminates the differences in price levels between the countries. Data were derived from the databases of the World Bank NHP Stats (www.data.worldbank.org).
Health care expenditure, as percentage of GDP (percentage of gross domestic product spent on health care), expressed in US dollars. These data were derived from the World Health Organization HFA database (www.who.int).
Human development index (HDI) was created by United Nations, combines indicators of life expectancy, education and income to validate the state of a nation's development. Collected from www.hdr.undp.org.
Clinical data
The glomerular filtration rate (GFR) at the start of dialysis was estimated by the modification of diet in renal disease formula. Data on serum calcium, phosphorus, albumin and haemoglobin were collected by the end of 2012 or by the end of a follow-up in the case of drop-out.
Statistical analyses
We calculated the prevalence and incidence of RRT per million population (pmp) for 2012. Standard descriptive statistics like Student's t-tests and χ2 tests were used to compare characteristics between patient groups.
In order to calculate survival on dialysis we selected patients incident on dialysis between 1 January 2010 and 31 December 2012. We used the Kaplan–Meier method and Cox regression models and analysed 3-, 12- and 24-month survival from Day 1 of dialysis. In addition, we calculated 1 and 2-year survival from Day 91 for the patients who were still on dialysis after the first 90 days. The event of interest was death from all causes while follow-up time was censored at the time of transplantation, loss to follow-up and at the end of the observation period (31 December 2012). We compared patient survival between age categories, males and females, primary causes of renal failure and between haemodialysis (HD) and peritoneal dialysis (PD) treatment. We performed univariate and multivariate Cox regression analyses to calculate crude and adjusted hazard ratios (HRs) for 2-year patient survival, both from Day 1 and from Day 91. The multivariate model included the variables age, sex, primary kidney disease and dialysis modality.
All statistical analyses were performed using SPSS statistical software, version 20.0 (SPSS Inc., Chicago, IL, USA). P-values <0.05 were considered statistically significant.
Results
Country characteristics
General information about Ukrainian demography and macroeconomics is presented in Table 1. It shows that Ukraine is a large country with almost 46 million inhabitants with a GDP of 6620 US dollars per capita and 7.7% of GDP spent on health care.
Selected data on Ukrainian demography and macroeconomic indicators derived from the World Bank NHP Stats, World Health Organization (WHO), UN data and Ukrainian state statistical committee
| Population (2011) | 45.598200 |
|---|---|
| Territorial area | 603.500 km2 |
| % City/rural | 70/30 |
| Administrative regions, number | 27 |
| GDP per capita, ppp (US$) (2009/2010) | 6620/4043 |
| Health expenditure, total (%GDP) (2010) | 7.7 |
| Health expenditure per capita ($US$) (2010) | 234.4 |
| Human development index (HDI) | 0.73 |
| Life expectancy at birth, female/male (years) | 76/65 |
| Life expectancy at 60 years (years) | 18 |
Prevalent RRT patients
The 5985 patients reported to be alive on RRT by 31 December 2012 were included into the current analysis (Table 2). Among them, 4406 received HD, 787 received PD treatment and 792 patients were reported as living on a functioning renal graft. The RRT prevalence was 131.2 pmp. More than 90% of all prevalent patients were aged 20–64 years, while the oldest age group of 75 years and older accounted for only 1%. Traditionally, the leading role in Ukrainian RRT is played by HD: in 2012, 74% of prevalent RRT patients were treated with this modality (96.6 pmp), while PD and kidney transplantation both represented 13% of patients. This predominance of HD existed in all age groups. Whereas the majority of dialysis patients were between 45 and 64 years old, most transplant recipients were aged 20–44 years.
Demographical and clinical characteristics of prevalent RRT patients (on 31 December 2012)
| All | HD | PD | Tx | |
|---|---|---|---|---|
| N (%) | 5985 (100) | 4406 (74) | 787 (13) | 792 (13) |
| Age, mean (SD) | 46.5 (13.8) | 47.8 (13.4) | 47.4 (13.9) | 38.6 (13.1) |
| Age categories, % | ||||
| 0–19 years | 2 | 1 | 2 | 5 |
| 20–44 years | 42 | 38 | 39 | 65 |
| 45–64 years | 49 | 52 | 50 | 27 |
| 65–74 years | 7 | 8 | 7 | 2 |
| 75+ years | 1 | 1 | 2 | 1 |
| Sex, % men | 56 | 57* | 50 | 58 |
| Residence, % city inhabitants | 67 | 66 | 67 | 71 |
| Primary renal disease, % | ||||
| Diabetes mellitus | 12 | 12* | 23 | 4 |
| Glomerulonephritis | 51 | 49* | 42 | 71 |
| Hypertension | 3 | 4 | 3 | 0.4 |
| Pyelonephritis | 14 | 14 | 16 | 9 |
| Polycystic kidney disease | 10 | 11* | 7 | 4 |
| Other | 10 | 10 | 9 | 11 |
| eGFR at the start of dialysis, mL/min, mean (SD) | 10.3 (3.5) | 10.3 (3.4)* | 9.7 (4.1) | n/a |
| EPO use (%) | 62 | 63* | 54 | n/a |
| Haemoglobin, g/L, mean (SD) | 98.7 (18.2) | 98.5(18.3)* | 99.9 (17.5) | n/a |
| Iron medication (%) | 90 | 91 | 86 | n/a |
| Serum albumin, g/La, mean (SD) | 39.0 (5.7) | 39.0 (5.7) | 38.8 (5.8) | n/a |
| Serum Ca, mmol/La, mean (SD) | 2.2 (0.3) | 2.3 (0.3) | 2.2 (0.3) | n/a |
| Serum P, mmol/La, mean (SD) | 1.75 (0.6) | 1.75 (0.6) | 1.76 (0.6) | n/a |
| P-binders, % of use | 90 | 91 | 87 | n/a |
| Vit. D, % of use | 81 | 81 | 80 | n/a |
Totals may not add up to 100% due to rounding off.
HD, haemodialysis; PD, peritoneal dialysis; Tx, transplantation; SD, standard deviation; y.o., years old; eGFR, estimated glomerular filtration rate; EPO, erythropoietin; Ca, calcium; P, phosphorus; P-binders, phosphate binders; Vit. D, vitamin D.
aData are missing for up to 35% of patients.
*P < 0.05 HD versus PD patients.
Most patients started RRT for ESRD due to glomerulonephritis, whereas diabetes mellitus was the cause of ESRD in only 12%. Patients started on dialysis on average at a GFR of 10.3 mL/min. Mean haemoglobin in dialysis patients was 98.7 g/L with use of erythropoietin (EPO) in 62% of patients and iron medications in 90% of patients, predominantly orally (68%). Mean serum albumin was 39 g/L with 13% of patients with levels <35 g/L. Mean values for serum calcium and phosphate were 2.20 and 1.75 mmol/L, respectively. Phosphate binders were used by 90% of patients and 82% of these medications were calcium based. Eighty-one percent of the patients used vitamin D medications, predominantly orally.
At the end of 2012, there were only two private dialysis centres from a total of 85; the majority of HD patients were treated in public, in-patient dialysis centres. The average ± standard deviation (SD) weekly time on HD was 12.6 ± 2.8 h (range 8–24 h). In 71% of the patients, a low-flux dialysis membrane was used. Virtually all HD patients (98%) had an arteriovenous fistula as vascular access.
Utilization of PD in Ukraine started in 2001. Although the registry does not collect technical data on PD, the classic continuous ambulatory peritoneal dialysis schedule with four times 2 L exchanges is known to be predominating, mostly using a twin-bag system with conventional PD solutions.
Fifty-three percent of transplant recipients lived with a kidney from a living-related donor and 2% on a spouse kidney. Forty-two percent had a graft from a deceased donor and for 3% the type of donor was unknown. Five patients lived on a second graft.
Incident RRT patients in 2012
In 2012, a number of 1129 patients started RRT (24.8 pmp). All of them started on dialysis, 228 of whom (20%) on PD. The mean age was 48 ± 14 years; 58% were men; and 66% were city inhabitants. Patients starting RRT on HD or PD did not differ in age, but PD patients more often had diabetes mellitus as cause of renal failure than HD patients (Table 3).
Comparison of the baseline characteristics of incident dialysis patients who started HD or PD treatment between 1 January 2010 and 31 December 2012
| All | HD | PD | |
|---|---|---|---|
| Patients, n (%) | 3094 | 2515 (81) | 579 (19) |
| Age, mean ± SD | 48.2 (14.3) | 48.3 (14.2) | 47.9 (14.6) |
| Age categories, %a | |||
| 0–19 years | 2 | 2 | 2 |
| 20–44 years | 35 | 34 | 38 |
| 45–64 years | 52 | 53 | 48 |
| 65–74 years | 10 | 10 | 11 |
| 75+ years | 1 | 1 | 2 |
| Sex, % men | 56 | 57* | 52 |
| Residence, % city inhabitants | 65 | 65 | 64 |
| Primary renal disease, % | |||
| Diabetes mellitus | 20 | 18* | 27 |
| Glomerulonephritis | 38 | 38 | 37 |
| Hypertension | 5 | 6 | 5 |
| Pyelonephritis | 16 | 16 | 16 |
| Polycystic kidney disease | 9 | 10* | 5 |
| Other | 12 | 12 | 11 |
| eGFR at the start of dialysis, mL/min | 10.4 (3.4) | 10.5*(3.4) | 9.7 (3.8) |
HD, haemodialysis; PD, peritoneal dialysis; SD, standard deviation; eGFR, estimated glomerular filtration rate.
aThe column percentage is % of patients of certain age category per RRT modality.
*P < 0.05 HD versus PD patients.
Patient survival on dialysis
For the 3094 patients who started dialysis over the period 2010–12, we analysed patient survival. Within 2 years after the start of dialysis there were 438 deaths among those who started on HD and 66 deaths among those who started on PD. Three, 12- and 24-month patient survival from Day 1 on dialysis were 95.1%, 86.0% and 76.4%, respectively. Unadjusted patient survival on HD was lower than on PD, P = 0.001 (Figure 1a). When comparing the different causes of renal failure, patients with glomerulonephritis had the best survival probability while diabetic patients had the worst outcome (Figure 1b). In the youngest age group, none of the patients died (Figure 1c). Two-year survival was not different between men and women: 76 versus 77% (P = 0.38).
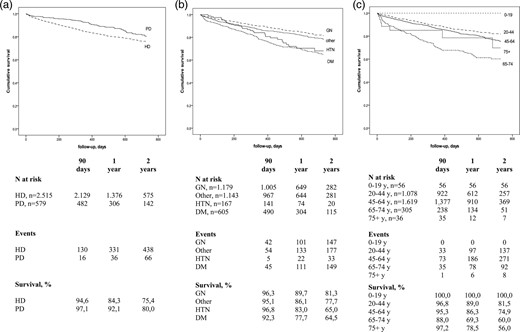
Kaplan–Meier curves for patient survival from Day 1, by dialysis modality (a), primary renal disease (b) and age category (c). HD, haemodialysis; PD, peritoneal dialysis; GN, glomerulonephritis; HTN, hypertension; DM, diabetes mellitus; y, years.
Using a Cox regression model, the crude HR of death while being treated with HD when compared with PD treatment was 1.48 [95% confidence interval (CI): 1.15–1.89]. Also after adjustment for age, sex and primary kidney disease, HD patients had a higher risk of death [HR: 1.54 (95% CI: 1.20–1.97)] when compared with PD patients. To facilitate comparison with international studies, we also performed survival analysis from Day 91 onwards. Of 2615 patients who were alive on dialysis after 90 days of treatment, 85.2% were alive after the first year and 75.8% survived the second year on dialysis (Table 4). An additional analysis was performed for younger patients and those older than65 years: the 2-year survival was 80% for younger patients and 64% for older ones.
One-and 2-year survival probabilities, (from Day 91 to 1- and 2-years +90 days, by age, gender and primary renal disease)
| N | 1-Year survival (%) | 2-Year survival (%) | |
|---|---|---|---|
| All | 2615 | 85.2 | 75.8 |
| Age categories | |||
| 0–19 years | 51 | 100.0 | 100.0 |
| 20–44 years | 922 | 87.3 | 80.4 |
| 45–64 years | 1378 | 85.0 | 74.2 |
| 65–74 years | 239 | 73.0 | 59.4 |
| 75+ years | 25 | 92.3 | 82.0 |
| Sex | |||
| Men | 1416 | 87.9 | 77.2 |
| Women | 1154 | 86.8 | 78.1 |
| Treatment modality | |||
| HD | 2132 | 84.3 | 75.2 |
| PD | 483 | 88.1 | 77.6 |
| Primary renal disease | |||
| Diabetes | 491 | 76.1 | 60.0 |
| Glomerulonephritis | 1009 | 88.5 | 81.1 |
| Hypertension | 145 | 72.2 | 61.8 |
| Other | 970 | 87.3 | 78.3 |
HD, haemodialysis; PD, peritoneal dialysis.
Difference in unadjusted 2-year survival between HD and PD patients was borderline significant (75.2 versus 77.6%; P = 0.07). The unadjusted HR of death while being treated with HD when compared with PD treatment was 1.28 (95% CI: 0.97–1.68). After adjustment for age, sex and primary kidney disease, HD patients had a 35% higher risk of death [HR: 1.35 (95% CI: 1.02–1.78)] in comparison with patients on PD.
Transplant activity in 2012
There were 98 transplants performed in 2012 (2.1 pmp). Mean age at transplantation was 32.4 ± 13 years, with the oldest patients (15.3%) being between 45 and 64 years old; 62% were men and only 7% of the patients had diabetes. Seventy-one percent of patients received a kidney from a living-related donor; 1% got a graft from a spouse and 25% were transplanted with a cadaveric kidney. Finally, in 3% the type of donor was unknown.
Discussion
In the current article, we report for the first time on the epidemiology, treatment characteristics and patient survival in Ukrainian RRT patients. To the best of our knowledge, this is also the first time that such data are presented from a classic post-Soviet country. We found that the prevalence and incidence of RRT in 2012 in Ukraine were 131.2 and 24.8 pmp, respectively, among the lowest in European countries reporting their data to the ERA-EDTA Registry. The (unadjusted) 1- and 2-year patient survival on dialysis was 86.0 and 76.4%, which is somewhat higher compared with other countries in Europe. In the following we discuss potential explanations for our findings by making international comparisons using information from European and global studies in the same patient group.
The number of patients starting on RRT substantially varies around the globe [7], and also within Europe there is a wide variation in RRT incidence. The majority of the European countries providing data to the ERA-EDTA Registry have an RRT incidence ranging between 100 and 150 pmp [8]. The highest incidence of RRT has been reported for Turkey (238 pmp) and Portugal (226 pmp), whereas Ukraine with 24.8 pmp closed the ranks after Montenegro (25.8 pmp) and Russia (42.9 pmp). Being <10% of that in Portugal, the prevalence of RRT in Ukraine (131.2 pmp) is the lowest in Europe [8].
Ukrainian RRT patients are on average ∼10 years younger than those in other European countries where mean ages range from 58–65 years for incident and 55–60 years for prevalent patients [9]. This is in line with the relatively large share of chronic glomerulonephritis as the primary renal disease, which accounted for >50% in prevalent and 38% in incident Ukrainian patients. However, it can be speculated that in Ukraine, the percentage of glomerulonephritis was overestimated as such a diagnosis is seldom confirmed by biopsy and is often assumed to be the primary cause of renal failure when no other cause is found. The percentages of patients starting RRT for ESRD due to diabetes mellitus or hypertension/renal vascular renal disease and the percentage of other and unknown causes were generally lower in Ukraine than that in other countries (diabetes between 13% and 49% and hypertension/renal vascular renal disease between 2 and 32% [8]).
With regard to RRT modalities, Ukraine follows the pattern of Eastern and many of South European countries—predominantly using HD in >70% of prevalent patients, while the share of HD in Western European countries just reaches 50% by actively increasing transplantation rates. In contrast, in Ukraine the percentage of PD utilization is relatively high [8], although this may also reflect the underdeveloped renal transplantation with the lowest yearly rate in Europe. The latter is a result of an underdeveloped living donor programme together with a virtually absent transplantation of cadaveric kidneys.
With regard to HD dose, 63% of Ukrainian patients received a 12 h per week regimen, which is similar to the other European countries where this on average was 59.3% [10]. An arteriovenous fistula as vascular access was used in 98% of Ukrainian patients which is much higher than reported in the literature [10, 11]. When comparing the two dialysis modalities, we found that HD and PD patients were similar in age and that PD patients were more often female and more often had diabetes than those on HD. This is in contrast with other studies in which PD patients are usually younger [12–14] and less often have diabetes [12, 13]. In Ukraine, however, only 11% of dialysis patients is >65 years of age explaining a more even age distribution across modalities. In general, where access to RRT is limited, dialysis modality choice is dictated rather by actual availability of HD stations than by well-considered modality selection.
When comparing clinical characteristics, serum albumin levels were somewhat higher (39 g/L) in Ukraine than those in patients from other European countries participating in the Dialysis Outcomes and Practice Patterns Study (DOPPS) (36 g/L) [15, 16]. In contrast, mean haemoglobin levels were much lower (98.5 g/L) than reported for DOPPS patients (≥110 g/L) [15, 17]. This may in part be due to less frequent prescription of intravenous iron injections (35 versus 43–71%) and EPO (62 versus 63−84%) than in DOPPS [17]. Calcium and phosphorus levels as well as the prescription of phosphate binders (91%) were similar to those described in the literature [15]. Nevertheless, the type of phosphate binders differed: whereas 82% of Ukrainian patients used calcium-based phosphate binders, in DOPPS this was 73%. Synthetics like sevelamer were used by only 6 versus up to 17% in DOPPS [15]. These findings suggest that the more expensive treatments like EPO and sevelamer are prescribed less frequently in Ukraine than in countries with higher health expenditures. Finally, vitamin D was prescribed more often, 81 versus 33–66% in the countries participating in DOPPS [15, 16].
It has been shown that prevalence of RRT is associated with GDP per capita [18]. Incidence of RRT on the other hand is associated with other macroeconomic factors, such as fross national income per capita [2, 18], health care system and renal service organization [19], as well as general population demographics, its health status [20] and the prevalence of diabetes [21]. Furthermore, results of the EVEREST study showed that factors such as GDP per capita, health expenditure as proportion of GDP and HDI were positively associated with the number of patients starting RRT in a country [5]. Caskey et al. found that every 1% increase in GDP spent on health care was associated with an 11% increase in RRT incidence. Furthermore, other studies showed that the country's overall spending for ESRD correlates with per capita healthcare spending [2]. These macroeconomic indicators are lower for Ukraine in comparison with all developed European countries participating in the EVEREST study [6]. However, compared with the neighbouring country Romania, that has similar health expenditures, Ukraine still has a five-time lower incidence of RRT [6, 9]. This suggests that in addition to the level of health expenditures also other factors like healthcare organization and financial prioritizing might play a role in admission of patients to RRT and other factors affecting RRT incidence. For instance, the share of for-profit dialysis facilities—another factor that is positively associated with RRT incidence—is very low in Ukraine (2.3%), while in Romania already in 2003 this sector accounted for 20% [6]. The very low incidence and prevalence of RRT in a large country with a low GDP may indicate that the need for RRT is not being met. In addition, the low mean age together with the relatively low share of diabetes suggests a highly selected RRT population, which most likely leaves the older and sicker patients untreated. The latter may be due to various reasons such as late or non-referral to a nephrologist or patient delay. It is, however, difficult to approximate the need for RRT in Ukraine because of the low life expectancy. The life expectancy for men is 65 years which equals the mean age of the incident dialysis population in many European countries. In Ukraine many patients may therefore die before they even reach ESRD.
The overall unadjusted 2-year patient survival on dialysis in Ukraine is better than that of European patients in general: 76.4 versus 69.9% (from Day 1) and 75.8 versus 71.6% (from Day 91) [8]. Comparison of survival for the separate age categories, however, reveals that from both Day 1 and Day 91, the 2-year survival was generally worse than in the European countries providing data on patient survival to the ERA-EDTA Registry. In contrast, the survival of the youngest (<20 years) and oldest (≥75 years) patients in Ukraine was better potentially indicating an even stricter patient selection in those age categories. In addition, the better 2-year survival on PD versus HD is in line with other publications [12, 14, 22, 23].
Although the data provided by the Ukrainian National Renal Registry give valuable and relatively extensive epidemiological information about RRT in the country, some limitations should be mentioned. The majority of clinical and medication data only reflect the last available data in a calendar year while data recorded at the start of dialysis is not available. Furthermore, the registry does not include data on comorbidity, which hampers adjustment for resulting case-mix differences in (survival) analyses. Adjustment for age and primary renal disease, however, has been shown to largely solve this problem [24].
In conclusion, our findings allowed the status and outcomes of Ukrainian RRT to be put into a European prospective. The low incidence and prevalence of RRT in the country suggest that the need for RRT is not being met. Considering the very low transplantation rate and the much younger dialysis population than in the rest of Europe, strategies to reduce the RRT deficit in Ukraine should be the development and improvement of transplantation and home-based dialysis programmes. Comparison of the available indicators of RRT quality in Ukraine to other European countries provided equivocal results. Further investigation is needed to evaluate the quality of Ukrainian RRT care.
Conflict of interest statement
The results presented in this paper have not been published previously in whole or part, except in abstract format.
Acknowledgements
This work has been made possible by the collection of data by physicians and nurses in the Ukrainian nephrology centres and by a fellowship from the European Renal Association-European Dialysis and Transplant Association (ERA-EDTA). The Ukrainian National Renal Registry takes responsibility for the integrity of the data.


Comments