


Abstract
A 58-year-old man with Stage 3b chronic kidney disease and primary hyperparathyroidism treated with cinacalcet was admitted for acute cholecystitis. A cholecystostomy tube was placed, estimated glomerular filtration rate decreased, metabolic acidosis developed and ionized calcium increased from 1.33 to 1.76 mM despite cinacalcet administration. A sodium bicarbonate infusion corrected the metabolic acidosis restoring ionized calcium to normal despite no improvement in renal function. The correlation between the increase in serum bicarbonate and decrease in ionized calcium was r = −0.93, P < 0.001. In summary, severe hypercalcemia was attributable to metabolic acidosis increasing calcium efflux from bone while renal failure decreased the capacity to excrete calcium.
Introduction
Metabolic acidosis is responsible for many actions that affect calcium homeostasis. These include increased calcium efflux from bone [1, 2], enhanced release of albumin-bound calcium in the circulation [3], stimulation of parathyroid hormone (PTH) secretion [4–6] and increased renal excretion of calcium [1, 2, 7]. The bone effects of metabolic acidosis may in part be due to stimulation of osteoclastic activity and suppression of osteoblasts [8–10], but the rapid response to metabolic acidosis would suggest that calcium efflux from bone is also a physicochemical process [11, 12]. Stimulation of PTH secretion by metabolic acidosis is likely due to its effect on the calcium-sensing receptor in which sensitivity to calcium is decreased [13]. The increase in serum calcium induced by metabolic acidosis inhibits further PTH secretion [14]. Finally, metabolic acidosis enhances renal calcium excretion through its effect on TRPV5 in the distal tubule [7]. Besides increased efflux of calcium, the simultaneous release of bicarbonate from bone buffers the metabolic acidosis. Thus, the effect of metabolic acidosis on calcium is complex and involves bone, and the parathyroid gland and kidney. As such, it is difficult in an in vivo setting to separate the direct effect of metabolic acidosis on calcium efflux from bone from that of increased PTH secretion and enhanced renal excretion of calcium. Because of several unique features of the patient described below, the case provides insights into the magnitude of the independent effect of metabolic acidosis on calcium efflux from bone and the resulting hypercalcemia.
Case report
The patient is a 58-year-old male with primary hyperparathyroidism and Stage 3b chronic kidney disease (CKD) with a baseline serum creatinine of 2 mg/dL [estimated glomerular filtration rate (eGFR) 34 mL/min/1.73 m2]. Primary hyperparathyroidism and low proteinuric CKD were ascribed to previous long-term lithium use. The patient was taking cinacalcet 30 mg three times daily to control the hyperparathyroidism. Recent ionized calcium values ranged from 1.28 to 1.43 mM (normal 1.15–1.29 mM). The last intact PTH value obtained 4 months before admission was 45 pg/mL (Bayer Advia Centaur, normal 14–72 pg/mL). Other pertinent medical conditions included a previous emergency colectomy with ileostomy for severe clostridia difficile colitis, paranoid schizophrenia, recurrent pancreatitis, paroxysmal atrial fibrillation and hypertension. Twelve days before admission, his weight, height and body mass index were 139.8 lbs (63.5 kg), 70 in. (177.8 cm) and 20.1, respectively.
The patient, a nursing home resident and bedridden for 2 years, was sent to the emergency department because of abdominal pain. The white blood cell count was 25 200. Other pertinent admission chemistries included serum creatinine 2.51 mg/dL (222 µmol/L), bicarbonate 18 mmol/L and ionized calcium 1.33 mM. Serum amylase was normal, and lipase was minimally increased at 79 U/L (normal 5–58 U/L). Serum alkaline phosphatase was 416 U/L, bilirubin 2.2 mg/dL (37 µmol/L) and albumin 1.8 g/dL (18 g/L). Acute cholecystitis was diagnosed based on imaging studies showing a distended gallbladder with wall thickening and stone. Because the patient was a poor surgical candidate, a percutaneous cholecystostomy tube was placed and intravenous levofloxacin, flagyl and normal saline were started. The patient also had acute kidney injury superimposed on CKD (Table 1), low serum bicarbonate and hypercalcemia (Figure 1). During the next 2 weeks, serum bicarbonate values decreased to 13–15 mmol/L presumably because of renal failure, daily replacement with 3–3.5 L of normal saline and bicarbonate losses via copious ileostomy output and drainage from the cholecystostomy tube. Serum creatinine increased from 2.51 (222 µmol/L) to 3.76 mg/dL (332 µmol/L) (eGFR 27 to 17 mL/min/1.73 m2) despite continuous volume expansion with normal saline (Table 1). Ionized calcium increased from an admission value of 1.33 mM to a peak value of 1.76 mM (Figure 1) even though cinacalcet was continued at 30 mg three times daily. A PTH value was 45 pg/mL when the ionized calcium was 1.71 mM. A 1,25 vitamin D level drawn on hospital day 10 was <8 pg/mL (<19 pmol/L) (normal 18–72 pg/mL). An arterial blood gas on hospital day 12 showed a metabolic acidosis with a pH 7.25, bicarbonate 14 mmol/L and pCO2 29 mmHg. On the following day, the patient was started on D5 ½ normal saline with 50 meq of sodium bicarbonate added to each liter, at 150 mL/h. During the next 5 days, ionized calcium decreased from 1.61 to 1.18 mM as serum bicarbonate increased from 14 to 23 mmol/L (Figure 1). The correlation between serum bicarbonate and ionized calcium was r = −0.93, P < 0.001. During the same time, eGFR only improved marginally from 17 to 19 mL/min/1.73 m2.
Biochemical results before and after bicarbonate treatment during hospital admission
| Hospital day | Sodium (mmol/L) | Chloride (mmol/L) | Potassium (mmol/L) | BUN (mg/dL) | Creatinine (mg/dL) | eGFR (mL/min/1.73 m2) | Calcium (mg/dL) | Phosphorus (mg/dL) | Albumin (g/dL) |
|---|---|---|---|---|---|---|---|---|---|
| 1 | 134 | 109 | 4.5 | 25 | 2.51 | 27 | 8.2 | 4.1 | 1.8 |
| 3 | 136 | 112 | 4.4 | 34 | 2.89 | 23 | |||
| 5 | 132 | 112 | 3.6 | 34 | 2.84 | 23 | |||
| 8 | 136 | 115 | 3.3 | 23 | 3.02 | 21 | 10.5 | 3.6 | 1.7 |
| 10 | 139 | 120 | 3.3 | 18 | 2.91 | 22 | |||
| 12 | 136 | 117 | 4.0 | 19 | 3.22 | 20 | |||
| 13a | 137 | 117 | 3.8 | 23 | 3.37 | 19 | |||
| 14 | 135 | 114 | 4.0 | 31 | 3.76 | 17 | |||
| 16 | 135 | 111 | 3.8 | 31 | 3.62 | 17 | |||
| 18 | 135 | 108 | 3.9 | 33 | 3.49 | 18 | 8.0 | 4.2 | 1.6 |
| 20 | 138 | 107 | 4.6 | 33 | 3.43 | 19 |
To convert blood urea nitrogen (BUN) mg/dL to mmol/L multiply by 0.357. To convert creatinine mg/dL to µmol/L multiply by 88.4. To convert calcium to mmol/L multiply by 4. To convert phosphorus to mmol/L multiply by 0.3229. To convert albumin to g/L multiply by 10.
aBicarbonate replacement was started on hospital day 13.
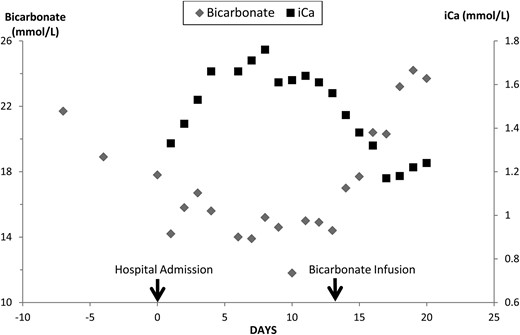
Serum bicarbonate and ionized calcium (iCa) values are shown during the development and treatment of metabolic acidosis.
Discussion
The patient was admitted for acute cholecystitis. During the hospitalization, his Stage 3b CKD deteriorated to advanced Stage 4 kidney disease presumably from sepsis. Urine output remained adequate despite renal failure. The progressive decrease in serum bicarbonate was shown by arterial blood gas to be from metabolic acidosis. Besides renal failure, also contributing to the decrease in serum bicarbonate was gastrointestinal losses from the gallbladder drainage and the ileostomy [15] and the continuous infusion of normal saline. As serum bicarbonate decreased, the ionized calcium concentration increased dramatically. During metabolic acidosis, more calcium is released from circulating albumin but the amount is limited especially in this patient with a serum albumin of 1.5–1.9 g/dL (1.5–1.9 g/L) [3]. Although not measured, the patient's capacity to excrete a calcium load would be greatly reduced because of renal failure [16, 17]. Thus, the main source of the hypercalcemia in this patient with metabolic acidosis must have been from bone. Furthermore, treatment of the metabolic acidosis with an infusion of sodium bicarbonate resulted in a progressive correction of the hypercalcemia despite no improvement in renal function. Immobilization would seem to be an unlikely cause of hypercalcemia because the patient was already immobilized for 2 years, immobilization was unchanged before and after the development and resolution of the hypercalcemia, and changes in ionized calcium correlated with the degree of acidosis.
In the 1960s, Lemann et al. [1] showed that (i) in normal volunteers, ammonium chloride-induced metabolic acidosis increased renal calcium excretion producing a negative calcium balance but did not increase serum calcium values; (ii) in azotemic patients, renal calcium excretion was markedly decreased and correction of metabolic acidosis modestly decreased calcium excretion [16] and (iii) in hypoparathyroid patients, metabolic acidosis greatly increased renal calcium excretion without increasing serum calcium concentration [2]. In young female volunteers, organic acidosis from starvation ketosis was shown to induce mild hypercalcemia with near doubling of urinary calcium excretion as serum creatinine increased from 0.8 (71 µmol/L) to 1.1 mg/dL (97 µmol/L) [18]. Bicarbonate administration during the starvation period prevented changes in serum and urine calcium, but not in serum creatinine. Moreover, when renal failure is present in rats, acute and chronic metabolic acidosis has resulted in hypercalcemia [8, 10].
The patient had primary hyperparathyroidism for which he continued to receive high doses of cinacalcet during the hospital admission. The effect of bile drainage on cinacalcet metabolism is unknown, but abnormalities in liver function increase the half-life of cinacalcet according to the package insert. The PTH value remained similar to that in his baseline state despite the marked hypercalcemia. The failure of hypercalcemia to suppress PTH could have been from stimulation of PTH secretion by metabolic acidosis. Acute metabolic acidosis has been shown to increase PTH secretion in animals [4, 5] and correction of metabolic acidosis to decrease PTH secretion in azotemic humans [6, 19]. Also, how much of the measured PTH is actually intact PTH is difficult to know because as renal failure progresses the PTH assay also measures large, truncated amino-terminal PTH fragments [20, 21].
Patients with advanced CKD have metabolic acidosis, but do not develop hypercalcemia. Rather secondary hyperparathyroidism develops to maintain normal serum calcium. In vitro studies have shown that metabolic acidosis and PTH have an additive effect on calcium efflux from bone [22]. In our patient, besides primary hyperparathyroidism and metabolic acidosis, the high doses of the calcimimetic could have enhanced calcium efflux from bone. The calcimimetic could be acting on the putative calcium-sensing receptor in bone with acidosis affecting its sensitivity [23]. Finally, chronic calcimimetic exposure and persistent mild hypercalcemia could have affected the calcitonin response, which has been reported to have an important physiologic role protecting against the development of hypercalcemia [24–26].
Metabolic acidosis could also affect the influx and efflux of bone calcium by inhibiting osteoblast formation [9, 22]. Such an effect has been shown to increase calcium efflux from bone in an intestinal-specific vitamin D receptor-null mouse model in which high endogenous 1,25 vitamin D levels directly increased calcium efflux from bone partly by decreasing calcium influx to bone through inhibition of bone mineralization [27].
In summary, in the present case report, the development of metabolic acidosis and progressive renal failure resulted in severe hypercalcemia from increased bone efflux of calcium and a decreased renal capacity to excrete calcium. Despite no improvement in renal function, treatment of the metabolic acidosis with sodium bicarbonate completely corrected the hypercalcemia highlighting the important role of calcium efflux from bone. Preexisting primary hyperparathyroidism and high doses of the calcimimetic could have contributed to the development of hypercalcemia.
Conflict of interest statement
None declared.


Comments