


ABSTRACT
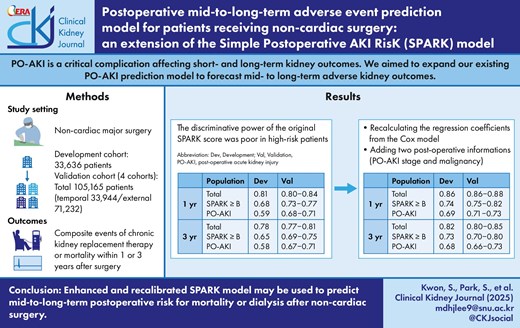
Postoperative acute kidney injury (PO-AKI) is a critical complication of adverse kidney outcomes, both short and long-term. We aimed to expand our pre-existing PO-AKI prediction model to predict mid-to long-term adverse kidney outcomes.
We included patients who underwent major non-cardiac surgeries from the original SPARK cohort, two external validation cohorts, and a temporal validation cohort. Mid-to-long-term adverse kidney outcomes were defined as end-stage kidney disease progression or death within 1 or 3 years after surgery. We verified and tuned the original Simple Postoperative AKI RisK (SPARK) model to predict mid-to-long-term adverse kidney events.
We included 33 636 patients in development, 71 232 patients in external validation, and 33 944 patients in temporal validation cohorts, respectively. One- and 3-year adverse kidney events occurred in 5.5% and 13.2% in the development cohort, respectively. The original SPARK score demonstrated an acceptable discriminative power for 1-year and 3-year adverse outcome risks with C indices mostly >0.7. However, the power was relatively poor when restricted to high-risk patients or those who actually developed PO-AKI. When we re-calculated the regression coefficients from a Cox model, the discriminative performances were better, especially for those with high-risk characteristics (e.g. 1-year outcome, C-index 0.72 in developmental and 0.73‒0.77 in validation datasets). Furthermore, when the model integrated the PO-AKI stage and history of malignancy with the SPARK variables, the performance was significantly enhanced (1-year, C-index 0.86 in development and 0.86‒0.88 in validation results). With the above findings, we constructed an online postoperative risk prediction system (https://snuhnephrology.github.io/postop/).
The addition of two clinical factors and recalibration of SPARK variables significantly improved mid-to-long-term postoperative risk prediction for mortality or dialysis after non-cardiac surgery. Our calculator helps clinicians easily predict a mid-to-long-term risk and PO-AKI occurrence by entering a few variables.
INTRODUCTION
Postoperative acute kidney injury (PO-AKI) is a major complication after surgery associated with a critical impact on patient prognosis [1, 2]. PO-AKI is related to higher socioeconomic burdens, longer hospital stays, and long-term risks of chronic kidney disease or cardiovascular disorders [3–5]. The risk of PO-AKI is important not only after cardiac surgeries, when the incidence is particularly high [6, 7], but also after non-cardiac operations, as a non-negligible number of non-cardiac surgery recipients suffer from worse patient outcomes related to PO-AKI [2, 8].
Previous studies have developed PO-AKI risk prediction models under various circumstances [9–12, 13]. Estimation of PO-AKI risk after non-cardiac surgery is particularly important as the incidence is low to moderate; thus, evidence-based recommendations for follow-up kidney function measurements and monitoring strategies would be helpful for the appropriate use of medical resources. However, the previous prediction systems mostly focused only on the occurrence of PO-AKI and did not consider the mid-to-long-term patient prognosis [2]. Considering that the risks of kidney failure or mortality are increased in non-cardiac surgery patients with PO-AKI in the long term, an estimation strategy for the risks would be helpful for clinicians to evaluate the prognosis of non-cardiac surgery recipients [14, 15].
In our previous study, we developed the Simple Postoperative AKI RisK (SPARK) classification, which can be used before major non-cardiac surgeries to estimate the risk of PO-AKI and critical AKI (e.g. AKI associated with mortality or death) by a single scoring system based on 11 clinical variables [9]. In the current study, we aimed to expand the SPARK classification to build a risk prediction model for mid-to-long-term adverse events after non-cardiac surgery combined with postoperative kidney function. By incorporating the newly developed model for mid-to-long-term risks, we developed an online comprehensive risk prediction tool that can be used before and after non-cardiac surgery to assess the risk of PO-AKI and associated mid-to-long-term prognosis as a composite of kidney replacement therapy (KRT) or mortality.
MATERIALS AND METHODS
Ethical considerations
This study was approved by the Institutional Reviewer Boards (IRBs) of the Seoul National University Hospital (IRB No. H-2102-192-1203) and Bundang Seoul National University Hospital (IRB No. B-2107-698-401), and the Seoul Metropolitan Government Boramae Medical Center (IRB No. 20-2021-57). This study was conducted in accordance with the principles of the Declaration of Helsinki. The requirement for informed consent was waived by the attending institutional IRBs because this was a retrospective observational study without any medical intervention.
Study setting and object
This study aimed to develop a model to estimate the 1- and 3-year risks of mortality or dialysis after non-cardiac surgery and to validate the findings in external cohorts. We intended to build a comprehensive patient prognosis estimation system based on kidney function and related parameters which first use the previous SPARK classification before non-cardiac surgery to estimate the risk of PO-AKI and critical AKI, and then use the newly developed model after the surgery to assess mid-to-long term prognosis. In the newly developed model, we reused the SPARK variables and limited the number of newly required clinical variables to retain simplicity. We intended to include a small number of variables to ease the adoption of the risk calculation model in other centers.
Study population
We included four study cohorts in the study (Fig. 1). The discovery cohort used in our previous study to develop the SPARK classification, which included non-cardiac surgery cases from Seoul National University from 2004 to 2013, was used as the primary development cohort for the mid-to-long-term risk prediction model. Second, a temporal validation cohort including non-cardiac surgery cases from the same hospital from 2014 to 2020 was included. In addition, non-cardiac surgery cases from Seoul National University Bundang Hospital from 2003 to 2020 and Seoul Metropolitan Government Boramae Medical Center from 2013 to 2020 were included as two additional validation cohorts. To account for temporal changes within the validation cohort, the data from Seoul National University Bundang Hospital were divided into two distinct cohorts: Period 1 (2005–12) and Period 2 (2013–20).
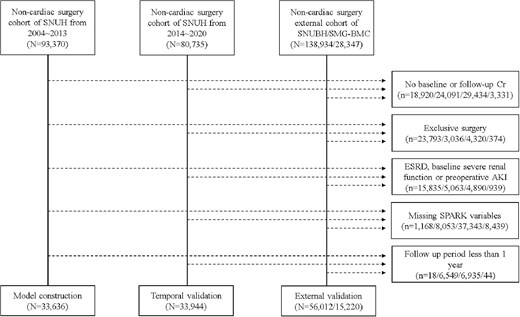
Flow chart of development, temporal validation, and external validation cohort. SNUH, Seoul National University Hospital; SNUBH, Seoul National University Bundang Hospital; SMG-BMC, Seoul Metropolitan Government Boramae Medical Center.
As the inclusion criteria, the non-cardiac major surgery cases included surgeries performed in general surgery, neurosurgery, obstetrics and gynecology, orthopedics, and urology surgery departments with actual operation duration ≥1 hour. If a patient underwent multiple surgeries, only the first surgery was enrolled, as the previous surgery could violate the patient's condition before and after subsequent operations.
Patients without baseline or follow-up serum creatinine levels within 7 days after surgery were excluded. Surgical cases of deceased patients (e.g. cadaveric liver donors) were excluded. In addition, kidney transplantation cases or surgeries, including nephrectomies, were excluded because of direct kidney volume and functional alterations after such operations. To exclude those with established end-stage kidney disease, those with baseline eGFR <15 mL/min/1.73 m2 or a history of KRT were excluded. In addition, as serum creatinine elevation ≥4 mg/dL itself is a criterion for stage 3 AKI, those with such high serum creatinine values before surgery were excluded. In addition, because we aimed to develop a mid-to-long-term risk prediction model in addition to the previous SPARK classification, patients with missing information on the previous SPARK variables were excluded. Finally, as we aimed to use this model within 7 days after surgery when follow-up creatinine levels were measured, patients who died or underwent dialysis within this period were excluded.
After applying the inclusion and exclusion criteria, the following patients who underwent major non-cardiac surgeries were included in the study cohorts: development cohort (N = 33 636), temporal validation cohort (N = 33 944), validation cohort of Seoul National University Bundang Hospital (N = 56 012, Period 1 = 11 309; Period 2 = 44 703), and validation cohort of Seoul Metropolitan Government Boramae Medical Center (N = 15 220).
Study outcome
The study outcomes included composite events of chronic KRT or death within 1 or 3 years after surgery. In addition to the in-hospital electronic medical records, we reviewed data provided by the Statistics Korea Department to include nationwide events.
AKI was defined as following the KDIGO 2012 guideline within postoperative 7 days (either increase in serum creatinine by ≥0.3 mg/dL within 48 hours or increase in serum creatinine to ≥1.5 times baseline) [11]. Among the defined AKI cases, patients who were diagnosed with stage ≥2 AKI or had critical events within 90 days after surgery (started renal replacement therapy or death) were further classified as having critical AKI.
Data collection
An electronic medical record review was performed to include the information on SPARK variables: age, sex, baseline eGFR measured within 3 months before surgery, expected surgery duration, whether the operation was an emergency surgery or a scheduled case, underlying history of diabetes mellitus, renin–angiotensin–aldosterone system blockade usage, baseline hypoalbuminemia (<3.5 g/dL), anemia (hemoglobin <12 g/dL for females, 13 g/dL for males), and hyponatremia (<135 mEq/L).
Additionally, we collected the following information to screen the variables that could be added to the mid-to-long-term risk prediction models: baseline comorbidities (history of coronary artery disease, cerebrovascular disease, and malignancy) and laboratory findings (e.g. potassium, total cholesterol).
Statistical analysis
For the development analysis of the mid-to-long-term risk prediction model, we first assessed the discrimination power (C-index) using the Cox proportional hazard model of the original SPARK score, variables and coefficient, as the original SPARK classification included some information on dialysis or mortality as a previously defined critical AKI outcome. In this process, we evaluated whether the SPARK model has mid-to-long-term risk predictive power beyond prediction immediately after surgery and evaluated the necessity for a new follow-up model to improve mid-to-long-term outcome risk prediction.
Next, as our mid-to-long-term risk prediction model was to be applied at the time of follow-up kidney function measurements, the main intended model was constructed with the addition of postoperative kidney function, including AKI stage according to the KDIGO guidelines (no PO-AKI, stage 1, stage 2, and stage 3). Finally, we screened the additive value regarding the predictive performance of including the collected variables (e.g. malignancy history) one at a time. We intended to limit the number of additional variables required for simplicity and user-friendliness. The C-index and its corresponding 95% confidence interval (CI) were obtained utilizing the ‘survcomp’ package.
The model performances were compared in different levels of cohorts. The first level included all available cases. The second level included cases with SPARK B class (SPARK score ≥20), because we recommend follow-up creatinine measurements from SPARK B class and higher due to potential risk of PO-AKI. [9] This second-level population would be the main study of interest because kidney function follow-up information would be available when using the SPARK classification, as SPARK A (SPARK score <20) was considered a low-risk group where follow-up serum creatinine measurement was not necessary. The third level included those who developed PO-AKI to test the model performance in the high-risk patient group.
The comparison for the predictive performance was performed by testing continuous net reclassification improvement (cNRI) between the Cox proportional hazard models, using the package ‘nricens’ in R to deal with censored survival data. The 95% confidence intervals for the cNRI values were calculated using thousand bootstrapping. As a supplementary analysis, we also validated the performance of the previous SPARK score for PO-AKI and critical AKI (AKI stage 2 or higher, dialysis, or mortality within 90 days of surgery) as a validation analysis of the SPARK classification. We calculated the area under the curve (AUC) values of the receiver operating characteristic (ROC) curves for each surgical department for each cohort. Statistical significance was set at P < 0.05, and R software (version 4.3.1) was used.
RESULTS
Characteristics of the study population
The baseline characteristics of the study cohort are presented in Table 1. The median age was 59, 61, 57, 60, and 64 years in the development and the four validation cohorts, respectively. Male sex accounted for 44%–60% of the cases, while the prevalence of diabetes ranged from 12% to 19%. Less than 10% of the cases were emergency operations. Median eGFR values were from 92 to 95 mL/min/1.73 m2 in the study cohorts. The validation cohorts of Seoul National University Bundang Hospital had <10% of dipstick albuminuria, whereas other cohorts showed higher prevalences.
Baseline characteristics of development and validation cohort.
| Validation | ||||||
|---|---|---|---|---|---|---|
| Development (N = 33 636) | Temporal (N = 33 944) | SNUBH P1 (N = 11 309) | SNUBH P2 (N = 44 703) | SMG-BMC (N = 15 220) | Total (N = 138 812) | |
| Age | 59.0 [48.0; 69.0] | 61.0 [50.0; 70.0] | 57.0 [45.0; 68.0] | 60.0 [48.0; 70.0] | 64.0 [52.0; 72.0] | 60.0 [49.0; 70.0] |
| Sex, male (%) | 14 672 (43.6%) | 16 289 (48.0%) | 5947 (52.6%) | 24 197 (54.1%) | 9081 (59.7%) | 70 186 (50.6%) |
| Diabetes mellitus | 3881 (11.5%) | 4641 (13.7%) | 1493 (13.2%) | 6750 (15.1%) | 2837 (18.6%) | 19 602 (14.1%) |
| Hypertension | 8315 (24.7%) | 8078 (23.8%) | 3872 (34.2%) | 14 963 (33.5%) | 6028 (39.6%) | 41 256 (29.7%) |
| Coronary artery disease | 994 (3.0%) | 1496 (4.4%) | 262 (2.3%) | 1537 (3.4%) | 777 (5.1%) | 5066 (3.6%) |
| Malignancy | 14 641 (43.5%) | 13 150 (38.7%) | 3130 (27.7%) | 15 002 (33.6%) | 3987 (26.2%) | 49 910 (36.0%) |
| RAS blocker usage | 2269 (6.7%) | 2639 (7.8%) | 279 (2.5%) | 1251 (2.8%) | 1982 (13.0%) | 8420 (6.1%) |
| Operation duration | 155 [105; 225] | 155.0 [99.0; 230.0] | 128.0 [90.0; 193.0] | 134.0 [90.0; 200.0] | 110.0 [84.0; 163.0] | 140.0 [94.0; 210.0] |
| Emergency operation | 2037 (6.1%) | 2966 (8.7%) | 195 (1.7%) | 609 (1.4%) | 358 (2.4%) | 6165 (4.4%) |
| Laboratory findings | ||||||
| eGFR (mL/min per 1.73 m2) | 94.1 [83.5; 104.4] | 92.0 [80.5; 102.1] | 93.4 [81.4; 104.4] | 94.8 [83.9; 105.1] | 92.5 [81.2; 103.1] | 93.6 [82.5; 104.0] |
| Hemoglobin (g/dL) | 13.3 [12.0; 14.6] | 13.2 [12.0; 14.3] | 13.0 [11.6; 14.3] | 13.1 [11.7; 14.3] | 12.6 [11.3; 13.7] | 13.1 [11.8; 14.3] |
| Anemia [<12 g/dL (female), 13 g/dL (male)] | 8123 (24.1%) | 8254 (24.3%) | 3476 (30.7%) | 12 643 (28.3%) | 5559 (36.5%) | 38 055 (27.4%) |
| Sodium (mEq/L) | 141 [139; 142] | 141 [139; 142] | 140 [139; 142] | 141.0 [139; 142] | 139 [138; 141] | 141 [139; 142] |
| Hyponatremia (<135 mEq/L) | 1083 (3.2%) | 893 (2.6%) | 323 (2.9%) | 816 (1.8%) | 814 (5.3%) | 3929 (2.8%) |
| Albumin (g/dL) | 4.2 [3.8; 4.4] | 4.2 [3.9; 4.4] | 4.2 [ 3.7; 4.5] | 4.1 [ 3.6; 4.4] | 4.0 [3.6; 4.3] | 4.1 [3.8; 4.4] |
| Hypoalbuminemia (<3.5 g/dL) | 4306 (12.8%) | 2666 (7.9%) | 2120 (18.7%) | 8531 (19.1%) | 2568 (16.9%) | 20 191 (14.5%) |
| Dipstick albuminuria (≥1+) | 3567 (10.6%) | 4279 (12.6%) | 734 (6.5%) | 2960 (6.6%) | 1660 (10.9%) | 13 200 (9.5%) |
| Maximal creatinine after surgery (mg/dL) | 0.9 [0.8; 1.1] | 0.8 [0.6; 0.9] | 0.8 [ 0.6; 0.9] | 0.7 [ 0.6; 0.9] | 0.8 [0.6; 0.9] | 0.8 [0.6; 1.0] |
| Outcomes | ||||||
| AKI | 2403 (7.1%) | 1686 (5.0%) | 424 (3.7%) | 1772 (4.0%) | 606 (4.0%) | 6891 (5.0%) |
| 1-year composite outcome | 1839 (5.5%) | 1624 (4.8%) | 294 (2.6%) | 938 (2.1%) | 423 (2.8%) | 5118 (3.7%) |
| 3-year composite outcome | 4446 (13.2%) | 3440 (10.1%) | 733 (6.5%) | 2216 (5.0%) | 893 (5.9%) | 11 728 (8.4%) |
Categorical variables are shown as n (%) and continuous variables as median [interquartile range].
SNUBH, Seoul National University Bundang Hospital; P1, Period 1 (2003–12); P2, Period 2 (2013–20); SMG-BMC, Seoul Metropolitan Government Boramae Medical Center; RAS, renin–angiotensin–system.
The incidence of AKI also differed, as the development cohort had 7% of PO-AKI cases, while the four validation cohorts had 4% or 5% of PO-AKI events. Mid-to-long term adverse events occurred in the development data for 5% and 13% of cases within 1 and 3 years, respectively. The incidences of the composite mid-to-long term adverse events were lower in the validation cohort; they were 5% in the temporal validation cohort and 2% or 3% in the other cohorts for the 1-year outcome and 10% in the temporal validation cohort and 5% or 7% in the other cohorts for the 3-year outcome.
Predictive performance of the SPARK classification
The SPARK score showed acceptable discriminative power in the development cohort (PO-AKI: AUC 0.74; critical AKI: AUC 0.78), temporal validation cohort (PO-AKI: AUC 0.72; critical AKI: AUC 0.78), validation cohort at Seoul National University Bundang Hospital Period 1 (PO-AKI: AUC 0.77; critical AKI: AUC 0.79), Period 2 (PO-AKI: AUC 0.73; critical AKI: AUC 0.77), and Seoul Metropolitan Government Boramae Medical Center (PO-AKI: AUC 0.77; critical AKI: AUC 0.79, Supplementary Table 1). When we separated the departments, the overall performances were acceptable in the general surgery and orthopedics departments, and inferior in urologic and neurosurgery department cases, showing AUC values mostly <0.7 (Supplementary Table 2).
Mid-to-long term risk prediction model development
One year after surgery, there were 5016 deaths (3.6%) and 168 cases of KRT (0.1%), leading to a composite outcome total of 5118 (3.7%). Three years post-surgery, the numbers rose to 11 528 deaths (8.3%) and 331 KRT cases (0.2%), with composite outcomes reaching 11 728 (8.5%).
The SPARK score showed tolerable discriminative power for the 1-year or 3-year adverse outcome risks, as the C indices were mostly >0.7 in the development and validation cohorts (Table 2). However, the performance became poor when we restricted the cases to SPARK-B classes, in which measurement of follow-up creatinine is actually recommended (e.g. C-index in the development cohort of 1-year composite outcome: C-index 0.68, 95% CI 0.657–0.703), and to patients with PO-AKI events, whose risks for dialysis or mortality would actually be elevated (C-index in the development cohort of 1-year composite outcome: C-index 0.59, 95% CI 0.539–0.647).
Comparison of concordance index (confidence interval) in the mid-to-long term composite outcome prediction model of SPARK score versus SPARK variables.
| Validation cohort | |||||||
|---|---|---|---|---|---|---|---|
| Model | Population | Development cohort | Temporal | External: SNUBH P1 | External: SNUBH P2 | External : SMG-BMC | |
| 1-Year composite outcome | SPARK score | Total | 0.809 (0.754‒0.854) | 0.797 (0.741‒0.844) | 0.839 (0.725‒0.912) | 0.833 (0.768‒0.883) | 0.817 (0.728‒0.882) |
| SPARK class ≥B | 0.680 (0.657‒0.703) | 0.726 (0.701‒0.750) | 0.728 (0.671‒0.778) | 0.739 (0.707‒0.769) | 0.767 (0.720‒0.808) | ||
| PO-AKI | 0.594 (0.539‒0.647) | 0.679 (0.612‒0.740) | 0.713 (0.573‒0.821) | 0.683 (0.600‒0.757) | 0.707 (0.593‒0.800) | ||
| SPARK variables | Total | 0.829 (0.777‒0.871) | 0.820 (0.765‒0.864) | 0.841 (0.727‒0.913) | 0.844 (0.780‒0.892) | 0.826 (0.739‒0.889) | |
| SPARK class ≥B | 0.716 (0.693‒0.737) | 0.750 (0.726‒0.772) | 0.730 (0.674‒0.780) | 0.757 (0.726‒0.786) | 0.771 (0.725‒0.811) | ||
| PO-AKI | 0.649 (0.595‒0.700) | 0.708 (0.642‒0.765) | 0.749 (0.612‒0.849) | 0.731 (0.650‒0.799) | 0.749 (0.612‒0.849) | ||
| SPARK coefficient | Total | 0.806 (0.751‒0.851) | 0.806 (0.751‒0.852) | 0.848 (0.736‒0.918) | 0.848 (0.784‒0.895) | 0.840 (0.754‒0.899) | |
| SPARK class ≥B | 0.681 (0.658‒0.702) | 0.718 (0.693‒0.741) | 0.741 (0.685‒0.789) | 0.742 (0.711‒0.772) | 0.773 (0.727‒0.813) | ||
| PO-AKI | 0.618 (0.564‒0.670) | 0.668 (0.601‒0.728) | 0.699 (0.560‒0.810) | 0.711 (0.629‒0.781) | 0.722 (0.609‒0.812) | ||
| 3-Year composite outcome | SPARK score | Total | 0.777 (0.739‒0.810) | 0.779 (0.734‒0.818) | 0.772 (0.697‒0.834) | 0.783 (0.734‒0.824) | 0.805 (0.741‒0.857) |
| SPARK class ≥B | 0.645 (0.630‒0.661) | 0.691 (0.672‒0.709) | 0.700 (0.663‒0.735) | 0.707 (0.683‒0.729) | 0.746 (0.711‒0.779) | ||
| PO-AKI | 0.581 (0.539‒0.621) | 0.668 (0.612‒0.719) | 0.713 (0.573‒0.821) | 0.683 (0.600‒0.757) | 0.707 (0.593‒0.800) | ||
| SPARK variables | Total | 0.782 (0.745‒0.815) | 0.790 (0.746‒0.828) | 0.777 (0.702‒0.837) | 0.795 (0.747‒0.835) | 0.815 (0.752‒0.865) | |
| SPARK class ≥B | 0.675 (0.659‒0.690) | 0.711 (0.692‒0.729) | 0.703 (0.666‒0.738) | 0.725 (0.702‒0.747) | 0.750 (0.715‒0.782) | ||
| PO-AKI | 0.615 (0.574‒0.655) | 0.687 (0.633‒0.737) | 0.747 (0.611‒0.848) | 0.726 (0.645‒0.795) | 0.741 (0.629‒0.828) | ||
| SPARK coefficient | Total | 0.783 (0.746‒0.816) | 0.799 (0.757‒0.836) | 0.788 (0.715‒0.847) | 0.805 (0.759‒0.845) | 0.832 (0.771‒0.879) | |
| SPARK class ≥B | 0.658 (0.643‒0.673) | 0.690 (0.671‒0.708) | 0.716 (0.680‒0.750) | 0.719 (0.696‒0.740) | 0.755 (0.721‒0.787) | ||
| PO-AKI | 0.603 (0.562‒0.643) | 0.665 (0.610‒0.716) | 0.699 (0.560‒0.810) | 0.711 (0.629‒0.781) | 0.722 (0.609‒0.812) | ||
SNUBH P1, Seoul National University Bundang Hospital Period 1 (2005–12); SNUBH P2, Period 2 (2013–20); SMG-BMC, Seoul Metropolitan Government Boramae Medical Center.
When we eased the scores and re-included the SPARK variables in the Cox proportional hazard model (Supplementary Table 3), the model performance significantly improved not only in the development data but also in the validation results, particularly in the SPARK-B classes of those with PO-AKI events (Table 2). Moreover, the recalibration model from SPARK variables performed better than the Cox regression model from the SPARK coefficient (Table 2 and Supplementary Table 5). The cNRI analysis results also indicated that the model including SPARK variables but re-calculating the effect sizes by Cox regression outperformed the predictive performance for 1-year and 3-year composite adverse event risks (Fig. 2).
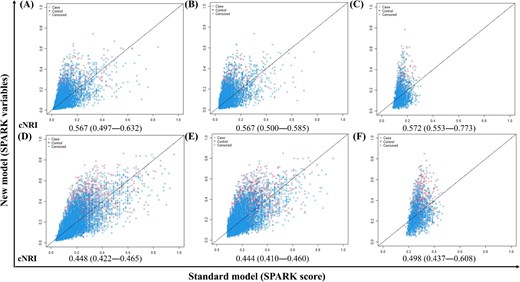
cNRI results comparing mid-to-long term prediction between SPARK variables and SPARK score in total population and high-risk subgroups. (A–C) Predicting 1-year composite outcome. (D–F) Predicting 3-year composite outcomes. (A and D) Total population. (B and E) Patients with SPARK class ≥B. (C and G) Patients with postoperative acute kidney injury events. The x-axis of each plot represents the model performance of the SPARK score and the y-axis represents the model performance of the SPARK variables.
Next, when we included postoperative kidney function (classified as AKI stage) and a single additional variable (Supplementary Table 4), the predictive model that included a history of malignancy showed the highest C indices in the analyses (Table 3). The C indices towards 1-year adverse outcome risk in the development cohorts were 0.86 (95% CI 0.809‒0.897) for all cases, 0.74 (95% CI 0.719‒0.762) for the SPARK-B cases, and 0.69 (95% CI 0.635‒0.736) for the PO-AKI cases. Moreover, the C indices for 1-year adverse outcome risk prediction in the validation cohorts were also acceptable, ranging from 0.863 to 0.882 for all cases, 0.751 to 0.819 for the SPARK-B cases, and 0.705 to 0.734 for the PO-AKI cases.
C-indices of the best-performing model for predicting mid-to long-term composite outcome with SPARK variables, postoperative AKI stages and history of malignancy.
| Validation cohort | ||||||
|---|---|---|---|---|---|---|
| Composite outcome | Population | Development cohort | Temporal | SNUBH P1 | SNUBH P2 | SMG-BMC |
| 1-year | Total | 0.859 (0.809‒0.897) | 0.882 (0.834‒0.917) | 0.865 (0.756‒0.930) | 0.878 (0.818‒0.920) | 0.863 (0.781‒0.918) |
| SPARK class ≥B | 0.741 (0.719‒0.762) | 0.768 (0.745‒0.790) | 0.751 (0.696‒0.799) | 0.759 (0.728‒0.789) | 0.819 (0.777‒0.856) | |
| PO-AKI | 0.688 (0.635‒0.736) | 0.705 (0.640‒0.763) | 0.715 (0.577‒0.822) | 0.707 (0.625‒0.778) | 0.734 (0.622‒0.822) | |
| 3-year | Total | 0.821 (0.786‒0.851) | 0.852 (0.813‒0.884) | 0.798 (0.725‒0.855) | 0.829 (0.784‒0.866) | 0.848 (0.788‒0.892) |
| SPARK class ≥B | 0.726 (0.711‒0.740) | 0.746 (0.728‒0.763) | 0.692 (0.655‒0.727) | 0.700 (0.677‒0.723) | 0.798 (0.766‒0.827) | |
| PO-AKI | 0.681 (0.641‒0.718) | 0.704 (0.650‒0.753) | 0.661 (0.562‒0.747) | 0.691 (0.625‒0.749) | 0.733 (0.640‒0.810) | |
SNUBH, Seoul National University Bundang Hospital; SMG-BMC, Seoul Metropolitan Government Boramae Medical Center.
The results were similar for the 3-year composite outcome, and the C indices were mostly >0.7 in the development and validation cohorts for all three levels of patients (development cohort, C-index, 95% CI 0.82, 0.786–0.851 for total, 0.73, 0.711–0.740 for SPARK-B class, and 0.68, 0.641–0.718 for actual PO-AKI cases). The performance of the final model was also supported by the cNRI analysis (Fig. 3), which indicated that the model including SPARK variables, postoperative AKI stage, and malignancy history showed better discriminative power than the previous model using only SPARK variables. Contrary to our expectations, when we replaced expected surgery time with actual surgery time among the SPARK variables, the model did not improve (Supplementary Table 4).
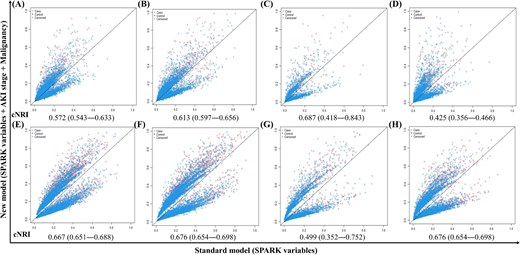
cNRI results comparing mid-to-long term prediction between SPARK and recalibrated model with updated postoperative AKI stage and history of malignancy in the development and validation cohorts. (A–D) predicting 1-year composite outcome. (E–H) Predicting 3-year composite outcomes. (A and E) Development cohort. (B and F) Validation cohort, Seoul National University Bundang Hospital. (C and G) Validation cohort, Seoul Metropolitan Government Boramae Medical Center. (D and H) Validation cohort, temporal. The x-axis of each plot is a model from SPARK variables, and the y-axis is the performance of the model with added AKI stage and history of malignancy.
Model performance in each surgical department
When we tested the performance of the final mid-to-long-term risk prediction model in each department, the C indices ranged from 0.729 to 0.848 for the 1-year outcome and from 0.690 to 0.814 for the 3-year outcome in the development cohort (Table 4). The performances were similar in the four validation cohorts, and the overall predictive power towards mid-to-long-term adverse events was not low in the neurosurgery or urology departments, which is different from the results of the validation analysis of the SPARK score for PO-AKI or critical AKI risks.
C-indices of newly developed mid-to-long term risk prediction model varied by department.
| Validation cohort | ||||||
|---|---|---|---|---|---|---|
| Composite outcomes | Department | Development cohort | Temporal | SNUBH P1 | SNUBH P2 | SMG-BMC |
| 1-year | GS | 0.729 (0.703–0.753) | 0.757 (0.723–0.787) | 0.813 (0.747–0.865) | 0.787 (0.748–0.822) | 0.858 (0.802–0.901) |
| OS | 0.848 (0.797–0.888) | 0.880 (0.833–0.916) | 0.873 (0.766–0.935) | 0.880 (0.820–0.921) | 0.864 (0.782–0.918) | |
| OBGY | 0.808 (0.698–0.885) | 0.784 (0.683–0.860) | 0.671 (0.446–0.838) | 0.809 (0.658–0.903) | 0.851 (0.532–0.966) | |
| NS | 0.812 (0.725–0.876) | 0.800 (0.705–0.869) | 0.698 (0.505–0.840) | 0.805 (0.699–0.880) | 0.811 (0.661–0.904) | |
| UR | 0.795 (0.730–0.847) | 0.811 (0.766–0.849) | 0.763 (0.537–0.900) | 0.739 (0.644–0.816) | 0.805 (0.678–0.890) | |
| 3-year | GS | 0.690 (0.673–0.707) | 0.716 (0.691–0.739) | 0.724 (0.678–0.765) | 0.697 (0.668–0.726) | 0.816 (0.770–0.854) |
| OS | 0.814 (0.779–0.844) | 0.848 (0.809–0.880) | 0.797 (0.725–0.855) | 0.826 (0.781–0.863) | 0.844 (0.784–0.889) | |
| OBGY | 0.784 (0.705–0.847) | 0.772 (0.701–0.830) | 0.757 (0.609–0.862) | 0.747 (0.646–0.826) | 0.873 (0.712–0.951) | |
| NS | 0.753 (0.696–0.803) | 0.812 (0.725–0.876) | 0.587 (0.474–0.691) | 0.691 (0.619–0.755) | 0.765 (0.665–0.842) | |
| UR | 0.764 (0.714–0.807) | 0.795 (0.730–0.847) | 0.779 (0.623–0.883) | 0.739 (0.664–0.802) | 0.801 (0.705–0.872) | |
SNUBH P1, Seoul National University Bundang Hospital Period 1; SNUBH P2, Seoul National University Bundang Hospital Period 2; SMG-BMC, Seoul Metropolitan Government Boramae Medical Center; GS, general surgery; OS, orthopedic surgery; OBGY, obstetrics and gynecology; NS, neurosurgery; UR, urology
Online postoperative risk prediction based on kidney function-related parameters
Based on these findings, we constructed an online postoperative risk prediction system based on kidney function-related parameters. In the online calculator (Fig. 4, https://snuhnephrology.github.io/postop/), the user can input 11 SPARK variables to first estimate PO-AKI and critical AKI risks before performing major non-cardiac surgery. The calculator also provides mid-to-long-term risk for dialysis or mortality within 1-year and 3-year outcomes stratified by percentile values in the development analysis. The highest tertile was designated as the high-risk group, the lowest tertile as the low-risk group, and the rest were classified as the moderate-risk group. The risk calculator updates the results when a user inputs postoperative follow-up kidney function and history of malignancy, which provides a more accurate estimation of the risks of dialysis or mortality within 1 or 3 years from major non-cardiac surgery.
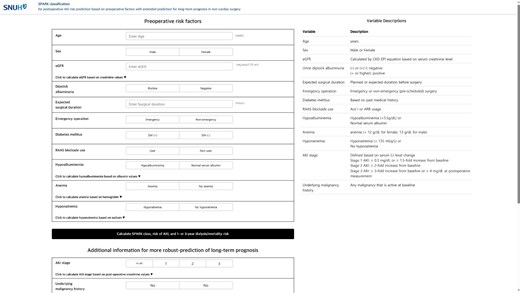
The online calculator of SPARK and mid-to-long term risk predictor.
DISCUSSION
Using our pre-existing SPARK model, we derived a prediction model for the mid-to-long-term risk of dialysis or mortality based on kidney function and associated clinical information for patients undergoing major non-cardiac surgery. The model showed acceptable performance in the development and four external validation cohorts. By incorporating the model into our previously suggested SPARK classification, we constructed an online prediction system that can be used before and after non-cardiac surgeries to comprehensively estimate PO-AKI and associated mid-to-long-term risks with easily accessible clinical information (https://snuhnephrology.github.io/postop/).
Estimating the risk of PO-AKI is an important subject in modern medicine [2, 7, 8, 16]. Because PO-AKI has a critical impact on patient prognosis, such prediction strategies have important value in consulting patients and determining the risk–benefit of surgery [1]. Regression models, machine-learning algorithms, and deep-learning models have been used to develop PO-AKI risk prediction models [9–13]. However, approaches aiming at simplistic calculations have particular value because the risk estimation can be easily applied to clinical practice even where the medical environment is different [17]. In our previous study, we developed the SPARK classification and made efforts to simplify the calculation methodology to avoid over-fitting and to enhance usability [9]. The SPARK score showed acceptable performance in the temporal and external validation analysis, which was performed here.
In addition, we focused on the mid-to-long risks because the evaluation of kidney-related patient prognosis after surgery has important clinical value [18–23]. Previous studies have demonstrated that a longer duration of PO-AKI and higher PO-AKI stage are associated with increased long-term mortality [24, 25] and worse kidney outcomes [24, 26, 27]. However, unlike the prediction of PO-AKI, there is a scarcity of models available to predict the mid-to-long-term consequences of PO-AKI. Furthermore, existing models have limitations, such as short prediction durations of 1–3 months [26, 28], making it challenging to anticipate long-term outcomes or being restricted to specific surgical procedures [27]. In the mid-to-long term, AKI impacts overall health, extending beyond the specific kidney outcomes represented by KRT. The relatively low incidence of KRT may be underestimated due to the competing risk of death. As a result, recent nephrology literature often adopts a renal composite outcome termed major adverse kidney event (MAKE) [29, 30]. Despite the predominance of death over KRT in our composite outcome, our study employs the MAKE concept from the original SPARK study of critical PO-AKI prediction, encompassing both mortality and KRT.
In this respect, our present attempt to forecast mid- to long-term consequences by utilizing the SPARK score, initially designed for predicting PO-AKI occurrence, holds significant importance. Although the SPARK score showed some usefulness, the remaining issue with the SPARK score for predicting mid-to-long-term risk was that the performance was relatively poor in those with a high risk of PO-AKI (SPARK class ≥B) or in those who developed PO-AKI. Therefore, we reconstructed a prediction model based on survival analysis, and with the simple addition of postoperative kidney function and malignancy history, we developed a mid-to-long-term risk prediction model that can be used after major non-cardiac surgery. We again limited the number of variables for simplicity, and the comprehensive system was uploaded to the web interface.
We mainly targeted the easy use of the calculator for pre- or postoperative consultation, and, without manual calculation, the online system can provide the estimation of PO-AKI risk, critical AKI risk, and mid-to-long- and long-term risks for dialysis or mortality based on kidney function-related information. Therefore, healthcare providers may estimate the risks before major non-cardiac surgery and perform kidney function follow-up and thorough monitoring based on these findings (Fig. 4). In addition, after the evaluation of postoperative kidney function, risk calculations can be updated to estimate the mid-to-long-term risk of dialysis or mortality. Based on the findings, clinicians can schedule follow-up visits, evaluate modifiable risk factors, and consult with patients. We consider the main strength of the current model to be that it is a user-centered prediction model that considers which aspects of the practice the user can use. Because the required information is routinely collected before performing major surgeries, our prediction system can be easily used without additional data collection. Therefore, we suggest that the online calculator would be an easily accessible, evidence-based evaluation strategy for surgery-related kidney risks developed from large-scale cohorts.
This study has certain limitations. First, although large-scale external validation was performed, the validation cohorts were included from the same nation with similar ethnic backgrounds. Whether the calculator exhibits acceptable performance should be additionally validated in future studies. Second, the number of surgery departments was limited; therefore, some non-cardiac surgery departments were not included. However, in contrast to our previous SPARK classification, the overall performance of the mid-to-long term prediction model was not poor in specific departments. Thus, the usage of the model may be expanded to other fields after additional validation. Third, the targeted period to define mid-to-long-term outcomes was limited to a maximum of 3 years, and whether the current model can be used for outcomes over a longer period is not certain. Fourthly, in developing the model based on straightforward and clearly defined variables, we could not consider variables that significantly impact the occurrence of PO-AKI and mid-to-long-term outcomes but are relatively difficult to verify and standardize (e.g. fluid balance, vasoactive agent usage). Finally, artificial intelligence-based models may provide higher predictive performance for clinical outcomes. On the other hand, the clinical utility of a model that can be easily adopted without extensive data extraction should be considered, which is a strength of our study.
In conclusion, the constructed comprehensive risk prediction system for PO-AKI, critical AKI, and mid-to-long-term risk for dialysis or mortality may be used in clinical practice for major non-cardiac surgeries. Further efforts to validate and improve the prediction strategies for surgery-related kidney complications may improve patient prognosis and facilitate the appropriate delivery of medical resources.
FUNDING
This research was supported by a grant from the Korea Health Technology R&D Project through the Korea Health Industry Development Institute (KHIDI), funded by the Ministry of Health & Welfare, Republic of Korea (grant number: HI21C1138). The funder had no role in the study, and the study was performed independently by the authors.
AUTHORS’ CONTRIBUTIONS
Conception of the study design, overall supervision of the project, and decision to publish the findings: H.L.; data collection: S.J.K., J.H.L., J.W.R., and J.M.C.; data quality control and coordination: S.Y. and K.K.; data analysis: S.P. and Soie K.; consultation on statistical analysis: M.P.; supporting data interpretation: H.J.Y., D.K.K., K.W.J., and Y.S.K.; webpage design: C.S.; and writing and editing of the overall manuscript: Soie K., S.P., and H.L. Each author contributed important intellectual content during manuscript drafting or revision, agreed to be personally accountable for the individual's own contributions, and to ensure that questions pertaining to the accuracy or integrity of any portion of the work, even one in which the author was not directly involved, are appropriately investigated and resolved, including with documentation in the literature, if appropriate.
DATA AVAILABILITY STATEMENT
Data supporting the findings of this study are available upon request from the corresponding author. The data are not publicly available because of privacy and ethical restrictions.
CONFLICT OF INTEREST STATEMENT
None of the authors declare disclosures.
REFERENCES
Author notes
Sehoon Park Co-first author


Comments