


ABSTRACT
Anti–glomerular basement membrane (anti-GBM) disease is a rare and life-threatening form of small vessel vasculitis that primarily affects the kidneys and lungs. In rare cases, it occurs with membranous nephropathy (MN). This study aimed to investigate the clinical manifestations, pathological features, prognosis and predictors of anti-GBM disease with MN.
We enrolled 24 patients with combined anti-GBM disease and MN, and 69 patients with classic anti-GBM disease (without MN). We compared the clinical and pathological differences, as well as the prognoses between the two groups and attempted to identify predictors of anti-GBM disease combined with MN.
A greater proportion of patients with combined disease were male, had a history of smoking, and had nephrotic syndrome (NS). Compared with patients with classic anti-GBM disease, those with anti-GBM disease with MN presented improved renal function, higher hemoglobin and serum C3 levels, and significantly improved renal outcomes (P < .05). In 16 out of 24 double-positive patients, a lower proportion of glomerular crescents and a higher rate of immunoglobulin G4 positivity were observed compared with only 20 of the 69 patients with classic anti-GBM disease confirmed by renal biopsy (P < .05). Furthermore, smoking status, hemoglobin levels and low-density lipoprotein levels were identified as factors associated with the development of anti-GBM combined with MN, potentially serving as predictors.
This study provides insights into the distinct clinical and pathological characteristics of anti-GBM disease with MN. The identification of predictors may contribute to the early recognition and management of these patients.
What was known:
Anti–glomerular basement membrane (anti-GBM) disease combined with membranous nephropathy (MN) presented with clinical and pathological characteristics that differ from classic anti-GBM disease, and demonstrate improved renal outcomes.
Majority of anti-GBM patients associated with MN patients tested in the medical literature were negative for anti-phospholipase A2 receptor (PLA2R) antibodies.
In primary MN, predominant immunoglobulin G4 (IgG4) deposition along the glomerular capillary wall has been observed, and classic anti-GBM disease is characterized by predominant binding of IgG1 and IgG3 to the GBM.
This study adds:
Patients with combined disease had a higher proportion of males, smoking history and nephritic syndrome, and better renal outcomes.
In patients combined anti-GBM with MN, the main deposits consisted of IgG1 and IgG4, and the levels of IgG4 were significantly higher in these patients compared with those with classic anti-GBM.
Smoking status, hemoglobin and low-density lipoprotein levels may be predictors of anti-GBM diseases combined with MN.
Potential impact:
This study provides insights into the clinical and pathological characteristics of anti-GBM disease with MN.
INTRODUCTION
Anti–glomerular basement membrane (anti-GBM) disease is an autoimmune disorder disease that is clinically characterized by the production of anti-GBM autoantibodies, rapidly progressive glomerulonephritis, and a high risk for pulmonary hemorrhage [1]. The diagnosis is usually confirmed by the detection of anti-GBM circulating antibodies, the pathogenesis of which has been fully demonstrated. These antibodies primarily target non-collagenous domain 1 of the α3 chain of type IV collagen [(α3(IV)NC1] [1]. If not promptly recognized and treated, patients with anti-GBM disease have a poor prognosis and many eventually develop end-stage renal disease, which can even be life-threatening [2]. Therefore, early recognition and appropriate management are crucial for improving outcomes in patients with anti-GBM disease.
Membranous nephropathy (MN) is characterized by the presence of subepithelial immune complexes and subsequent complement activation, which results in basement membrane damage and proteinuria. It accounts for approximately 30% of cases of NS in adults. Approximately 20% of MN cases are secondary to chronic infection, systemic diseases, malignancies or exposure to toxic medications [3]. M-type phospholipase A2 receptor (PLA2R) antibodies are specific to MN and are found in approximately 70% of adult MN patients [4]. In MN, crescents are not typically present. Their presence often suggests a secondary form of the disease or the coincidence of another disease, such as anti-neutrophil cytoplasmic antibody (ANCA)-associated vasculitis or anti-GBM disease [5].
The combination of anti-GBM disease and MN has been well documented, with the first report dating back to 1974 [6]. Previous studies have demonstrated that patients with this combined disease present with clinical and pathological characteristics that differ from those of classic anti-GBM disease and demonstrate improved renal outcomes [7, 8]. More recently, patients with this combined disease have been classified into a unique subgroup of patients with anti-GBM diseases [9]. However, it is crucial to acknowledge that previous studies on anti-GBM disease combined with MN have been limited to small case series [10, 11] and have limited sample sizes [7, 8]. A recent study conducted at the Mayo Clinic focused on the clinicopathologic characteristics and outcomes of 28 patients with this dual glomerulopathy, but it lacked comparative analysis [12]. Therefore, further investigations involving large-scale clinical data are necessary. Moreover, in certain critical conditions, such as those with a high risk of bleeding due to rapidly deteriorating renal function, a lower proportion of kidney biopsies may be performed in patients with anti-GBM disease. Therefore, it is crucial to identify the predictors of anti-GBM disease associated with MN for prognostic assessment. The aim of this study was to investigate the clinical and pathological characteristics of patients with anti-GBM with MN and to identify predictors of this unique combination.
MATERIALS AND METHODS
Study population
A total of 130 hospitalized patients who tested positive for circulating anti-GBM antibodies and kidney damage were identified for inclusion. This study was conducted at the Department of Nephrology, the First Affiliated Hospital of Zhengzhou University, between September 2016 and May 2022. Among the patients identified, 37 with positive ANCA serology data were excluded. Therefore, a total of 93 patients with anti-GBM disease were enrolled in this study. The details of the recruitment process are illustrated in Fig. 1. All included patients were 18 years old or older.
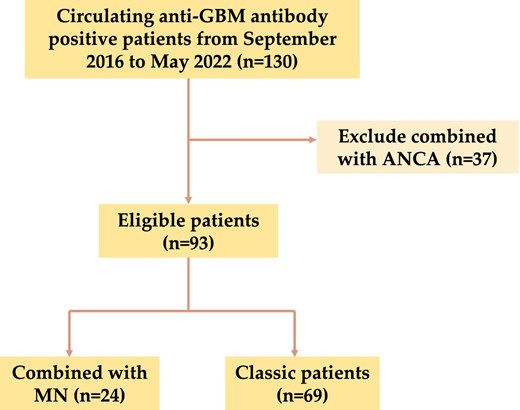
Patient recruitment flowchart.
Study grouping
To investigate the association between anti-GBM disease and MN, the patients were divided into two groups based on the presence of MN. Among them, 24 patients (25.8%) were positive for both anti-GBM and MN disease. Of the 24 patients, 19 underwent renal biopsy and were diagnosed with MN, and the remaining 5 patients were serum anti-PLA2R positive (Supplementary data, Table S1). Demographic, clinical, laboratory and pathological information was collected prior to the initiation of immunosuppressive therapy or plasmapheresis. Patients were followed from presentation until the last clinical encounter, which occurred prior to May 2023. Follow-up information was obtained through medical record reviews and telephone surveys. This retrospective study conformed to the Declaration of Helsinki. The Ethics Committee of the First Affiliated Hospital of Zhengzhou University approved the research and waived informed consent (No. 2019-KY-361).
Definition
Anti-GBM disease was characterized by crescentic glomerulonephritis with linear immunofluorescence staining for immunoglobulin G (IgG) along the GBM or positive circulating anti-GBM antibodies combined with renal damage at diagnosis. MN was defined by the presence of subepithelial electron-dense immune complex–type deposits or positive serum anti-PLA2R antibodies combined with renal damage. Anti-PLA2R antibodies were detected via enzyme-linked immunosorbent assay (ELISA). Positive serology was defined as an ELISA titer ≥14 RU/mL. Regarding renal biopsy data, crescentic glomerulonephritis was defined as large crescent formations in more than 50% of the glomeruli. The infiltration of interstitial inflammatory cells was graded as 0 for mild and 1 for diffuse, whereas tubular atrophy was categorized as >25% and ≤25%. The intensity of immunofluorescence staining for immunoglobulin, complement and target antigens was semiquantitatively scored into five grades (–, ±, +, ++ and +++). Initial dialysis was defined as the patient requiring hemodialysis at the time of first hospital admission for the diagnosis of anti-GBM disease. Renal survival was defined as not requiring renal replacement therapy or kidney transplantation. The types of medicine in “steroid therapy” refer to glucocorticoids.
Statistical analysis
Normally distributed data are presented as the means ± standard deviation, whereas nonnormally distributed data are presented as medians and quartiles. A t-test was applied to assess differences in normally distributed data. The Kruskal–Wallis test or Mann–Whitney U test was employed for nonnormally distributed data. Fisher's exact test was used for comparisons involving qualitative variables. Renal function outcomes were analyzed using Kaplan–Meier survival curves and evaluated with log-rank tests.
Univariate and multivariate logistic regression analyses were performed to identify independent predictors of anti-GBM disease with MN based on relevant clinical features and statistically significant variables.
All statistical analyses were performed using SPSS software, version 26.0 (IBM, Inc., USA), and R software, version 4.3.0. Statistical significance was defined as P < .05.
RESULTS
Baseline characteristics and treatment of anti-GBM disease patients with or without MN
A total of 24 patients with both anti-GBM disease and MN, and 69 patients with classic anti-GBM disease were enrolled in this study. Among the 24 patients with anti-GBM and MN, the median age at presentation was 50.88 (range 18–75) years, and included 20 males and 4 females. The age distribution of patients with anti-GBM disease was bimodal (<30 years old, ≥60 years old), while the age distribution of patients with combined anti-GBM disease with MN was similar to that of MN patients (peak onset at 40–60 years old) (Fig. 2).
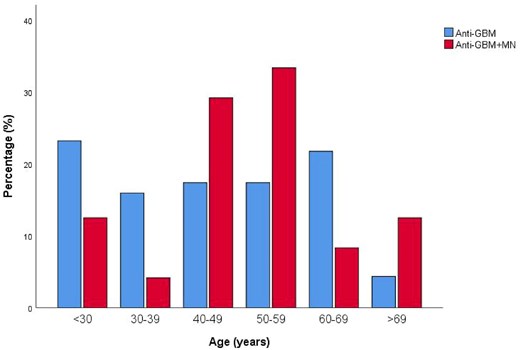
Age distribution of patients combined anti-GBM disease with and without MN at presentation.
Compared with patients with classic anti-GBM disease, the 24 double-positive patients presented significantly lower serum creatinine levels [439 (276.5, 749) vs 674.4 (412.8, 962) μmol/L, P = .024] and lower serum albumin levels [25.8 (23.6, 28.98) vs 29.7 (27.15, 33.05) g/L, P = .001] at diagnosis. There was a greater proportion of males [83.3% (20/24) vs 46.4% (30/69), P = .002], individuals who smoked [41.7% (10/24) vs 10.1% (7/69), P = .001], and individuals with NS [50% (12/24) vs 15.9% (11/69), P = .001] in anti-GBM disease with MN. Furthermore, double-positive patients presented higher levels of hemoglobin (103.84 ± 17.8 vs 84.26 ± 15.83 g/L, P < .001), estimated glomerular filtration rates (eGFR) [13.96 (6.91, 20.57) vs 6.98 (4.08, 11.44) mL/min/1.73 m2, P = .005], total cholesterol levels (4.83 ± 1.30 vs 3.95 ± 0.93 mmol/L, P = .005), low-density lipoprotein (LDL) levels [3.26 (2.45, 4.4) vs 2.25 (1.86, 2.83) mmol/L, P < .001] and serum C3 (1.34 ± 0.33 vs 1.12 ± 0.25 g/L, P = .001). The group of double-positive patients had higher levels of urinary protein excretion [3.78 (2.74, 6.73) vs 2.41 (1.03, 5.39) g/24 h, P = .066], and a lower proportion of oliguria/anuria [16.7% (4/24) vs 37.7% (26/69), P = .058]. However, group differences were not significant.
The positive rate of serum anti-PLA2R antibodies was 52.2% (12/23) in double-positive patients (patient 19 was diagnosed by renal biopsy without serum anti-PLA2R antibody testing, see Supplementary data, Table S1), and 0.0% (0/59) in classic anti-GBM disease. Some patients in the study were also tested for MN-associated antibody to thrombospondin domain-containing 7A (THSD7A). The positive rate of serum THSD7A was 6.25% (1/16) in double-positive patients, and 0.0% (0/31) in classic anti-GBM disease (Table 1).
Comparison of baseline clinical data and treatment between anti-GBM disease patients with or without MN.
| Variables | With MN (n = 24) | Without MN (n = 69) | P-value |
|---|---|---|---|
| Demography | |||
| Age (years) | 50.88 (42.81, 58.29) | 44.75 (30.54, 60.13) | .385 |
| Gender [male, % (n)] | 83.3 (20/24) | 46.4 (32/69) | .002 |
| Clinical feature [% (n)] | |||
| Smoking | 41.7 (10/24) | 10.1 (7/69) | .001 |
| Interstitial lung disease/alveolar hemorrhage | 0 (0/24) | 15.9 (11/69) | .086 |
| Hemoptysis | 0 (0/24) | 11.6 (8/69) | .186 |
| Presentation [% (n)] | |||
| NS | 50 (12/24) | 15.9 (11/69) | .001 |
| Oliguria/anuria | 16.7 (4/24) | 37.7 (26/69) | .058 |
| Library indexes | |||
| Hemoglobin (g/L) | 103.84 ± 17.80 | 84.26 ± 15.83 | <.001 |
| Urea nitrogen (mmol/L) | 14.5 (9.18, 25.18) | 21.2 (11.8, 29.75) | .084 |
| Serum creatinine (μmol/L) | 439 (276.5, 749) | 674.4 (412.8, 962) | .024 |
| eGFR (mL/min/1.73 m2) | 13.96 (6.91, 20.57) | 6.98 (4.08, 11.44) | .005 |
| Albumin (g/L) | 25.8 (23.6, 28.98) | 29.7 (27.15, 33.05) | .001 |
| TC (mmol/L) | 4.83 ± 1.30 | 3.95 ± 0.93 | .005 |
| LDL (mmol/L) | 3.26 (2.45, 4.4) | 2.25 (1.86, 2.83) | <.001 |
| Urinary protein (g/24 h) | 3.78 (2.74, 6.73) | 2.41 (1.03, 5.39) | .066 |
| Serum C3 (g/L) | 1.34 ± 0.33 | 1.12 ± 0.25 | .001 |
| Levels of anti-GBM antibodies (U/mL) | 626.29 ± 210.27 | 619.88 ± 272.29 | .917 |
| Serum PLA2R antibodies positive [% (n)] | 52.2 (12/23) | 0 (0/59) | |
| Serum THSD7A | 6.25(1/16) | 0(0/31) | |
| First-line therapy [% (n)] | |||
| Plasma exchange | 87.5 (21/24) | 94.2 (65/69) | .533 |
| Steroid therapy hormone | 95.8 (23/24) | 97.1 (67/69) | 1 |
| Immunosuppressant | 45.8 (11/24) | 43.5 (30/69) | .841 |
Bold values represent P < .05.
NS, nephrotic syndrome; TC, total cholesterol.
In addition, the proportions of patients receiving plasma exchange, steroid therapy or immunosuppressive therapy were not significantly different (P > .05) (Table 1).
Histological data of anti-GBM disease patients with or without MN
Out of 44 patients who underwent renal biopsy, 36 were included in this study, excluding those whose biopsy results were unavailable. Among these included patients, 16 [66.7% (16/24)] had combined disease and 20 [29.0% (20/69)] patients had classic anti-GBM disease. The pathological data were reviewed independently by two renal pathologists. All renal biopsies had crescents except for one patient with anti-GBM disease combined with MN.
Compared with the 20 patients with anti-GBM disease without MN, the 16 patients with MN presented a lower proportion of crescents [70.55% (36.03%, 82.65%) vs 89.95% (72.38%, 98.43%), P = 0.009]. The proportion of cellular crescents was lower in patients with MN, although the difference was not statistically significant (45.41% ± 31.38% vs 50.91% ± 28.35%, P > 0.05). The combined MN group also presented significantly fewer fibrous-cellular crescents [4.6% (0, 12.58%) vs 15.65% (8.33%, 26.13%), P = 0.016] and fibrous crescents [0 (0, 2.78%) vs 8.2% (0, 20.9%), P = 0.042] compared with the anti-GBM disease group without MN. There was no significant difference in the degree of renal tubulointerstitial lesions (P > .05) (Table 2).
Comparison of kidney pathological results in anti-GBM disease patients with or without MN.
| Variables | With MN (n = 16) | Without MN (n = 20) | P-value |
|---|---|---|---|
| Crescents (%) | 70.55 (36.03, 82.65) | 89.95 (72.38, 98.43) | .009 |
| Cellular | 45.41 ± 31.38 | 50.91 ± 28.35 | .584 |
| Fibrous-cellular | 4.6 (0, 12.58) | 15.65 (8.33, 26.13) | .016 |
| Fibrous | 0 (0, 2.78) | 8.2 (0, 20.9) | .042 |
| Crescent nephritis [% (n)] | 68.75 (11/16) | 100 (20/20) | .012 |
| Glomerular sclerosis [% (n)] | 50 (8/16) | 40 (8/20) | .737 |
| Tubular-interstitial damage [% (n)] | |||
| Interstitial inflammatory cell infiltration | 43.75 (7/16) | 50 (10/20) | .749 |
| Interstitial fibrosis | 56.25 (9/16) | 60 (12/20) | 1 |
| Tubular atrophy >25% | 12.5 (2/16) | 25 (5/20) | .426 |
| Immunofluorescence [% (n)] | |||
| IgG1 (≥+) | 78.6 (11/14) | 80.0 (16/20) | 1 |
| IgG2 (≥+) | 35.7 (5/14) | 70.0 (14/20) | .08 |
| IgG3 (≥+) | 28.6 (4/14) | 15.0 (3/20) | .41 |
| IgG4 (≥+) | 78.6 (11/14) | 35.0 (7/20) | .017 |
| C3 (≥+) | 75.0 (12/16) | 85.0 (17/20) | .675 |
| C4 (≥+) | 14.3 (2/14) | 15.8 (3/19) | 1 |
| PLA2R (≥+) | 62.5 (10/16) | 0 (0/14) | |
Among 34 patients included, immunofluorescence staining for the IgG subtype was performed. The proportion of patients with IgG4 positivity was significantly greater in the double-positive group than in the classic anti-GBM disease group [78.6% (11/14) vs 35.0% (7/20), P = .017]. The proportions of patients with renal C3 and C4 staining were not significantly different (Table 2). In addition, 62.5% (10/16) of patients with combined disease expressed PLA2R in the kidney, whereas it was not expressed in classic anti-GBM disease (Table 2).
Prognosis of patients with anti-GBM disease with or without MN
Follow-up data were obtained for 24 patients with anti-GBM disease combined with MN, and 69 patients with classic anti-GBM disease. The median durations of follow-up for patients with anti-GBM disease combined with MN and classic anti-GBM disease were 31 (range 0–85) months and 24 (range 0–78) months, respectively. Compared with patients with classic anti-GBM disease, a lower proportion of patients with anti-GBM disease combined with MN initially required dialysis (62.5% vs 85.5%, P = .035), and a greater proportion were able to stop dialysis after treatment (46.7% vs 16.9%, P = .036). The 1-year renal survival rates of patients with combined disease were also better than those of patients without MN [48.9% (95% CI 28%–67%) vs 27.4% (95% CI 17%–38%), P = .041] (Table 3). Kaplan–Meier curves of univariate survival analysis revealed that patients with anti-GBM combined with MN had better renal survival (P = .041) (Fig. 3), while there was no significant difference in patient survival between the two groups (P > .05).
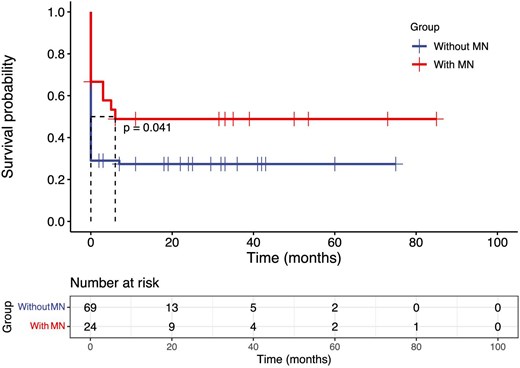
Kaplan–Meier survival analysis comparing renal survival between the anti-GBM disease with and without MN group.
Prognosis of anti-GBM patients with or without MN.
| Variables | With MN (n = 24) | Without MN (n = 69) | P-value |
|---|---|---|---|
| Dialysis requirement at diagnosis [% (n)] | 62.5 (15/24) | 85.5 (59/69) | .035 |
| Initial dialysis patients off dialysis [% (n)] | 46.7 (7/15) | 16.9 (10/59) | .036 |
| Renal survival at 1 year [% (95% CI)] | 48.9 (0.28, 0.67) | 27.4 (0.17, 0.38) | .041 |
| Patient survival at 1 year [% (95% CI)] | 90.5 (0.67, 0.98) | 85.8 (0.74, 0.92) | .544 |
Predictors of anti-GBM disease combined with MN
The significant parameters identified by univariable analysis were presented in Table 4 and were subsequently included in the multivariate logistic regression analysis. The results revealed that smoking status {odds ratio (OR) = 17.40 [95% confidence interval (CI) 3.10–97.79], P = .001}, hemoglobin level [OR = 1.11 (95% CI 1.05–1.18), P < .001] and LDL level [OR = 5.49 (95% CI 2.13–14.19), P < .001] were independent predictors of anti-GBM disease combined with MN.
Univariate and multivariate binary logistic regression analysis combined with MN predictors.
| Univariate analysis | Multivariate analysis | |||
|---|---|---|---|---|
| Parameters | OR (95% CI) | P-value | OR (95% CI) | P-value |
| Age | 1.016 (0.986–1.046) | .294 | ||
| Gender (female) | 0.173 (0.054–0.559) | .003 | ||
| Smoking | 6.327 (2.051–19.519) | .001 | 17.40 (3.10–97.79) | .001 |
| Hemoglobin | 1.073 (1.036–1.111) | <.001 | 1.11 (1.05–1.18) | <.001 |
| Serum creatinine | 0.998 (0.997–1.000) | .024 | ||
| eGFR | 1.05 (1.01–1.08) | .011 | ||
| Serum albumin | 0.841 (0.746–0.949) | .005 | ||
| TC | 2.103 (1.326–3.335) | .002 | ||
| LDL | 3.138 (1.749–5.630) | <.001 | 5.49 (2.13–14.19) | <.001 |
| NS | 5.273 (1.887–14.732) | .002 | ||
| Serum C3 | 11.52 (1.81–73.37) | .010 | ||
| Oliguria/anuria | 0.331 (0.102–1.075) | .066 | ||
Bold values represent P < .05.
TC, total cholesterol; NS, nephrotic syndrome.
DISCUSSION
This study represents the largest series to date that compares the clinical characteristics and outcomes of patients with anti-GBM disease combined with MN with those of patients with classic anti-GBM disease. Patients with combined anti-GBM and MN disease presented distinct clinical and pathological features, and different kidney prognoses than patients with classic anti-GBM disease. Notably, we identified three potential predictors (smoking status, hemoglobin levels and LDL levels) that may be associated with anti-GBM disease combined with MN.
Our study identified distinct characteristics and prognoses in patients with anti-GBM disease combined with MN. The age distribution of patients with anti-GBM and MN was similar to that of MN patients (peak onset 40–60 years), whereas the age distribution of classic anti-GBM patients (<30 years old, ≥60 years old) was bimodal, which was consistent with previous research [13]. Anti-GBM patients with MN were predominantly male with a history of smoking. These patients exhibited milder kidney impairments, lower initial dialysis requirements, and a higher incidence of NS. The proportions of oliguria/anuria and urinary protein levels were not significantly different between the two groups (P > .05). Consistent with previous studies [7, 8], anti-GBM patients with MN had a significantly better prognosis, with lower dialysis requirements at diagnosis and a higher rate of renal recovery after similar treatments and follow-up. Pathological analysis revealed a lower incidence of crescent formation, particularly cell-fibrous crescents and fibrous crescents, in anti-GBM patients with MN, potentially contributing to the improved prognosis. Previous research has suggested that higher serum C3 levels in patients with anti-GBM disease indicate a favorable renal prognosis [14]. Our study revealed that patients with MN had higher serum C3 levels, indirectly indicating a more favorable renal prognosis. Furthermore, the lower levels of epitope EB antibodies and circulating anti-a3(IV)NC1 IgG1 and IgG3 subclasses observed in patients with MN may contribute to milder kidney damage and better renal prognosis, as demonstrated in a study by Jia et al. [7].
In primary MN, prevalent IgG4 deposition along the glomerular capillary wall has been observed [15]. In contrast, classic anti-GBM disease is predominantly characterized by the binding of IgG1 and IgG3 to the GBM [13]. However, in our study, we found that the main deposits consisted of IgG1 and IgG4 in patients with combined anti-GBM disease and MN. Notably, the levels of IgG4 were significantly greater in these patients than in those with classic anti-GBM (P = .017), which is consistent with the findings of Zhang et al. [8]. This observation may be explained by the association of IgG4 with MN-related lesions, particularly the most common autoantibody, anti-PLA2R, which is dominated by IgG4 [16]. However, further experimental verification is needed to understand the existence and function of IgG4 anti-GBM antibodies.
Our research revealed that 52.2% (12/23) of double-positive patients had positive serum anti-PLA2R antibodies, and 62.5% (10/16) tested positive on renal biopsy. In contrast, the majority of patients with anti-GBM disease associated with MN patients tested in the medical literature were negative for anti-PLA2R antibodies [7, 10]. For example, Jia et al. [7] reported that no serum response to PLA2R was detected in patients with anti-GBM disease and MN, and increased PLA2R expression in glomeruli was observed in only one out of four patients. Similarly, Ahmad et al. [10] reported positive immunofluorescence staining for PLA2R in the biopsies of only one out of five tested patients. In the study by Bu et al. [12], none of the 21 tested patients presented with PLA2R staining of the glomeruli. However, our results are consistent with Zhang et al.’s results [8]. The exact reason for this difference has not yet been clarified.
The underlying mechanisms of the combined diseases are not well understood. It has been proposed that in patients with MN preceding anti-GBM disease, immune inflammation triggered by MN can damage the normal structure of the GBM and expose cryptic Goodpasture antigens. This exposure then leads to an autoimmune reaction toward the GBM [17]. In cases where anti-GBM disease precedes MN, immune complexes form as a result of the inflammatory immune response to the GBM, and they deposit under the subepithelial space [18]. However, further research is needed to verify these hypotheses.
In our study, smoking status was identified as a possible contributing factor for patients with anti-GBM disease and MN. Research has also confirmed that smoking is associated with increased risk for MN [19] and anti-GBM disease [1]. The exact mechanisms underlying this relationship are still unclear. However, smoking may induce the exposure of α3(IV)NC1 epitopes, which are recognized by nephrogenic antibodies and resulting in injury to the renal GBM [19]. Furthermore, in our study, patients with anti-GBM disease associated with MN had significantly higher hemoglobin levels than patients with classic anti-GBM disease. This may be attributed to the milder kidney damage observed in patients with anti-GBM disease associated with MN, as hemoglobin levels are positively correlated with kidney function [20]. Additionally, LDL levels have emerged as another potential independent predictor of anti-GBM disease associated with MN. This may be due to a greater proportion of MN patients presenting with NS.
This study has several limitations. First, this was a retrospective study, which may have caused the introduction of information bias. Second, the study population consisted of a rare disease group, resulting in a relatively small sample size, particularly for the collection of renal pathology specimens. Hence, we were unable to identify histopathological predictors of recovery. Additionally, the lack of frozen kidney tissue prevented us from performing antigen testing on the subjects. Further research is needed to explore the identified factors and their impact on disease outcomes. Since renal biopsy and other MN-associated antibodies, such as NELL-1, a neural tissue encoding protein with epidermal growth factor–like repeats, was not conducted in some patients with classic anti-GBM, the potential existence of MN cannot be excluded in anti-PLA2R-negative patients. In addition, the use of smoking status, hemoglobin levels and LDL levels as predictive values has not been validated in patients with MN and anti-GBM disease, which must be acknowledged. We will continue to investigate the relationships between these variables and diseases to further validate their potential clinical application.
CONCLUSIONS
In conclusion, patients with combined anti-GBM disease and MN have distinct clinical characteristics, including a higher prevalence in males and individuals who smoke, a higher proportion in patients with NS, better renal function at onset, and higher levels of hemoglobin and serum C3. Additionally, a low proportion of crescentic glomerulonephritis with predominant immune deposits of IgG1 and IgG4 was observed in these patients. Importantly, these patients also have a better renal prognosis than those with classic anti-GBM disease. Finally, smoking status, hemoglobin and LDL levels may be predictors of anti-GBM diseases combined with MN.
ACKNOWLEDGEMENTS
We would like to thank all of the patients who had contributed to this study and all the authors that participated in the research.
FUNDING
This work was supported by the Scientific Research and Innovation Team of The First Affiliated Hospital of Zhengzhou University (grant number ZYCXTD2023009).
AUTHORS’ CONTRIBUTIONS
Z.Z. and L.Z. designed the study. Y.W. collected the data and drafted the paper. Y.W. and L.Z. analyzed the data and created the figures. Z.Z. and L.Z. revised the paper. All authors approved the final version of the manuscript.
DATE AVAILABILITY STATEMENT
The data underlying this article will be shared on reasonable request to the corresponding author.
CONFLICT OF INTEREST STATEMENT
The authors report no conflicts of interest.


Comments