


ABSTRACT
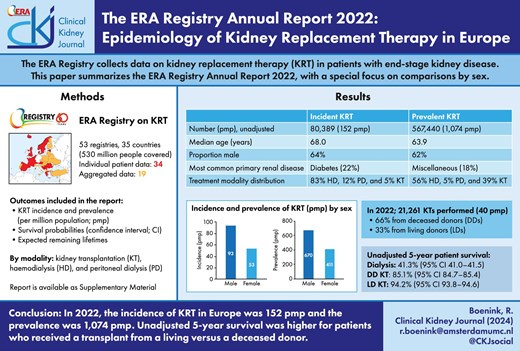
The European Renal Association (ERA) Registry collects data on kidney replacement therapy (KRT) in patients with end-stage kidney disease (ESKD). This paper summarizes the ERA Registry Annual Report 2022, with a special focus on comparisons by sex. The supplement of this paper contains the complete ERA Registry Annual Report 2022. Data was collected from 53 national and regional KRT registries from 35 countries. Using this data, incidence, and prevalence of KRT, kidney transplantation rates, survival probabilities, and expected remaining lifetimes were calculated. In 2022, 530 million people of the European general population were covered by the ERA Registry. The incidence of KRT was 152 per million population (pmp). In incident patients, 54% were 65 years or older, 64% were male, and the most common primary renal disease (PRD) was diabetes mellitus (22%). At KRT initiation, 83% of patients received haemodialysis, 12% received peritoneal dialysis, and 5% underwent pre-emptive kidney transplantation. On 31 December 2022, the prevalence of KRT was 1074 pmp. In prevalent patients, 48% were 65 years or older, 62% were male, the most common PRD was of miscellaneous origin (18%), 56% of patients received haemodialysis, 5% received peritoneal dialysis, and 39% were living with a functioning graft. In 2022, the kidney transplantation rate was 40 pmp, with most kidneys coming from deceased donors (66%). For patients starting KRT between 2013 to 2017, 5-year survival probability was 52%. Compared with the general population, the expected remaining lifetime was 66% and 68% shorter for males and females, respectively, receiving dialysis, and 46% and 49% shorter for males and females, respectively, living with a functioning graft.

INTRODUCTION
The European Renal Association (ERA) Registry Annual Report 2022 (Supplementary Data) reports the latest data on the epidemiology of kidney replacement therapy (KRT) for patients with end-stage kidney disease (ESKD) in Europe and countries bordering the Mediterranean Sea. Data were provided by 53 national or regional renal registries from 35 countries, of which 34 registries from 17 countries contributed individual patient data and 19 registries from 19 countries contributed aggregated data (Appendix 1). The participating registries covered ∼530 million people, corresponding to 62.3% of the total European population. This coverage was slightly higher than the 61.9% covered in 2021 [1]. Compared to the previous annual report, data from Hungary were included while data from Albania were not. In this year's annual report, for the first time, tables and figures on incident patients accepted for KRT in 2022 do not only include the distribution of primary renal diseases (PRD) data from the 1995 ERA PRD codes, but also from the updated 2012/2018 ERA PRD codes.
This paper summarizes the 2022 ERA Registry Annual Report, providing an overview of the incidence and prevalence of KRT, the kidney transplantation rates, and the patient and graft survival and expected remaining years of life of patients receiving KRT in Europe. This year's focus is the comparison by sex. The complete ERA Registry Annual Report 2022 can be found in the Supplementary Data, which also includes information on the methodology used.
RESULTS
KRT incidence
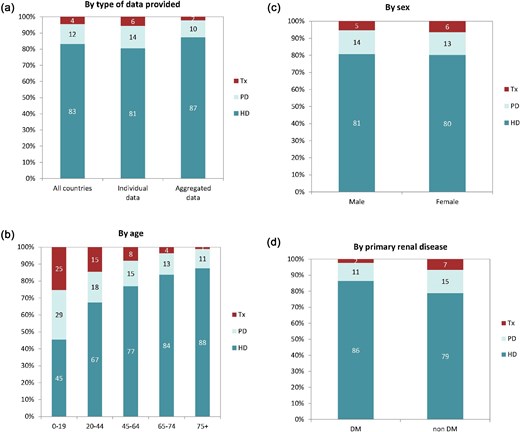
In 2022, 80 389 ESKD patients out of a population of 530 million people initiated KRT (Table 1). This corresponds to an unadjusted KRT incidence rate of 152 per million population (pmp) or 1 in 6600 inhabitants (Table 1), which was higher than the KRT incidence rate of 145 pmp in 2021 [1]. The unadjusted incidence rate ranged from 61 pmp in Ukraine (1 in 16 400 inhabitants) and 68 pmp in Latvia (1 in 14 700 inhabitants) to 279 pmp in Greece (1 in 3600 inhabitants) and 306 pmp in Cyprus (1 in 3300 inhabitants, Table 1 and Figs. 1 and 2). When adjusted for age and sex using the distribution of the European Union 27 countries (EU27) population [2], the differences between countries with the highest and lowest KRT incidence rates hardly changed (Fig. 2). The median age of patients starting KRT was 68.0 years, ranging from 56.0 years in Ukraine to 74.7 years in Greece (Table 1). Among all incident patients, 54% were aged 65 years or older, 64% were male, and the most common PRD was diabetes mellitus (DM) (22%, Fig. 3). At KRT initiation, 83% of patients received HD, 12% received PD, and 5% underwent pre-emptive kidney transplantation, with only minor differences between countries providing individual patient or aggregated data (Fig. 4). For countries providing individual patient data, initial treatment modality varied among age categories, with HD increasing in a step-wise manner from 51% in the age category 0 to 19 years to 88% in the age category 75 years or older (Fig. 4). On the contrary, PD and pre-emptive kidney transplantation decreased with age from 27% and 22% in the age category 0 to 19 years to 11% and 1% in the age category 75 years or older, respectively (Fig. 4). The distribution of initial treatment modalities was similar for males and females (Fig. 4). Patients with DM as PRD received a pre-emptive kidney transplant less frequently compared to patients with other PRDs (2% versus 5%, Fig. 4). On day 91 after the start of KRT, 83% of all incident patients were receiving HD, 12% were receiving PD, and 4% were living with a functioning kidney graft (excluding Turkey, with a high pre-emptive kidney transplantation rate, which did not provide data for day 91; Fig. 5).
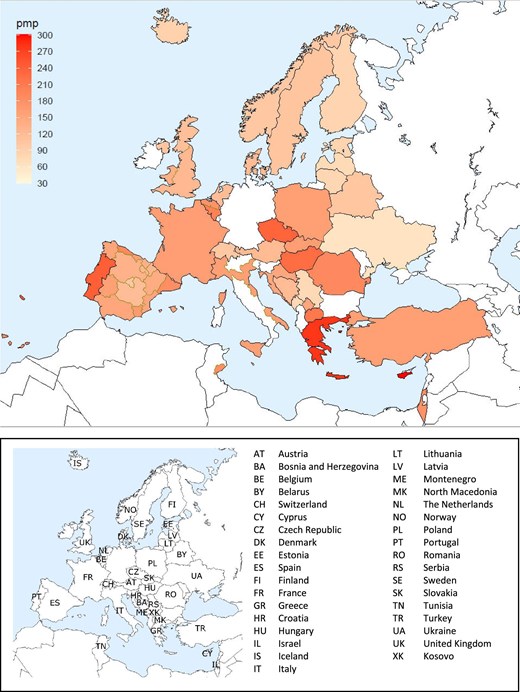
Incidence per million population (pmp) of KRT in 2022 on day 1 by country or region, unadjusted.
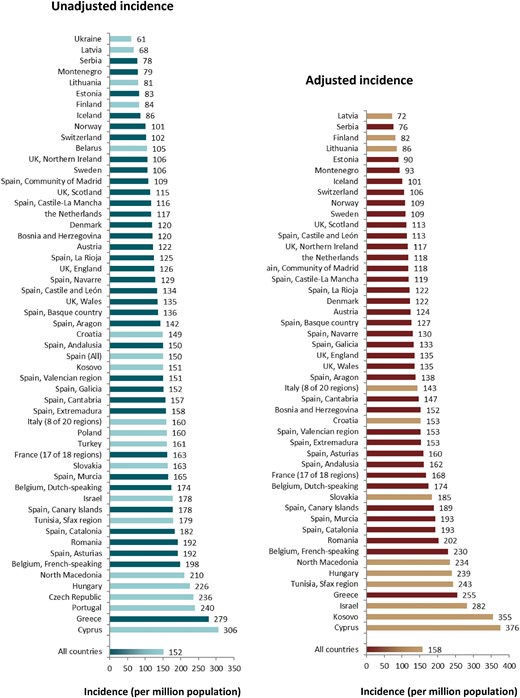
Incidence of KRT per million population in 2022 on day 1 by country or region, unadjusted (left panel), and adjusted (right panel). Registries providing individual patient data are shown as dark bars and registries providing aggregated data as light bars. Adjustment was performed by standardizing the incidence to the age and sex distribution of the EU27 population.
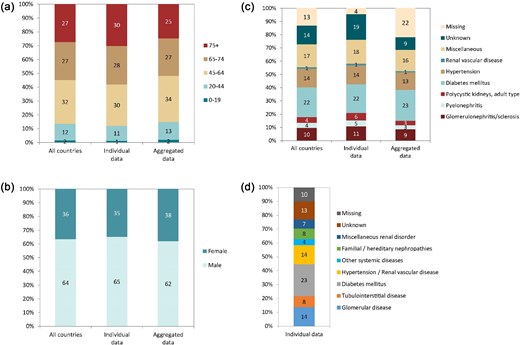
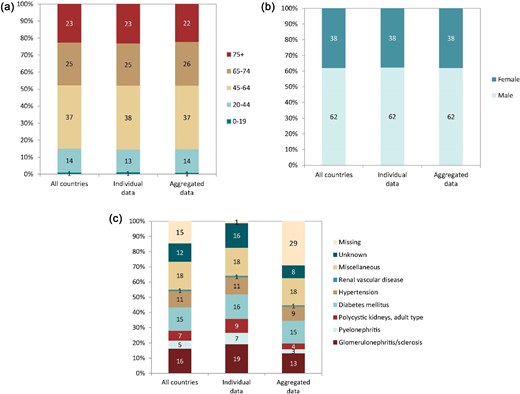
Distribution of (a) age, (b) sex, (c) PRD (1995 ERA codes), and (d) PRD (2012/2018 ERA codes), by type of data provided for incident patients accepted for KRT in 2022 on day 1, unadjusted. See Appendix 1 for a list of countries and regions providing individual patient or aggregated data. Panel (d) is only based on the data from registries providing individual patient data. Bars may not add up to 100% due to rounding.
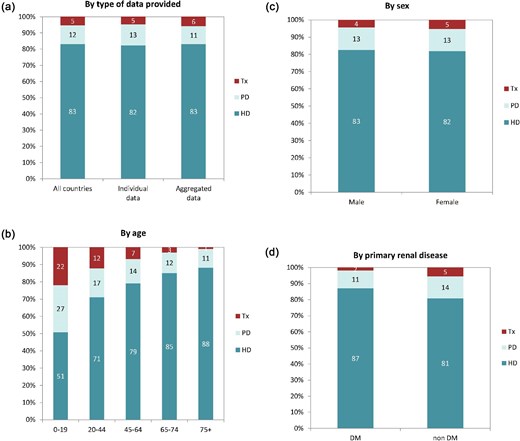
Distribution of treatment modality by (a) type of data provided, (b) age, (c) sex, and (d) PRD (DM and non-DM) for incident patients accepted for KRT in 2022 on day 1, unadjusted. Panels (b)–(d) are only based on the data from registries providing individual patient data. See Appendix 1 for a list of countries and regions providing individual patient or aggregated data. Abbreviation: Tx: transplant.
Distribution of treatment modality by (a) type of data provided, (b) age, (c) sex, and (d) PRD (DM and non-DM) for incident patients accepted for KRT in 2022 on day 91, unadjusted. Panels (b)–(d) are only based on the data from registries providing individual patient data. See Appendix 1 for a list of countries and regions providing individual patient or aggregated data. Turkey and Spain (aggregated data) did not provide data for day 91. Bars may not add up to 100% due to rounding. Abbreviation: Tx: transplant.
Summary data on the unadjusted incidence of KRT in 2022 on day 1 by country or region, the mean and median age at the start of KRT, and the incidence of KRT in patients with DM as PRD.
| Incidence of KRT in 2022 on day 1 | |||||||
|---|---|---|---|---|---|---|---|
| Country/region | General population covered by the registry in thousands | All (n) | All (pmp) | Mean age (years) | Median age (years) | DM (n) | DM (pmp) |
| Austriaa | 8799 | 1073 | 122 | 65.2 | 67.8 | 251 | 29 |
| Belarusb | 8490 | 888 | 105 | 160 | 19 | ||
| Belgium, Dutch-speakingc | 6749 | 1177 | 174 | 70.4 | 73.5 | 242 | 36 |
| Belgium, French-speakingc | 4931 | 978 | 198 | 68.4 | 71.4 | 189 | 38 |
| Bosnia and Herzegovina | 3531 | 424 | 120 | 63.5 | 65.9 | 125 | 35 |
| Croatiad | 3162 | 472 | 149 | 71.0 | 72.0 | 142 | 45 |
| Cyprus | 905 | 277 | 306 | 69.6 | 71.0 | 107 | 118 |
| Czech Republicd | 10 611 | 2502 | 236 | ||||
| Denmark | 5903 | 707 | 120 | 63.0 | 65.7 | 195 | 33 |
| Estonia | 1349 | 112 | 83 | 61.2 | 62.4 | 20 | 15 |
| Finland | 5564 | 465 | 84 | 62.1 | 65.1 | 143 | 26 |
| France (17 of 18 regions) | 67 614 | 10 989 | 163 | 66.9 | 70.4 | 2448 | 36 |
| Greece | 10 437 | 2907 | 279 | 72.0 | 74.7 | 660 | 63 |
| Hungary | 9689 | 2186 | 226 | 65.0 | 68.0 | 1070 | 110 |
| Iceland | 382 | 33 | 86 | 55.9 | 61.8 | 7 | 18 |
| Israel | 9557 | 1703 | 178 | 65.8 | 69.4 | 750 | 78 |
| Italy (8 of 20 regions) | 27 261 | 4362 | 160 | 68.7 | 71.4 | 577 | 21 |
| Kosovob | 1688 | 254 | 151 | 62.4 | 66.0 | 97 | 57 |
| Latvia | 1670 | 114 | 68 | 59.8 | 62.0 | 24 | 14 |
| Lithuania | 2806 | 227 | 81 | 62.6 | 64.3 | 37 | 13 |
| Montenegroc | 617 | 49 | 79 | 63.4 | 67.4 | 14 | 23 |
| North Macedonia | 1830 | 385 | 210 | 63.6 | 66.0 | 85 | 46 |
| Norway | 5457 | 553 | 101 | 64.2 | 67.5 | 93 | 17 |
| Poland | 37 827 | 6068 | 160 | 1523 | 40 | ||
| Portugale | 10 467 | 2515 | 240 | 731 | 70 | ||
| Romania | 19 049 | 3654 | 192 | 63.0 | 65.6 | 400 | 21 |
| Serbia | 6383 | 500 | 78 | 61.9 | 65.4 | 97 | 15 |
| Slovakiad | 4362 | 710 | 163 | 62.9 | 65.0 | 215 | 49 |
| Spain (All) | 47 475 | 7136 | 150 | 63.8 | 68.3 | 1574 | 33 |
| Spain, Andalusia | 8542 | 1281 | 150 | 64.8 | 68.2 | 321 | 38 |
| Spain, Aragon | 1343 | 191 | 142 | 64.6 | 68.2 | 42 | 31 |
| Spain, Asturias | 1006 | 193 | 192 | 68.6 | 71.6 | 47 | 47 |
| Spain, Basque country | 2213 | 300 | 136 | 64.2 | 66.7 | 62 | 28 |
| Spain, Canary Islands | 2199 | 392 | 178 | 63.9 | 66.6 | 123 | 56 |
| Spain, Cantabriac | 587 | 92 | 157 | 66.6 | 70.4 | 15 | 26 |
| Spain, Castile, and Leónc | 2373 | 318 | 134 | 68.6 | 71.4 | 76 | 32 |
| Spain, Castile-La Manchac | 2069 | 241 | 116 | 66.7 | 67.6 | 56 | 27 |
| Spain, Catalonia | 7793 | 1422 | 182 | 66.4 | 69.7 | 270 | 35 |
| Spain, Community of Madrid | 6750 | 702 | 109 | 64.1 | 66.5 | 139 | 22 |
| Spain, Extremadura | 1055 | 167 | 158 | 65.5 | 69.0 | 31 | 29 |
| Spain, Galicia | 2696 | 409 | 152 | 66.3 | 67.9 | 93 | 34 |
| Spain, La Rioja | 321 | 40 | 125 | 65.9 | 66.5 | 5 | 16 |
| Spain, Murcia | 1532 | 252 | 165 | 65.6 | 69.6 | 64 | 42 |
| Spain, Navarrec | 668 | 86 | 129 | 62.8 | 64.8 | 24 | 36 |
| Spain, Valencian region | 5098 | 768 | 151 | 66.4 | 69.0 | 139 | 27 |
| Sweden | 10 487 | 1115 | 106 | 64.6 | 68.8 | 270 | 26 |
| Switzerland | 8689 | 889 | 102 | 65.7 | 69.8 | 185 | 21 |
| the Netherlands | 16 285 | 1902 | 117 | 62.5 | 66.0 | 370 | 23 |
| Tunisia, Sfax regiond | 1023 | 184 | 179 | 61.9 | 65.0 | 56 | 55 |
| Turkeyf | 85 280 | 13 725 | 161 | 2502 | 59 | ||
| Ukraineb | 20 647 | 1257 | 61 | 54.5 | 56.0 | 295 | 14 |
| UK, England | 52 823 | 6647 | 126 | 60.4 | 63.3 | 1663 | 31 |
| UK, Northern Ireland | 1911 | 203 | 106 | 60.3 | 63.2 | 35 | 18 |
| UK, Scotland | 5448 | 624 | 115 | 59.3 | 61.7 | 149 | 27 |
| UK, Wales | 3132 | 423 | 135 | 60.8 | 63.3 | 125 | 40 |
| All countries | 530 138 | 80 389 | 152 | 64.8 | 68.0 | 17 626 | 37 |
When cells are left empty, the data are unavailable and could not be used for the calculation of the summary data
The incidence is underestimated by ∼2% due to one haemodialysis centre not submitting data
Patients younger than 18 years of age are not reported
Patients younger than 20 years of age are not reported
Data include dialysis patients only
Data on PRD are available for dialysis patients only (N = 2492, 99.1% of total)
Data on DM are extrapolated from data of 6821 patients (49.7% of total)
KRT prevalence
On 31 December 2022, 567 440 patients with ESKD were receiving KRT, corresponding to a prevalence of 1074 pmp or 1 in 930 inhabitants (Table 2). The unadjusted prevalence ranged from 369 pmp in Ukraine (1 in 2700 inhabitants) and 484 pmp in Belarus (1 in 2100 inhabitants) to 1590 pmp in the Canary Islands, Spain (1 in 650 inhabitants) and 2025 pmp in Portugal (1 in 500 inhabitants, Table 2 and Figs. 6 and 7). When adjusted for age and sex using the EU27 distribution [2], these large country differences in KRT prevalence remained (Fig. 7). The median age of prevalent patients was 63.9 years, ranging from 54.0 years in Ukraine to 70.4 years in Israel (Table 2). Among prevalent patients, 48% were aged 65 years or older, 62% were male, and the most common PRD was of miscellaneous origin (18%, Fig. 8). While there was nearly no difference in the age and sex distribution between countries providing individual patient versus aggregated data, the PRD distribution varied by type of data provided, which was likely due to the higher proportion of missing PRDs (29%) for countries providing aggregated data (Fig. 8). Of prevalent patients, 56% received haemodialysis, 5% received peritoneal dialysis, and 39% were living with a functioning graft (Fig. 9). In addition, a larger proportion of patients was living with a functioning graft in countries providing individual data (47%) compared to countries providing aggregated data (33%, Fig. 9). For countries providing individual patient data, the distribution of treatment modalities varied across age groups, with the proportion of patients living with a functioning graft varying from 77% in the age category 0 to 19 years to 21% in patients aged 75 years or older (Fig. 9). For both males and females, 47% of patients were living with a functioning graft (Fig. 9). Only 29% of patients with DM as PRD were living with a functioning graft compared to 50% of patients with a different PRD (Fig. 9).
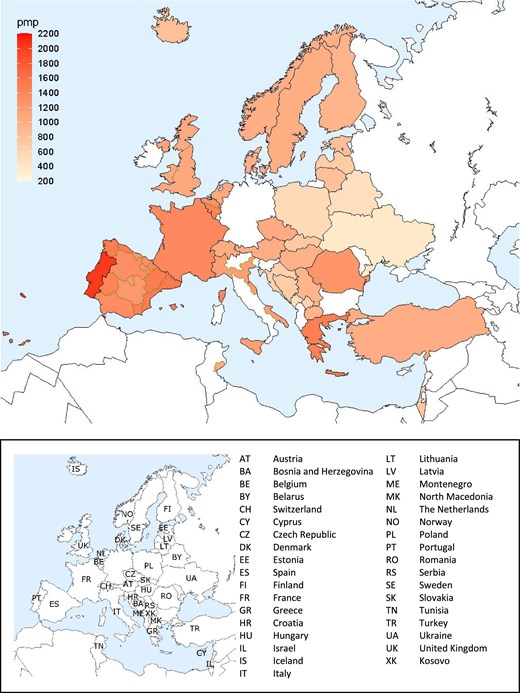
Prevalence per million population (pmp) of KRT on 31 December 2022 by country or region, unadjusted.
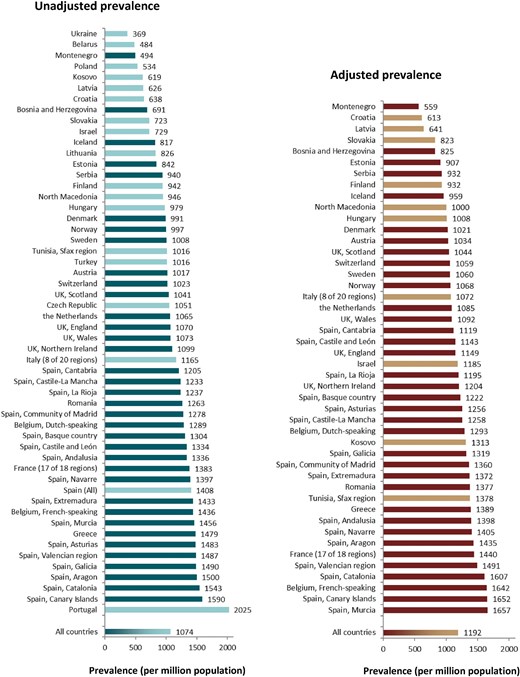
Prevalence per million population of KRT on 31 December 2022 by country or region, unadjusted (left panel) and adjusted (right panel). Registries providing individual patient data are shown as dark bars and registries providing aggregated data as light bars. Adjustment was performed by standardizing the prevalence to the age and sex distribution of the EU27 population.
Distribution of (a) age, (b) sex, and (c) PRD (1995 ERA codes) by type of data provided for prevalent patients on KRT on 31 December 2022, unadjusted. See Appendix 1 for a list of countries and regions providing individual patient or aggregated data. Bars may not add up to 100% due to rounding.
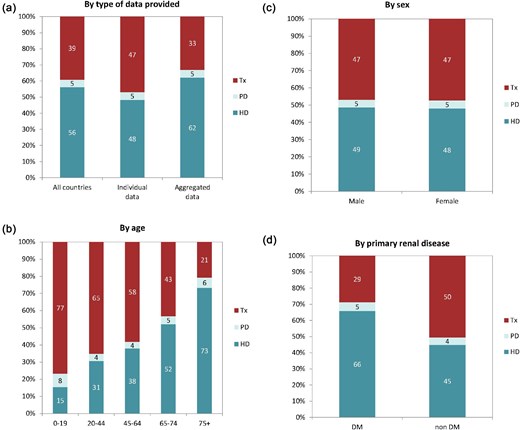
Distribution of treatment modality by (a) type of data provided, (b) age, (c) sex, and (d) PRD (DM and non-DM) for prevalent patients on KRT on 31 December 2022, unadjusted. Panels (b)–(d) are only based on the data from registries providing individual patient data. See Appendix 1 for a list of countries and regions providing individual patient or aggregated data. Bars may not add up to 100% due to rounding. Abbreviation: Tx: transplant.
Summary data on the unadjusted prevalence of KRT on 31 December 2022 by country or region, the mean and median age on 31 December 2022, and the prevalence of KRT in patients with DM as PRD.
| Prevalent patients on KRT in 2022 | |||||||
|---|---|---|---|---|---|---|---|
| Country/region | General population covered by the registry in thousands | All (n) | All (pmp) | Mean age (years) | Median age (years) | DM (n) | DM (pmp) |
| Austriaa | 8799 | 8950 | 1017 | 62.4 | 63.9 | 1655 | 188 |
| Belarusb | 8490 | 4108 | 484 | 461 | 54 | ||
| Belgium, Dutch-speakingc | 6749 | 8702 | 1289 | 66.6 | 68.5 | 1413 | 209 |
| Belgium, French-speakingc | 4931 | 7083 | 1436 | 66.2 | 68.0 | 1233 | 250 |
| Bosnia and Herzegovina | 3531 | 2441 | 691 | 60.3 | 62.0 | 451 | 128 |
| Croatiad | 3162 | 2018 | 638 | 66.8 | 70.0 | 513 | 162 |
| Czech Republic | 10 611 | 11 157 | 1051 | ||||
| Denmark | 5903 | 5848 | 991 | 59.6 | 60.9 | 991 | 168 |
| Estonia | 1349 | 1136 | 842 | 60.3 | 61.6 | 205 | 152 |
| Finland | 5564 | 5240 | 942 | 60.1 | 62.6 | 1256 | 226 |
| France (17 of 18 regions) | 67 614 | 93 486 | 1383 | 63.5 | 65.7 | 15 364 | 227 |
| Greece | 10 437 | 15 440 | 1479 | 66.4 | 68.4 | 2729 | 261 |
| Hungary | 9689 | 9485 | 979 | 59.4 | 61.0 | 1964 | 203 |
| Iceland | 382 | 312 | 817 | 57.5 | 58.6 | 41 | 107 |
| Israeld | 9557 | 6963 | 729 | 68.0 | 70.4 | 3213 | 336 |
| Italy (8 of 20 regions) | 27 261 | 31 758 | 1165 | 63.6 | 65.6 | 3329 | 122 |
| Kosovob | 1688 | 1044 | 619 | 59.3 | 62.0 | 284 | 168 |
| Latvia | 1670 | 1046 | 626 | 56.1 | 58.0 | 123 | 74 |
| Lithuania | 2806 | 2318 | 826 | ||||
| Montenegroc | 617 | 305 | 494 | 60.7 | 63.5 | 57 | 92 |
| North Macedonia | 1830 | 1731 | 946 | 59.8 | 62.0 | 309 | 169 |
| Norway | 5457 | 5442 | 997 | 60.4 | 62.3 | 708 | 130 |
| Polandd | 37 827 | 20 198 | 534 | 4434 | 117 | ||
| Portugale | 10 467 | 21 198 | 2025 | 67.6 | 3754 | 552 | |
| Romania | 19 049 | 24 054 | 1263 | 64.4 | 66.4 | 2189 | 115 |
| Serbia | 6383 | 6000 | 940 | 62.1 | 64.4 | 1056 | 165 |
| Slovakiad | 4362 | 3154 | 723 | 63.9 | 66.0 | 853 | 196 |
| Spain (All) | 47 475 | 66 856 | 1408 | 60.1 | 63.5 | 11 102 | 234 |
| Spain, Andalusia | 8542 | 11 412 | 1336 | 62.0 | 63.4 | 1936 | 227 |
| Spain, Aragon | 1343 | 2014 | 1500 | 66.0 | 67.8 | 357 | 266 |
| Spain, Asturias | 1006 | 1492 | 1483 | 65.1 | 67.0 | 267 | 265 |
| Spain, Basque country | 2213 | 2887 | 1304 | 62.5 | 64.6 | 399 | 180 |
| Spain, Canary Islands | 2199 | 3497 | 1590 | 63.1 | 64.1 | 905 | 412 |
| Spain, Cantabriac | 587 | 707 | 1205 | 64.0 | 65.1 | 113 | 193 |
| Spain, Castile, and Leónc | 2373 | 3165 | 1334 | 66.2 | 67.2 | 518 | 218 |
| Spain, Castile-La Manchac | 2069 | 2551 | 1233 | 64.3 | 65.0 | 443 | 214 |
| Spain, Catalonia | 7793 | 12 027 | 1543 | 63.5 | 65.1 | 1833 | 235 |
| Spain, Community of Madrid | 6750 | 8194 | 1278 | 62.8 | 64.2 | 1392 | 217 |
| Spain, Extremadura | 1055 | 1512 | 1433 | 64.5 | 65.3 | 253 | 240 |
| Spain, Galicia | 2696 | 4017 | 1490 | 64.1 | 65.5 | 677 | 251 |
| Spain, La Rioja | 321 | 397 | 1237 | 62.9 | 63.6 | 52 | 162 |
| Spain, Murcia | 1532 | 2230 | 1456 | 63.2 | 64.3 | 369 | 241 |
| Spain, Navarrec | 668 | 933 | 1397 | 63.6 | 65.5 | 157 | 235 |
| Spain, Valencian region | 5098 | 7582 | 1487 | 64.2 | 66.0 | 1112 | 218 |
| Sweden | 10 487 | 10 573 | 1008 | 60.6 | 62.6 | 1774 | 169 |
| Switzerland | 8689 | 8885 | 1023 | 63.2 | 65.3 | 1278 | 147 |
| the Netherlands | 16 993 | 18 096 | 1065 | 61.3 | 63.3 | 2381 | 140 |
| Tunisia, Sfax regiond | 1023 | 1043 | 1016 | 58.0 | 60.0 | 220 | 214 |
| Turkeyf | 85 280 | 86 665 | 1016 | 6188 | 359 | ||
| Ukraineb | 20 647 | 7625 | 369 | 53.0 | 54.0 | 1283 | 62 |
| UK, England | 52 309 | 55 950 | 1070 | 58.3 | 59.8 | 10 020 | 192 |
| UK, Northern Ireland | 1911 | 2099 | 1099 | 58.9 | 60.1 | 291 | 152 |
| UK, Scotland | 5448 | 5671 | 1041 | 57.7 | 59.5 | 935 | 172 |
| UK, Wales | 3132 | 3360 | 1073 | 58.4 | 59.5 | 626 | 200 |
| All countries | 529 427 | 567 440 | 1074 | 62.0 | 63.9 | 84 683 | 191 |
When cells are left empty, the data are unavailable and could not be used for the calculation of the summary data
The prevalence is underestimated by approximately 2% due to one haemodialysis centre not submitting data
Patients younger than 18 years of age are not reported
Patients younger than 20 years of age are not reported
Data on prevalence include dialysis patients only
Data on DM are extrapolated from data of 13 759 patients (65.0% of total)
Data on DM are extrapolated from data of 17 506 patients (20.2% of total)
Kidney transplantation
In 2022, 21 261 kidney transplantations were performed, of which 66% were from deceased donors (DD), 33% from living donors (LD), and for 1% the donor type was unknown (Fig. 10). The unadjusted kidney transplantation rate was 40 pmp or 1 in 25 000 inhabitants, ranging from 3 pmp in Serbia (1 in 330 000 inhabitants) to 122 pmp in Catalonia, Spain (1 in 8200 inhabitants, Fig. 10). In the Spanish region Castile-La Mancha, all kidney transplants came from DD while in Kosovo and the Sfax region in Tunisia all kidney transplants came from LD (Fig. 10). The overall unadjusted DD kidney transplantation rate was twice as high as the LD rate (DD: 27 pmp or 1 in 37 000 inhabitants versus LD: 13 pmp or 1 in 76 900 inhabitants, Fig. 11). Cantabria in Spain had the highest rate of DD kidney transplantations (106 pmp or 1 in 9400 inhabitants), while Turkey had the highest rate of LD kidney transplantations (39 pmp or 1 in 25 600 inhabitants, Fig. 11). In countries providing individual patient data, 79% of kidney transplants came from DD compared to 59% in countries providing aggregated data (Fig. 12).
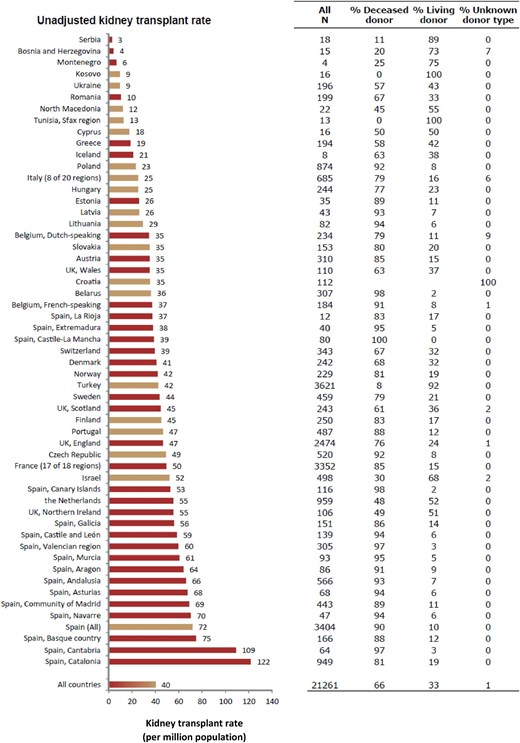
Kidney transplantations performed in 2022 counts (N) and per million population by country or region, unadjusted. Registries providing individual patient data are shown as red bars and registries providing aggregated data as orange bars.
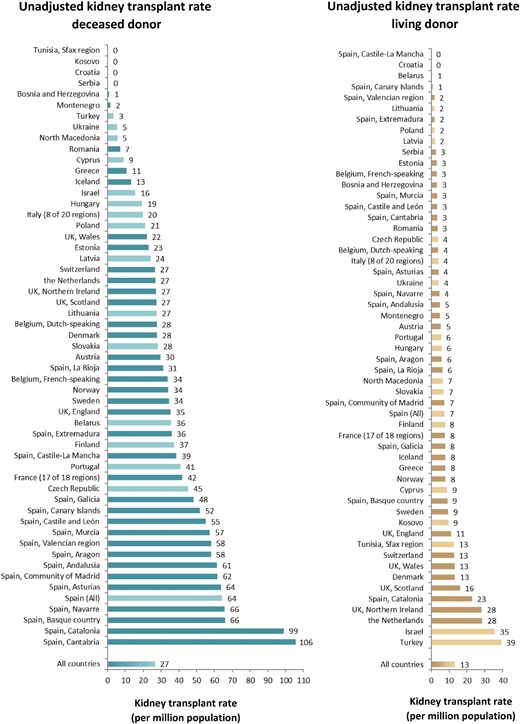
Kidney transplantations performed in 2022 per million population by donor type and by country or region, unadjusted. Registries providing individual patient data are shown as dark bars and registries providing aggregated data as light bars.
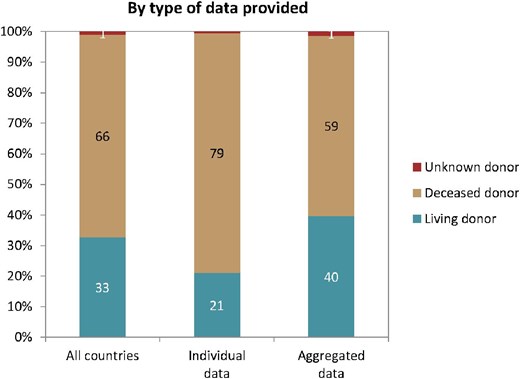
Donor type distribution for kidney transplantations performed in 2022 by type of data provided, unadjusted. See Appendix 1 for a list of countries and regions providing individual patient or aggregated data.
Survival probability of patients receiving KRT
For patients initiating KRT between 2013 and 2017, the unadjusted 5-year patient survival probability was 51.5% (95% confidence interval (95% CI) 51.2–51.7, Table 3). In patients initiating dialysis, the unadjusted 5-year survival probability was 41.3% (95% CI 41.0–41.5), while in patients receiving a first kidney transplant, 5-year survival was 85.1% (95% CI 84.7–85.4) for DD and 94.2% (95% CI 93.8–94.6) for LD (Table 3, Figs. 13 and 14). The unadjusted 5-year graft survival probability was 76.2% (95% CI 75.7–76.6) after DD kidney transplantation and 88.1% (95% CI 87.6–88.7) after LD kidney transplantation (Table 3). Similar trends were observed when analyses were adjusted using fixed values for age, sex, and PRD (Table 3).
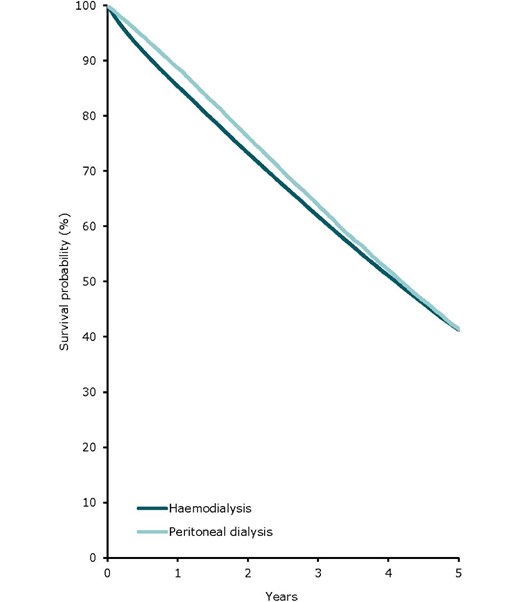
Patient survival by modality (haemodialysis or peritoneal dialysis) for incident dialysis patients accepted for KRT in 2022 on day 91 (cohort 2013–2017), unadjusted. See Appendix 2 for a list of countries and regions providing individual patient data included in the survival analyses.
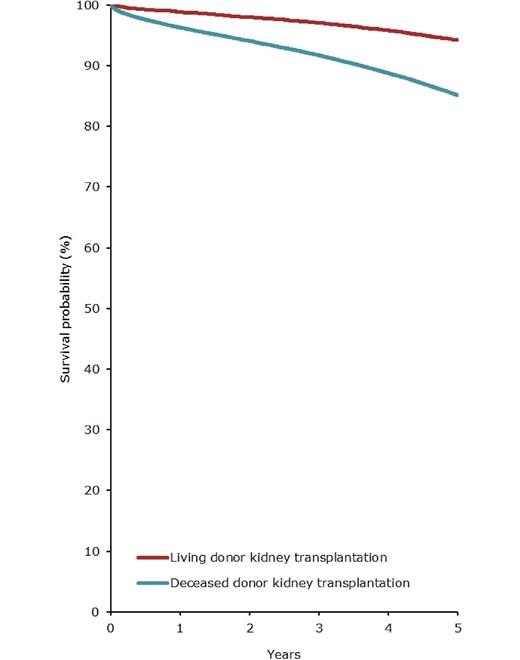
Patient survival in first-time kidney transplant recipients by donor type (deceased or living) from day of transplant (cohort 2013–2017), unadjusted. See Appendix 2 for a list of countries and regions providing individual patient data included in the survival analyses.
One-, two-, and five-year survival probabilities by treatment modality and cohort from day 1 of the start of KRT, dialysis, or from the day of kidney transplantation.
| Survival probabilities as percentages (%) (95% confidence intervals) | ||||||
|---|---|---|---|---|---|---|
| Cohort: 2013–2017 | Cohort: 2016–2020 | |||||
| Survival type | 1 year | 2 year | 5 year | 1 year | 2 year | |
| Patient survival on KRT | ||||||
| Unadjusted | 85.3 (85.1–85.5) | 75.3 (75.1–75.5) | 51.5 (51.2–51.7) | 85.7 (85.6–85.9) | 75.7 (75.5–75.9) | |
| Adjusteda | 88.2 (88.0–88.3) | 79.3 (79.1–79.5) | 54.2 (53.9–54.4) | 88.3 (88.2–88.5) | 79.2 (79.0–79.4) | |
| Patient survival on dialysis | ||||||
| Unadjusted | 84.2 (84.0–84.4) | 72.6 (72.4–72.8) | 41.3 (41.0–41.5) | 84.7 (84.5–84.9) | 73.1 (72.9–73.3) | |
| Adjusteda | 86.5 (86.4–86.7) | 76.3 (76.0–76.5) | 46.7 (46.4–47.0) | 87.1 (87.0–87.3) | 76.9 (76.7–77.1) | |
| Patient survival after a first kidney transplantation (deceased donor) | ||||||
| Unadjusted | 96.3 (96.1–96.5) | 94.1 (93.8–94.3) | 85.1 (84.7–85.4) | 96.1 (95.9–96.3) | 93.3 (93.1–93.5) | |
| Adjustedb | 98.1 (98.0–98.2) | 97.0 (96.8–97.1) | 91.9 (91.6–92.2) | 98.1 (98.0–98.3) | 96.8 (96.6–96.9) | |
| Graft survival after a first kidney transplantation (deceased donor) | ||||||
| Unadjusted | 91.0 (90.8–91.3) | 87.8 (87.4–88.1) | 76.2 (75.7–76.6) | 91.1 (90.8–91.3) | 87.3 (87.0–87.7) | |
| Adjustedb | 93.1 (92.9–93.4) | 90.5 (90.2–90.8) | 80.9 (80.5–81.3) | 93.4 (93.2–93.7) | 90.6 (90.3–90.9) | |
| Patient survival after a first kidney transplantation (living donor) | ||||||
| Unadjusted | 98.8 (98.6–99.0) | 98.0 (97.7–98.2) | 94.2 (93.8–94.6) | 98.8 (98.6–99.0) | 97.9 (97.6–98.1) | |
| Adjustedb | 99.1 (98.9–99.2) | 98.4 (98.2–98.7) | 95.3 (95.0–95.7) | 99.1 (99.0–99.3) | 98.4 (98.2–98.6) | |
| Graft survival after a first kidney transplantation (living donor) | ||||||
| Unadjusted | 96.5 (96.2–96.8) | 95.0 (94.6–95.3) | 88.1 (87.6–88.7) | 96.7 (96.4–97.0) | 95.1 (94.7–95.4) | |
| Adjustedb | 96.4 (96.1–96.8) | 94.8 (94.4–95.2) | 87.7 (87.1–88.3) | 96.6 (96.2–96.9) | 94.9 (94.5–95.3) | |
Analyses were adjusted using fixed values: age (67 years), sex (63% male), and PRD (24% DM, 19% hypertension/renal vascular disease, 11% glomerulonephritis, and 46% other causes)
Analyses were adjusted using fixed values: age (50 years), sex (63% male), and PRD (14% DM, 10% hypertension/renal vascular disease, 23% glomerulonephritis, and 53% other causes)
See Appendix 2 for a list of countries and regions providing individual patient data that were included in the survival analyses.
Expected remaining lifetime
When compared to the adult general population, the expected remaining lifetimes were on average 66% and 68% shorter for males and females on dialysis, and 46% and 49% shorter for males and females living with a functioning graft in the period from 2018 to 2022 (Fig. 15). In males and females aged 20 to 24 years receiving dialysis, the expected remaining lifetimes were 21 and 20 years, respectively, 39 and 44 years shorter than for the general population. For male and female kidney transplant recipients of the same age, expected remaining lifetimes were 41 and 42 years, which were 18 and 23 years shorter than that of the general population. In males and females aged 65 to 69 years receiving dialysis, the expected remaining lifetimes were 5 and 6 years, respectively, 13 and 16 years shorter than in the general population. In male and female kidney transplant recipients of the same age, the expected remaining lifetimes were 9 and 10 years, which were 10 and 12 years shorter than that of the general population.
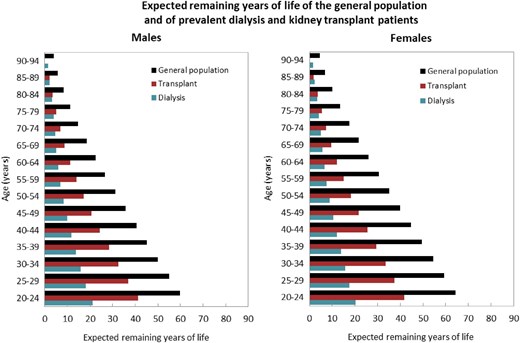
Expected remaining years of life in the general population and for prevalent dialysis and kidney transplant patients (cohort 2018–2022), by sex. See Appendix 2 for a list of countries and regions providing individual patient data included in the expected remaining years of life analyses.
Comparisons by sex
In this year's annual report, additional comparisons by sex are presented. In 2022, the KRT incidence was higher in males (93 pmp or 1 in 10 800 inhabitants) compared to females (53 pmp or 1 in 18 900 inhabitants, Fig. 16). The proportion of females among incident KRT patients ranged from 24% in Iceland to 46% in Estonia (Fig. 17). In countries providing individual patient data, the distribution of age and initial treatment modality was similar for males and females (Fig. 18). Although there were no major differences in the PRD distribution among males and females starting KRT, according to the 1995 ERA PRD codes, a higher proportion of males (16%) had hypertension as PRD compared to females (12%, Fig. 18). Findings from the updated ERA PRD codes from 2012 / 2018 showed that females (10%) had a higher proportion of familiar/hereditary nephropathies compared to males (6%, Fig. 18).
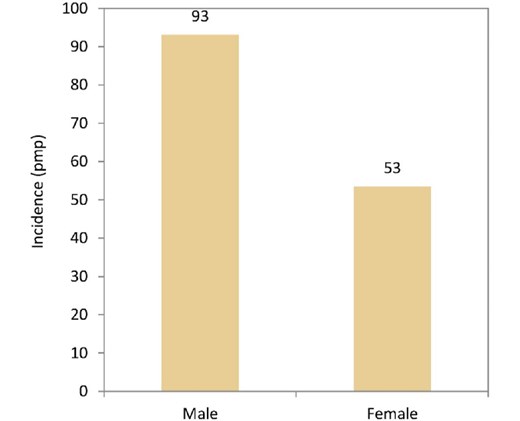
Incidence of KRT per million population (pmp) in 2022 on day 1 by sex, unadjusted.
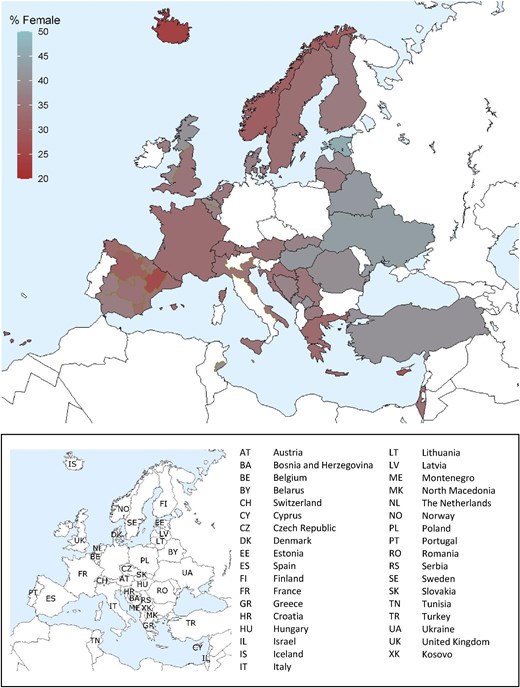
Percentage of female incident patients accepted for KRT in 2022 on day 1 by country or region, unadjusted.
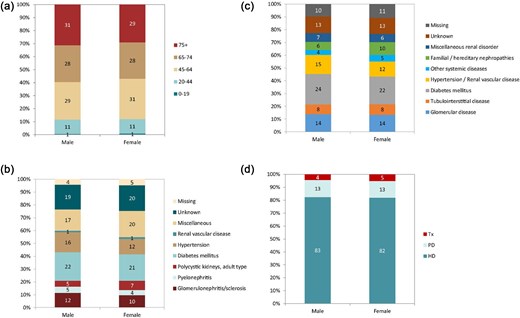
Distribution of (a) age, (b) PRD (1995 ERA codes), and (c) PRD (2012/2018 ERA codes), and (d) treatment modality by sex for incident patients accepted for KRT in 2022 on day 1, unadjusted. This figure is only based on data from registries providing individual patient data (see Appendix 1). Bars may not add up to 100% due to rounding. Abbreviation: Tx: transplantation.
On 31 December 2022, the prevalence of KRT was higher in males (670 pmp or 1 in 1500 inhabitants) than in females (411 pmp or 1 in 2400 inhabitants, Fig. 19). The proportion of females in prevalent KRT patients ranged from 32% in Cantabria, Spain to 45% in Ukraine (Fig. 20). The distribution of age and treatment modality was similar across males and females in countries providing individual patient data (Fig. 21). There were no major differences in the distribution of PRDs among prevalent males and females on KRT. Nevertheless, according to the 1995 ERA PRD codes, a higher percentage of males (21%) had glomerulonephritis/sclerosis as PRD than females (17%), while a higher percentage of females had polycystic kidney disease as PRD (12% in females vs 8% in males) or were grouped under miscellaneous (21% in females vs 17% in males, Fig. 21).
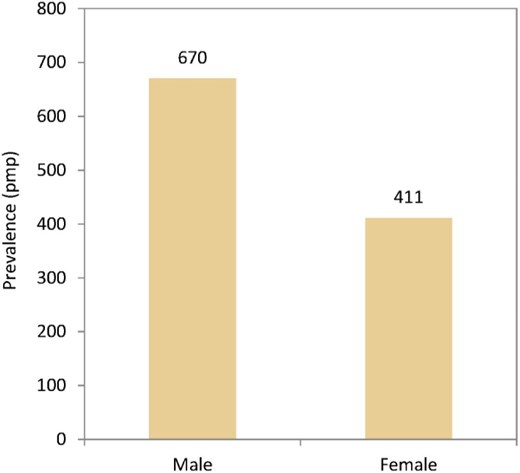
Prevalence of KRT per million population (pmp) on 31 December 2022 by sex, unadjusted.
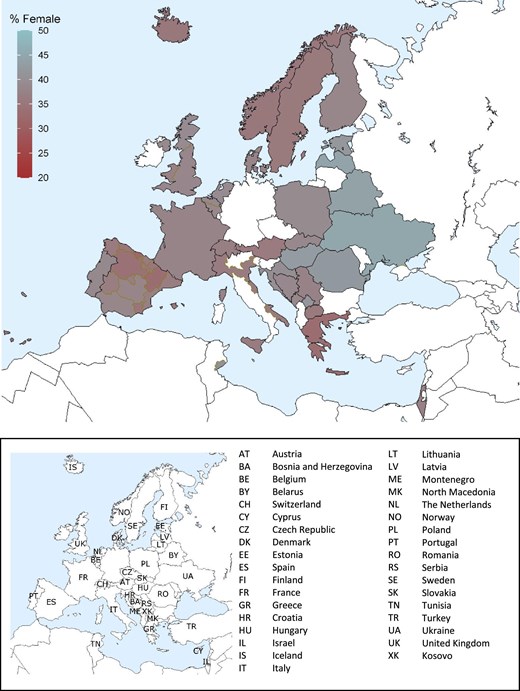
Percentage of female prevalent patients on KRT on 31 December 2022, unadjusted.
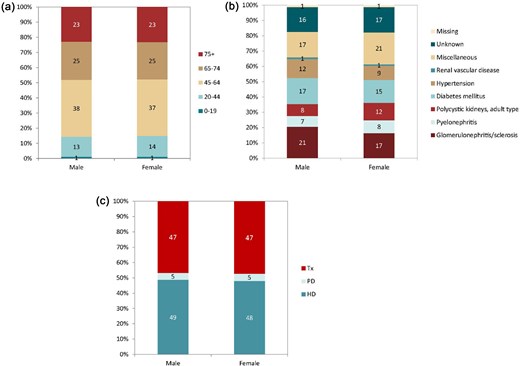
Distribution of (a) age, (b) PRD (1995 ERA codes), and (c) treatment modality by sex for prevalent patients on KRT on 31 December 2022, unadjusted. This figure is only based on data from registries providing individual patient data (see Appendix 1). Bars may not add up to 100% due to rounding. Abbreviation: Tx: transplantation.
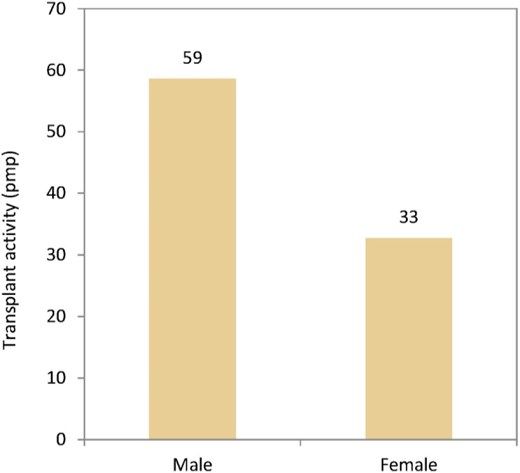
In 2022, the kidney transplantation rate was higher in males (59 pmp or 1 in 16 900 inhabitants) compared to females (33 pmp or 1 in 30 300 inhabitants, Fig. 22). However, the donor type distribution was similar across the sexes, with 21% of recipients receiving a kidney transplant from a LD (Fig. 23). Using data of patients on dialysis at day 91 during the period 2013–2017, the 5-year unadjusted patient survival was higher in females (44.1%) compared to males (39.9%, Fig. 24). Similarly, in patients receiving a first kidney transplant between 2013–2017, the unadjusted patient survival was slightly higher in female (88.6%) compared to male recipients (86.5%, Fig. 25).
Kidney transplants per million population (pmp) by sex, unadjusted.
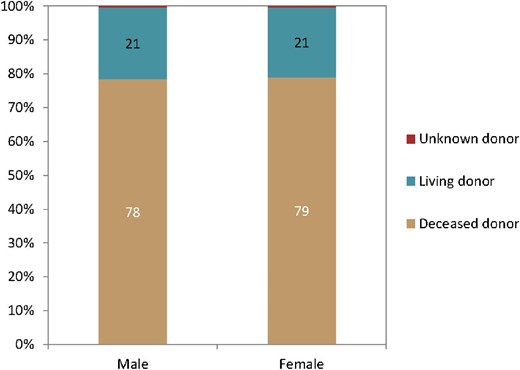
Donor type distribution by sex in kidney transplant recipients. Bars may not add up to 100% due to rounding.
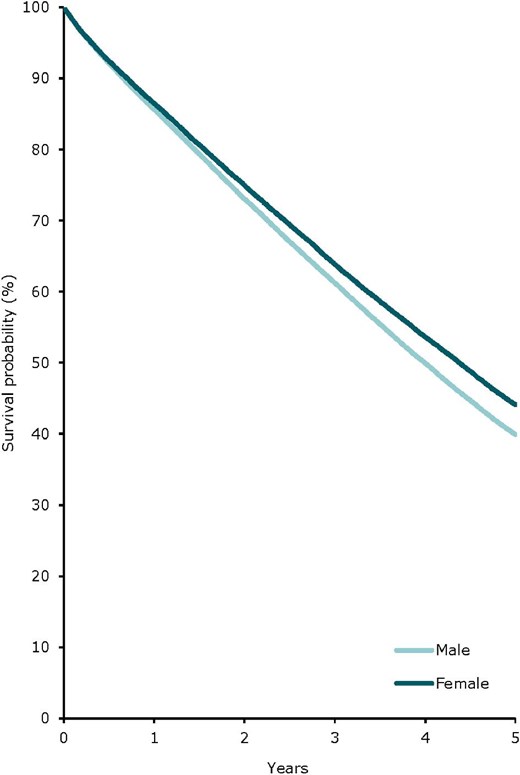
Patient survival in incident dialysis patients by sex from day 91 (cohort 2013–2017), unadjusted. See Appendix 2 for a list of countries and regions providing individual patient data included in the survival analyses.
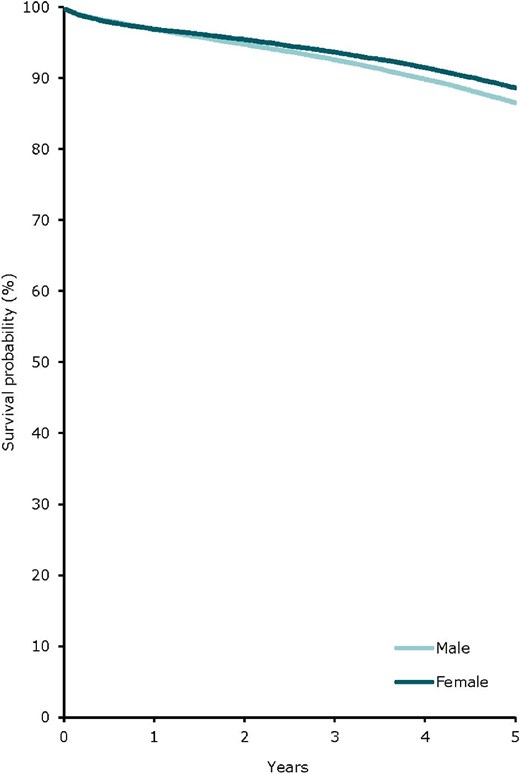
Patient survival in first-time kidney transplant recipients by sex from day of transplant (cohort 2013–2017), unadjusted. See Appendix 2 for a list of countries and regions providing individual patient data included in the survival analyses.
AFFILIATED REGISTRIES
We would like to thank the patients and the staff of the dialysis and transplant units for contributing the data via their national and regional renal registries. Furthermore, we gratefully acknowledge the following registries and persons for their contribution of the data: Austrian Dialysis and Transplant Registry (OEDTR) (G. Mayer, J. Kerschbaum, and D. Kaiser-Feistmantl); Belarus Renal Registry (K. Kamisarau and A. Kalachyk); Dutch-speaking Belgian Society of Nephrology (NBVN) (L. Heylen, V. De Meyer, and J. De Meester); French-speaking Belgian Society of Nephrology (GNFB) (JM. des Grottes and F. Collart); Renal Registry Bosnia and Herzegovina (H. Resic, D. Rebic, N. Petkovic, and M. Tomic); Croatian Renal Registry (D. Katicic and K. Altabas); Cyprus Renal Registry (V. Scoutellas and M. Athanasiadou); Czech Republic: Registry of Dialysis Patients (RDP) (L. Francová); Danish Nephrology Registry (DNS); Estonian Society of Nephrology (Ü. Pechter and K. Lilienthal); Finnish Registry for Kidney Diseases (P. Finne); France: The Epidemiology and Information Network in Nephrology (REIN) (C. Couchoud); Hellenic Renal Registry (G. Moustakas); Hungarian Renal Registry (L. Wagner and E. Ladanyi); Icelandic End-Stage Renal Disease Registry (R. Palsson); Montenegro Renal Registry (F. Tomović); Israel National Registry of Renal Replacement Therapy (L. Keinan-Boker and R. Dichtiar); Italian Registry of Dialysis and Transplantation (RIDT) (M. Nordio and P.M. Ferraro); Kosovo Renal Registry (M. Tolaj Avdiu, V. Godanci Kelmendi, and F. Memeti Smaili); Latvian Renal Registry (I. Ziedina, K. Racenis, and A. Petersons); Lithuanian Renal Registry (I. Nedzelskiene and R. Gaidelyte); North Macedonian Renal Registry (I. Rambabova Bushljetikj, V. Tomanoski, and V. Krecova); Norwegian Renal Registry (A.V. Reisæter); Renal Registry of Poland (P. Jagodzinski and R. Gellert); Portuguese Renal Registry (E. Almeida); Romanian Renal Registry (RRR) (G. Mircescu, L. Garneata, and E. Podgoreanu); Renal Registry in Serbia (M. Lausevic and all dialysis units in Serbia); Slovakian Renal Registry (I. Lajdová and J. Rosenberger); Spain Renal Registry (B. Mahillo Durán); Swedish Renal Registry (SRR) (K.G. Prütz, M. Stendahl, M. Evans, T. Lundgren, H. Rydell, and M. Segelmark); Swiss Dialysis Registry (P. Ambühl); Dutch Renal Registry (Nefrodata) (P. Verschoor and L. Heuveling); Sfax Renal Registry (D. Zalila, F. Jarraya, and K. Kammoun); Registry of the Nephrology, Dialysis and Transplantation in Turkey (TSNNR) (I. Koçyigit and K. Ateş); Ukrainian Renal Data System (URDS) (M. Kolesnyk, O. Razvazhaieva, and N. Kozliuk); UK Renal Registry (All the staff of the UK Renal Registry and of the renal units submitting data); Scottish Renal Registry (SRR) (All of the Scottish renal units); and the regional registries of Andalusia (SICATA) [P. Castro de la Nuez (on behalf of all users of SICATA)], Aragon (F. Arribas Monzón), Asturias (M.R. Camblor, J.R. Quirós, and RERCA working group), Basque country (UNIPAR) (Á. Magaz, J. Aranzabal, M. Rodrigo, and I. Moina), Canary Islands (C. García Cantón and D. Marrero Miranda), Cantabria (J.C. Ruiz San Millán), Castile and León (P. Ucio Mingo and M. Prieto Velasco), Castile-La Mancha (G. Gutiérrez Ávila and I. Moreno Alía), Catalonia (RMRC) (J. Tort and M. Vázquez), Community of Madrid (A. Escribá Bárcenas), Extremadura [all the renal units (Nephrology and Dialysis) from Extremadura], Galicia (E. Bouzas-Caamaño), La Rioja (E. Huarte Loza and H. Hernández Vargas), Murcia (C. Santiuste de Pablos), Navarre (J. Manrique Escola), and Valencian region (O.L. Rodríguez-Arévalo).
ERA REGISTRY COMMITTEE MEMBERS
R. Torra, Spain (ERA President); A. Ortiz, Spain (Chair); M. Arnol, Slovenia; A. Åsberg, Norway; S. Bakkaloglu, Turkey; P.M. Ferraro, Italy; J. Helve, Finland; J. Hogan, France; V. Kuzema, Latvia; B. Ponte, Switzerland; J.E. Sánchez-Álvarez, Spain; and M. Segelmark, Sweden.
ERA REGISTRY OFFICE STAFF
V.S. Stel (Managing Director), M.E. Astley, R. Boenink, B.A. Boerstra, M. Bonthuis, N.C. Chesnaye, R. Cornet, Ö. Gök Pasayigit, K.J. Jager (former staff), A. Kramer, I.R. Montez de Sousa (ESPN/ERA Registry staff), and A.J. Weerstra.
ACKNOWLEDGEMENTS
The ERA Registry would like to thank the patients and staff of all the dialysis and transplant units who have contributed data via their national and regional renal registries. In addition, we would like to thank the persons and organizations listed in the paragraph ‘affiliated registries’ for their contribution to the work of the ERA Registry.
FUNDING
The ERA Registry is funded by the European Renal Association (ERA). This article was written by R. Boenink et al. on behalf of the ERA Registry, which is an official body of the ERA. N.M. reports being board member for the NICE guidelines and Cyprus Renal Association. M.M.V. reports receiving grants from Instituto de Salud Carlos; consulting fees, payment for lectures, support for attending meetings and/or travel from Novo-Nordisk, Astra Zeneca, Boherinheim, Ingelheim-Lilly, Bayer, Menarini, Vifor; and is president of the Nephrology Madrilenian Society. A.M.D.Ś. reports being board member for the Voivodeship Consultant for Nephrology. M.F.S.R. reports receiving consulting fees from Fresenius, Baxter, Nipro; payment for lectures from Baxter, Fresenius, Physidia; and support for attending meetings and/or travel from Vifor, Fresenius, NovoNordisk; and is board member of Fresenius European Home Dialysis Advisory Board and the Direction Committee of the Spanish Society of Nephrology. M.O.V. reports receiving consulting fees of SANOFI and support for attending meetings and/or travel by Fressenius and Sandoz. A.Å. reports receiving grants from Oripharm and AstraZeneca; payments from Oripharm and Glenmark; and receipt of study drug from AstraZeneca. I.R. reports being president of the Czech Society of Nephrology and Secretary-Treasurer of ERA 2017-2024. M.O.R. reports payment for lectures from AstraZeneca; and is board member of AstraZeneca, ISN Eastern & Central Europe Regional Board, Ministry of Social Affairs of Estonia, and Nordic Peritoneal Dialysis Council. A.O. has received grants from Sanofi; is director of the Catedra Mundipharma-UAM of diabetic kidney disease and the Catedra AstraZeneca-UAM of chronic kidney disease and electrolytes; has received consultancy or speaker fees or travel support from Advicciene, Astellas, AstraZeneca, Amicus, Amgen, Fresenius Medical Care, GSK, Boehringer-Ingelheim, Bayer, Sanofi-Genzyme, Menarini, Kyowa Kirin, Alexion, Idorsia, Chiesi, Otsuka, Sysmex, Novo-Nordisk, and Vifor Fresenius Medical Care Renal Pharma; and is board member of ERA council and SOMANE. K.J.J. reports receiving funds from European Renal Association and European Society for Paediatric Nephrology, and is board member of SHARE RR working group. V.S.S. reports having support for the present manuscript from European Renal Association. All other co-authors declare that they have no relevant financial interests.
DATA AVAILABILITY STATEMENT
The data underlying this article have been published in the ERA Registry Annual Report 2022 (Supplementary Data).
CONFLICT OF INTEREST STATEMENT
None declared.
Appendix 1
Countries or regions providing individual patient data to the ERA Registry
Austria, Belgium (Dutch-speaking), Belgium (French-speaking), Bosnia and Herzegovina, Denmark, Estonia, France, Greece, Iceland, Montenegro, Norway, Romania, Serbia, Spain (Andalusia), Spain (Aragon), Spain (Asturias), Spain (Basque country), Spain (Canary Islands), Spain (Cantabria), Spain (Castile and León), Spain (Castile-La Mancha), Spain (Catalonia), Spain (Community of Madrid), Spain (Extremadura), Spain (Galicia), Spain (La Rioja), Spain (Murcia), Spain (Navarre), Spain (Valencian region), Sweden, Switzerland, the Netherlands, UK (England/Northern Ireland/Wales), and UK (Scotland).
Countries or regions providing aggregated data to the ERA Registry
Belarus, Croatia, Cyprus, Czech Republic, Finland, Hungary, Israel, Italy, Kosovo, Latvia, Lithuania, North Macedonia, Poland, Portugal, Slovakia, Spain, Tunisia (Sfax region), Turkey, and Ukraine.
Countries part of the European Union (EU27) population as of 1 February 2020 (used as a reference population)
Austria, Belgium, Bulgaria, Croatia, Cyprus, Czech Republic, Denmark, Estonia, Finland, France, Germany, Greece, Hungary, Ireland, Italy, Latvia, Lithuania, Luxembourg, Malta, the Netherlands, Poland, Portugal, Romania, Slovakia, Slovenia, Spain, and Sweden.
Appendix 2
Countries or regions included in the survival/expected remaining years of life analyses
Austria, Belgium (Dutch-speaking), Belgium (French-speaking), Bosnia and Herzegovina, Denmark, Estonia, France, Greece, Iceland, Norway, Spain (Andalusia), Spain (Aragon), Spain (Asturias), Spain (Basque country), Spain (Canary Islands), Spain (Cantabria), Spain (Castille and León), Spain (Castille-La Mancha), Spain (Catalonia), Spain (Community of Madrid), Spain (Extremadura), Spain (Galicia), Spain (Murcia), Spain (Navarre), Spain (Valencian Region), Sweden, the Netherlands, UK (England/Northern Ireland/Wales), and UK (Scotland).


Comments