


ABSTRACT
The anti-neutrophil cytoplasmic antibody (ANCA) renal risk score (ARRS) for predicting renal survival in ANCA-associated vasculitis (AAV) had not previously been validated in adults over 65 years of age and presenting impairments associated with an aging kidney, a high cardiovascular comorbidity burden and prevalent microscopic polyangiitis.
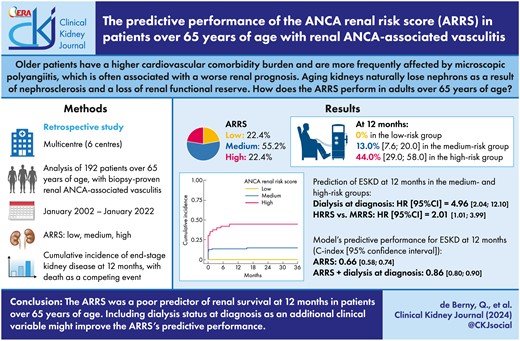
We retrospectively studied a cohort of 192 patients over 65 years of age [median (interquartile range) age: 73 (68–78) years], including 17.2% with renal-limited vasculitis, 49.5% with microscopic polyangiitis and 33.3% with granulomatosis with polyangiitis, at six centres in northern France. The primary study endpoint was the cumulative incidence of end-stage kidney disease (ESKD, maintenance of dialysis for at least 3 months) at 12 months, with death considered as a competing event.
The median serum creatinine concentration at diagnosis was 300 (202–502) µmol/L, and 48 (25.0%) patients required dialysis at presentation. The ARRS was high in 43 (22.4%) patients, medium in 106 (55.2%) and low in 43 (22.4%). The cumulative incidence of ESKD at 12 months was 0% in the low-risk group, 13.0% (interquartile range 7.6–20.0) in the medium-risk group and 44.0% (29.0–58.0) in the high-risk group (P < .001). In the subgroup of 149 patients presenting a medium or high score, the ARRS had a C-index of 0.66 (0.58–0.74) for the prediction of ESKD at 12 months; this rose to 0.86 (0.80–0.90) when dialysis status at diagnosis was included.
The ARRS was a poor predictor of kidney survival at 12 months among patients over 65 years of age with renal AAV involvement—especially in the high ARRS group. The addition of dialysis status at diagnosis as an additional clinical parameter might improve the predictive performance of the ARRS.
 Watch the video abstract of this contribution https://dbpia.nl.go.kr/ckj/pages/author_videos
What was known:
The cohorts used to validate the anti-neutrophil cytoplasmic antibody (ANCA) renal risk score (ARRS) were not focused on age groups over 65 years of age.
Older adults have a higher comorbidity burden and are more frequently affected by microscopic polyangiitis, which is often associated with worse renal survival.
Aging kidneys naturally lose nephrons as a result of nephrosclerosis (i.e. arteriosclerosis, glomerulosclerosis and tubular atrophy associated with interstitial fibrosis) and a loss of renal functional reserve.
This study adds:
This cohort study is the first to have investigated the ARRS specifically in adults over 65 years of age with ANCA-associated glomerulonephritis and a high cardiovascular comorbidity burden.
In the low ARRS group, none of the patients developed end-stage kidney disease (ESKD) at 12 months.
In patients with a high ARRS group, the 12-month renal survival rate was around 50%; the ARRS was poorly predictive in this group. Taking dialysis status at diagnosis into account significantly improved the prediction of the renal survival.
Potential impact:
A medium or high ARRS was poorly predictive of ESKD at 12 months in 65+ patients presenting ANCA-associated glomerulonephritis.
The need for dialysis at diagnosis is strongly associated with a worse renal prognosis and, by ameliorating the poor predictions of the ARRS, can guide the clinician's therapy-related decisions.
INTRODUCTION
Anti-neutrophil cytoplasmic antibody (ANCA)-associated vasculitis (AAV) is a systemic inflammatory disease affecting small vessels in general and those in the kidney in particular [1, 2]. The kidney damage in AAV is characterized by necrotizing crescentic glomerulonephritis and often leads to end-stage kidney disease (ESKD) requiring the initiation of kidney replacement therapy [3]. The incidence rate of the AAV peaks at 65–75 years of age [4], and the median age at diagnosis is 60 years. Microscopic polyangiitis is more predominant in the oldest individuals and features predominant renal involvement or renal-limited vasculitis [5, 6].
The renal prognosis has attracted much interest. In 2010, Berden et al. developed a classification based on glomerular features and that comprises four classes: sclerotic, focal, crescentic and mixed [7]. Several validation studies confirmed the poor renal prognosis for the sclerotic class and the good renal prognosis for the focal class [8–10]. Tanna et al. found that a lower percentage of normal glomeruli, a greater degree of tubular atrophy, anti-myeloperoxidase (MPO-ANCA) positivity, older age and a lower estimated glomerular filtration rate (eGFR) at presentation were associated with a poor renal prognosis [11]. In 2018, Brix et al. developed the ANCA renal risk score (ARRS) by simplifying the histological variables and adding the eGFR at diagnosis as a clinical parameter [12]. The ARRS has been validated in many cohort studies (Supplementary data, Table S1) [13–22]. In all the validation cohorts, however, the median age was below 70 years. Predicting the renal prognosis remains challenging in older adults because of their higher prevalences of cardiovascular comorbidities and pre-existing chronic kidney disease, which can interfere with the management of AAV and influence the renal prognosis [23]. Furthermore, older adults are characterized not only by kidney aging and the related glomerulosclerosis [24] but also by arteriosclerosis, tubular atrophy and interstitial fibrosis [25]. The prevalence of nephrosclerosis rises from 2.7% in healthy young adults to 73% in healthy older adults [25]. Interestingly, Denic et al. showed that aging is associated with impaired kidney function, independently of nephrosclerosis [26]. This age-associated loss of renal functional reserve might lead to a more severe impairment in renal function for a given level of damage in older patients, compared with younger patients. Discriminating between changes related to aging and changes relating to kidney disease is challenging because both can be present in older adults and can interfere with calculation of the ARRS; hence, focusing solely on renal lesions might lead to an erroneous evaluation of the renal prognosis.
In this context, the objective of the present study was to assess the validity of the ARRS for predicting the renal prognosis in patients over 65 years of age [23, 27] with AAV renal involvement and an inaugural flare-up of ANCA-associated glomerulonephritis.
MATERIALS AND METHODS
Population and study design
We conducted a multicentre, observational, retrospective study in nephrology and internal medicine departments at four university hospitals and two tertiary hospitals in northern France.
Older patients (over 65 years of age) with AAV (defined as microscopic polyangiitis, granulomatosis with polyangiitis or renal-limited vasculitis, according to the 2012 Chapel Hill consensus conference nomenclature [2]) and inaugural, biopsy-proven, renal involvement were included. The time of diagnosis was defined as the date of the renal biopsy (between January 2002 and January 2022). The study database was registered with the French National Data Protection Commission (Commission Nationale de l'Informatique et des Libertés, Paris, France; registration number: PI2022_843_0110).
Data collection
Data were collected from the date of ANCA-associated glomerulonephritis diagnosis onwards. Each patient's clinical, histological and laboratory data were retrieved retrospectively from the medical records held in each centre at presentation and during follow-up. At diagnosis, we recorded the age, sex, weight, height, body mass index and any history of the following conditions: chronic kidney disease [eGFR <60 mL/min/1.73 m2, according to the Modification of Diet in Renal Disease (MDRD) equation], chronic arterial hypertension, diabetes mellitus, tobacco use, dyslipidaemia, obesity (defined as a body mass index >30 kg/m2), coronaropathy, peripheral arterial disease of the lower extremities and stroke. Extrarenal manifestations of AAV were recorded, and the Birmingham Vasculitis Activity Score (BVAS) and the 2009 Five-Factor Score (FFS) [28] were then calculated for each patient. Each of the following factors counts for one point in the FFS: age over 65 years, cardiac symptoms, gastrointestinal symptoms, renal insufficiency (stabilized peak creatinine ≥150 µmol/L) and the absence of ear/nose/throat symptoms; the higher the total FFS, the greater the risk of 5-year mortality [28]. The laboratory variables included the level and type of ANCAs [anti-proteinase 3 (PR3) or anti-MPO], the serum creatinine level (SCr) at diagnosis, the serum levels of C-reactive protein and albumin, the haemoglobin level, the leukocyte and platelet counts, the urine proteinuria-to-creatinine ratio (uPCR), haematuria and leukocyturia. The induction and maintenance treatments for AAV were recorded.
In order to calculate the ARRS, the percentage of normal glomeruli (N) and the percentage of interstitial fibrosis/tubular atrophy (T) were extracted from the kidney biopsy reports. The MDRD equation was used to calculate eGFR at diagnosis (G), based on the peak SCr value at the time of renal biopsy or before the first dialysis session for those who needed kidney replacement therapy at presentation. The points attributed to each component were then summed to give the ARRS (i.e. the risk of ESKD) (Table 1). The kidney biopsies were also rated in four categories (focal, crescentic, mixed, and sclerotic) according to Berden et al.’s prognostic classification [7].
The ANCA renal risk score, according to Brix et al. [12].
| Components of the ARRS | Points |
|---|---|
| Percentage of normal glomeruli (N) | |
| N0 >25% | 0 |
| N1 10%–25% | 4 |
| N2 <10% | 6 |
| Percentage of tubular atrophy + interstitial fibrosis (T) | |
| T0 ≤25% | 0 |
| T1 >25% | 2 |
| Renal function at time of diagnosis (G) | |
| G0 >15 mL/min/1.73 m² | 0 |
| G1 ≤15 mL/min/1.73 m² | 3 |
| Risk group | Sum of points |
| Low | 0 |
| Medium | 2–7 |
| High | 8–11 |
N: the percentage of normal glomeruli, T: the percentage of tubular atrophy + interstitial fibrosis, G: the renal function at time of diagnosis. G is expressed as eGFR, expressed in mL/min/1.73 m².
During follow-up, we recorded the maintenance treatments, the requirement for dialysis and deaths. The SCr and eGFR were recorded at diagnosis and then 1, 6, 12, 24 and 36 months thereafter. The date of last follow-up corresponded to the patient's death or the last consultation with a physician before the end of the study (set to 31 December 2022).
Study endpoints
The primary endpoint was ESKD (defined as the initiation of dialysis and its maintenance for at least 3 months) at 12 months. Death was considered as a competing event.
Statistical analysis
Quantitative variables were described as the median [interquartile range (IQR)]. Qualitative variables were described as the frequency (percentage). The Kolmogorov–Smirnov test was used to determine whether or not variables were normally distributed. Non-parametric tests were used to compare values of quantitative variables: the Mann–Whitney test was applied to pairwise comparisons, and the Kruskal–Wallis test was applied to comparisons of three or more groups. The chi-squared test was applied to comparisons of qualitative data from two or more groups. The cumulative incidence of ESKD and the subdistribution hazard ratio (sHR) for ESKD at 12 months were investigated with univariate and multivariable competing-risks regression models and by applying Fine and Gray's method, with death considered as a competing event. The univariate and multivariable analyses included multiple imputations for missing data. When the proportion of missing data was below 20%, each missing value was imputed 10 times via predictive mean matching, using the multiple imputation by chained equations (MICE) package in R. Discriminative power was evaluated with the Harrell's concordance-index (C-index) and its 95% confidence interval (CI) [29]. As defined by Swets, a C-index above 0.8 was considered to reflect good prediction, and a C-index close to 0.5 was considered to reflect random prediction [30]. The threshold for statistical significance was set to P < .05. Statistical analyses were performed using R software (version 4.2.3) via the RStudio.Inc interface (version 2022.12.0) [31].
RESULTS
The study population
Of the 208 patients assessed for eligibility, 192 were analysed (Fig. 1 and Table 2). The median (IQR) age at diagnosis was 73 (68–78) years, and the male/female sex ratio was 103:89. Almost two thirds (65.2%) of the patients presented chronic arterial hypertension, 15.5% diabetes mellitus and 13.5% chronic kidney disease. Some 69.3% of the patients had MPO-ANCA, 28.6% had PR3-ANCA and 2.1% were ANCA-negative. Thirty-four (17.2%) patients presented renal-limited vasculitis. The most common extrarenal type of organ involvement was pulmonary disease, which affected 56 (33.1%) patients. The median (IQR) BVAS at diagnosis was 17 (14–21), and 75.0% of the patients had an FFS ≥3.
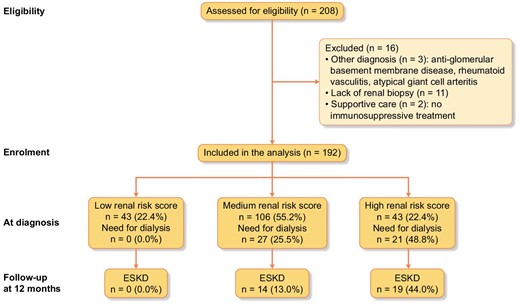
Study flow chart. The study flow chart shows the eligible population and the analysed population after the exclusion of patients with other diagnoses, the lack of a renal biopsy or receipt of supportive care.
Baseline clinical and laboratory variables.
| Variables | Missing data | Overall population, n = 192 | Low ARRS, n = 43 | Medium ARRS, n = 106 | High ARRS, n = 43 | P-value |
|---|---|---|---|---|---|---|
| Age (years) | 0 (0.0) | 73 (68–78) | 70 (68–75) | 74 (69–80) | 75 (70–79) | .04 |
| Male | 0 (0.0) | 103 (53.6) | 24 (55.8) | 52 (49.0) | 27 (62.8) | .30 |
| BMI (kg/m2), n = 179 | 13 (6.8) | 26.2 (23.4–28.6) | 27.0 (23.2–29.5) | 25.5 (23.1–28.4) | 26.6 (24.3–28.7) | .40 |
| Comorbidities | ||||||
| Arterial hypertension, n = 181 | 11 (5.7) | 118 (65.2) | 24 (57.1) | 66 (66.7) | 28 (70.0) | .43 |
| Diabetes mellitus, n = 181 | 11 (5.7) | 28 (15.5) | 8 (19.0) | 10 (10.1) | 10 (25.0) | .07 |
| Dyslipidaemia, n = 181 | 11 (5.7) | 52 (28.7) | 13 (30.9) | 29 (29.3) | 10 (25.0) | .82 |
| History of tobacco use, n = 181 | 11 (5.7) | 45 (24.9) | 7 (16.7) | 24 (24.2) | 14 (35.0) | .15 |
| Obesity, n = 179 | 13 (6.8) | 28 (16.2) | 9 (20.9) | 14 (14.1) | 5 (13.5) | .55 |
| Cardiovascular diseases, n = 181 | 11 (5.7) | 28 (15.5) | 2 (4.7) | 16 (16.1) | 10 (25.0) | .04 |
| Chronic kidney disease, n = 141 | 51 (26.5) | 19 (13.5) | 3 (7.7) | 10 (13.5) | 6 (21.4) | .27 |
| History of neoplasia, n = 179 | 13 (6.8) | 25 (14.0) | 9 (21.9) | 10 (10.1) | 6 (15.4) | .17 |
| Type of AAV | ||||||
| MPO/PR3/ANCA-negative | 0 (0.0) | 133/55/4 | 29/13/1 | 73/33/0 | 31/9/3 | .67 |
| Renal-limited vasculitis | 0 (0.0) | 33 (17.2) | 4 (9.3) | 19 (17.9) | 10 (23.2) | .22 |
| Microscopic polyangiitis | 0 (0.0) | 95 (49.5) | 23 (53.5) | 53 (50.0) | 19 (44.2) | .68 |
| Granulomatosis with polyangiitis | 0 (0.0) | 64 (33.3) | 16 (37.2) | 34 (32.1) | 14 (32.6) | .83 |
| Organ involvement | ||||||
| Skin | 0 (0.0) | 16 (9.5) | 5 (11.6) | 9 (9.9) | 2 (5.9) | .68 |
| Eyes | 0 (0.0) | 3 (1.8) | 1 (2.3) | 2 (2.2) | 0 (0.0) | .68 |
| ENT | 0 (0.0) | 37 (19.3) | 10 (23.2) | 20 (18.9) | 7 (16.3) | .71 |
| Pulmonary | 0 (0.0) | 56 (33.1) | 18 (41.8) | 27 (29.7) | 11 (31.4) | .36 |
| Cardiac | 0 (0.0) | 16 (8.3) | 1 (2.3) | 8 (7.5) | 7 (16.3) | .06 |
| Gastrointestinal | 0 (0.0) | 7 (3.6) | 1 (2.3) | 3 (2.8) | 3 (7.0) | .41 |
| Musculoskeletal | 0 (0.0) | 35 (20.8) | 6 (13.9) | 23 (25.3) | 6 (17.6) | .28 |
| Nervous system | 0 (0.0) | 20 (11.9) | 7 (16.3) | 10 (11.0) | 3 (8.8) | .56 |
| Renal involvement | ||||||
| SCr at diagnosis (µmol/L) | 0 (0.0) | 300 (202–502) | 191 (123–224) | 318 (232–509) | 500 (374–757) | <.001 |
| eGFR at diagnosis (mL/min/1.73 m2) | 0 (0.0) | 15.7 (9.5–26.9) | 31.3 (23.4–49.1) | 14.8 (9.1–22.4) | 9.5 (6.2–13.0) | <.001 |
| Requirement for dialysis at diagnosis | 0 (0.0) | 48 (25.0) | 0 (0.0) | 27 (25.5) | 21 (48.8) | <.001 |
| Haematuria (cells/mm3), n = 147 | 45 (23.4) | 200 (65–575) | 105 (50–361) | 200 (65–500) | 270 (115–800) | .10 |
| Leukocyturia (cells/mm3), n = 142 | 50 (26.0) | 35 (17–67) | 23 (16–43) | 35 (16–67) | 45 (25–95) | .046 |
| uPCR (mg/mmol), n = 159 | 33 (17.2) | 200 (101–300) | 113 (61–148) | 221 (110–373) | 227 (165–321) | <.001 |
| Inflammatory variables | ||||||
| Serum C-reactive protein (mg/L), n = 186 | 6 (4.7) | 81 (27–143) | 82 (19–127) | 72 (34–137) | 89 (30–164) | .76 |
| Serum albumin (g/L), n = 164 | 28 (14.6) | 28 (23–32) | 28 (23–31) | 29 (23–33) | 26 (22–30) | .25 |
| Haemoglobin (g/dL), n = 182 | 10 (5.2) | 9.5 (8.5–10.4) | 10.0 (8.1–11.4) | 9.7 (8.6–10.4) | 9.2 (8.7–9.9) | .21 |
| Leukocyte count (×109/L), n = 172 | 20 (10.4) | 9.5 (7.5–12.6) | 9.6 (7.3–12.4) | 9.5 (7.2–12.1) | 8.9 (7.7–14.6) | .66 |
| BVAS | 0 (0.0) | 17 (14–21) | 17 (15–21) | 16 (14–21) | 18 (13–22) | .62 |
| FFS ≥3 | 0 (0.0) | 144 (75.0) | 24 (55.8) | 83 (78.3) | 37 (86.0) | .003 |
| FFS-Kidney insufficiency (+1 point) | 0 (0.0) | 168 (87.5) | 26 (60.4) | 99 (93.4) | 43 (100.0) | <.001 |
| FFS-Cardiac symptoms (+1 point) | 0 (0.0) | 16 (8.3) | 1 (2.3) | 8 (7.5) | 7 (16.3) | .06 |
| FFS-Gastrointestinal symptoms (+1 point) | 0 (0.0) | 7 (3.6) | 1 (2.3) | 3 (2.8) | 3 (7.0) | .41 |
| FFS-Absence of ENT symptoms (+1 point) | 0 (0.0) | 155 (80.7) | 33 (76.7) | 86 (81.1) | 36 (83.7) | .71 |
BMI: body mass index, ENT: ear, nose, throat, SCr: serum creatinine.
Kidney function was severely impaired at diagnosis: 90 (46.3%) patients had an eGFR <15 mL/min/1.73 m2, and 48 (25.0%) required at least one dialysis session. A urine sediment analysis revealed that 93.9% of the patients had haematuria and 84.5% had leukocyturia. Seventy-six percent of the patients had a uPCR >100 mg/mmol, and 25.1% had a uPCR >300 mg/mmol.
The ARRS
Overall, the renal biopsies were representative, with a median (IQR) of 15 (11–20) glomeruli (Supplementary data, Table S2). With respect to the ARRS, 43 (22.4%) patients were in the low-risk category, 106 (55.2%) were in the medium-risk category and 43 (22.4%) were in the high-risk category. The patients in the low-risk group were younger (P = .04) (Table 2). At diagnosis, the median (IQR) eGFR was 31.3 (23.4–49.1), 14.8 (9.1–22.4) and 9.5 (6.2–13.0) mL/min/1.73 m2 in the low-, medium- and high-risk groups, respectively (P < .001). All patients who received acute dialysis at diagnosis had an eGFR below 15 mL/min/1.73 m2, resulting in the highest possible score (3 points) for the ARRS's G component. None of the patients in the low-risk group received acute dialysis at diagnosis, compared with 27 (25.5%) in the medium-risk group and 21 (48.8%) in the high-risk group (P < .001). The uPCR level was higher in the medium- and high-risk groups. There were no significant intergroup differences in inflammatory variables or the types of vasculitis.
Therapeutic management
Overall, 152 (81.7%) patients received methylprednisolone pulses, 131 (68.2%) received cyclophosphamide (CYC) (intravenously, in 95% of cases) and 44 (22.9%) received rituximab (RTX) (Supplementary data, Table S3). Eight patients received both CYC and RTX, and six of the latter were switched from CYC to RTX because of a history or the discovery of neoplasia (n = 3), cytopenia/infections (n = 1) and progressive vasculitis after CYC initiation (n = 2). Forty-seven (24.5%) patients received PLEXs; of these, 12 had alveolar haemorrhage and 35 had severe impaired renal function as the indication. The groups did not differ significantly with regard to the use of RTX (P = .10) or intravenous CYC (P = .35). However, the cumulative dose of CYC was lower in the high-risk group (P = .007; Supplementary data, Table S3).
Renal survival, as a function of the ARRS
The median (IQR) follow-up time was 75.5 (62.0–90.6) months. Thirty (16.0%) patients died during the first 12 months (Fig. 1); 10 of these were on dialysis at the time of death. The cumulative incidence of ESKD at 12 months was 0.0% in the low-risk group, 13.0% (7.6–20.0) in the medium-risk group and 44.0% (29.0–58.0) in the high-risk group (P < .001) (Fig. 2). Twenty-four patients were dialysis-dependent at 12 months: 12 in the high-risk group and 12 in the medium-risk group. The cumulative incidence of ESKD at 36 months was similar in the three groups: 0.0% in the low-risk group, 14.0% (8.4–22.0) in the medium-risk group and 44.0% (29.0–58.0) in the high-risk group (P < .001) (Fig. 2). Thirteen (27.0%) of the 48 patients requiring dialysis at diagnosis were weaned off it within the first 3 months: 5 out of 21 (23.8%) in the high-risk group and 8 out of 27 (29.6%) in the medium-risk group. Nine patients who had not been weaned off dialysis during the first 3 months died: four in the medium-risk group and five in the high-risk group. In each ARRS group, the eGFR had increased at 12 months (Supplementary data, Table S4).
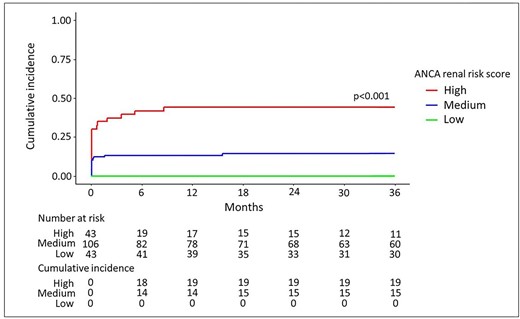
The cumulative incidence of ESKD at 36 months, according to the ARRS. Death was considered as a competing event, using a Fine–Gray model. The cumulative incidence of ESKD during the first 36 months of the study, as a function of the ARRS. The number of events and patients at risk are given under the figure.
Analysis of factors associated with ESKD at 12 months
Univariate Fine and Gray analyses were performed with the ARRS and the clinical and laboratory variables (Table 3). The low-risk group did not present any ESKD events and so was not included in the survival analysis. With a medium risk as reference, a high risk was associated with ESKD at 12 months [sHR (95% CI) = 3.66 (1.93–6.95); P < .001]. With regard to the association between each component of the ARRS and ESKD at 12 months, an eGFR <15 mL/min/1.73 m2 was the most predictive variable [sHR = 7.12 (2.53–20.10), P < .001]. The percentage of normal glomeruli was also a significant predictor [sHR = 1.55 (1.03–2.31), P = .034] but the percentage of tubular atrophy/interstitial fibrosis was not [sHR = 1.30 (0.68–2.46), P = .4]. The variable most strikingly associated with ESKD at 12 months was initiation of dialysis at diagnosis (figure 3), with an sHR of 11.4 (5.36–24.20) (P < .001). The eGFR at diagnosis, the FFS and diabetes mellitus were also significantly associated with ESKD at 12 months, whereas the other cardiovascular risk factors were not. Age at diagnosis, MPO-ANCA positivity and known chronic kidney disease were not associated with ESKD at 12 months.
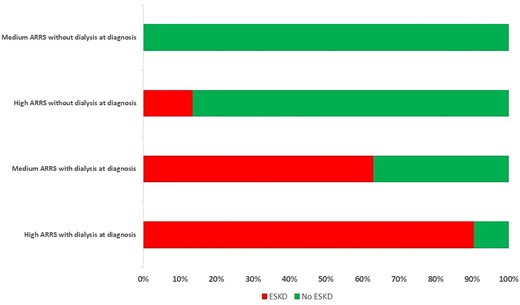
Progression to ESKD at 12 months, as a function of the ARRS and the requirement for dialysis at diagnosis. Patients who died after less than 3 months of dialysis were considered to have ESKD.
Analysis of factors associated with ESKD at 12 months.
| sHR (95% CI) | sHR (95% CI) | |||
|---|---|---|---|---|
| Variables | Univariate analysis | P-value | Multivariable analysis | P-value |
| Clinical variables | ||||
| Age (per/year) | 1.00 (0.95–1.05) | >.9 | ||
| Arterial hypertension | 0.68 (0.34–1.35) | .3 | ||
| Diabetes mellitus | 2.23 (1.03–4.87) | .043 | 0.82 (0.32–2.13) | .7 |
| History of tobacco use | 1.80 (0.91–3.58) | .09 | ||
| Dyslipidaemia | 1.31 (0.64–2.70) | .4 | ||
| Obesity | 1.60 (0.70–3.64) | .3 | ||
| Cardiovascular diseases | 1.58 (0.72–3.47) | .2 | ||
| CKD | 1.49 (0.58–3.82) | .4 | ||
| BVAS | 1.05 (0.99–1.11) | .12 | ||
| FFS | 2.66 (1.48–4.80) | <.001 | 2.29 (1.15–4.56) | .020 |
| Positivity for MPO | 1.39 (0.62–3.12) | .4 | ||
| Kidney function at diagnosis | ||||
| Serum creatinine (per 10 µmol/L increment) | 1.03 (1.02–1.04) | <.001 | 1.02 (1.01–1.03) | <.001 |
| eGFR | 0.83 (0.77–0.90) | <.001 | ||
| Requirement for dialysis at diagnosis | 11.4 (5.36–24.20) | <.001 | 4.96 (2.04–12.10) | <.001 |
| Proteinuria (>100 mg/mmol) | 2.16 (0.52–8.92) | .3 | ||
| ARRS variables | ||||
| The percentage of normal glomeruli | 1.55 (1.03–2.31) | .034 | ||
| The percentage of TA-IF | 1.30 (0.68–2.46) | .4 | ||
| eGFR <15 mL/min/1.73 m2 | 7.12 (2.53–20.10) | <.001 | ||
| ARRS | ||||
| Medium ARRS | 1.00 | 1.00 | ||
| High ARRS | 3.66 (1.93–6.95) | <.001 | 2.01 (1.01–3.99) | .047 |
The analysis was restricted to the 149 patients presenting a medium or high ARRS at diagnosis.
CKD: chronic kidney disease, TA-IF: tubular atrophy-interstitial fibrosis.
Multivariable analyses showed that dialysis at diagnosis, a high-risk ARRS and the FFS were independently associated with ESKD at 12 months, with sHRs (95% Cis) of, respectively, 4.96 (2.04–12.10) (P < .001), 2.01 (1.01–3.99) (P = .047) and 2.29 (1.15–4.56) (P = .020). Diabetes mellitus was not independently associated with ESKD at 12 months.
The predictive performance of the ARRS
The ARRS predicted 12-month renal survival in the overall population quite poorly, with a C-index of 0.75 (0.68–0.81). When considering the medium- and high-risk groups together, the ARRS was also poorly discriminant [C-index: 0.66 (0.58–0.74)]. With a view to improving the predictive ability of the ARRS, we built two other models by adding significant variables in a multivariable analysis. Model 3 (including the ARRS, the SCr at diagnosis, initiation of dialysis at diagnosis and the FFS) had the best predictive performance, with a C-index of 0.89 (0.83–0.93). However, Model 2 (including the ARRS and dialysis at diagnosis) achieved a similar level of performance, with a C-index of 0.86 (0.80–0.90) (Table 4).
Predictive performance of models for ESKD at 12 months.
| Models | C-index (95% CI) |
|---|---|
| Total cohort (n = 192) | |
| Model 1 (ARRS) | 0.75 (0.68–0.81) |
| Model 2 (Model 1 + dialysis at diagnosis) | 0.90 (0.85–0.93) |
| Model 3 (Model 2 + serum creatinine at diagnosis, FFS) | 0.92 (0.87–0.95) |
| Medium and high ARRS (n = 149) | |
| Model 1 (ARRS) | 0.66 (0.58–0.74) |
| Model 2 (Model 1 + dialysis at diagnosis) | 0.86 (0.80–0.90) |
| Model 3 (Model 2 + serum creatinine at diagnosis, FFS) | 0.89 (0.83–0.93) |
CI: confidence interval.
Sub-analysis of patients over 75 years of age
Seventy-six patients were over 75 years of age: 11 out of 76 (14.5%) in the low-risk group, 45 out of 76 (59.2%) in the medium-risk group and 20 out of 76 (26.3%) in the high-risk group. The cumulative incidence of ESKD at 12 months was 0.0% in the low-risk group, 18.0% (8.2–30.0) in the medium-risk group and 45.0% (22.0–65.0) in the high-risk group with still the same values at 24 and 36 months (P = .012; Supplementary data, Fig. A). In a univariate analysis, a high ARRS [HR = 2.55 (1.01–6.42), P = .048], dialysis at diagnosis [HR = 9.30 (5.50–67.50), P < .001] and the FFS [HR = 2.35 (1.00–5.54), P = .05] were associated with progression to ESKD at 12 months (Supplementary data, Table S5). In a multivariable analysis, only dialysis at diagnosis was still independently associated with ESKD at 12 months [HR = 18.40 (3.91–86.20), P = .001]. The predictive performance of the ARRS for 12-month renal survival was poor, with a C-index of 0.68 (0.57–0.78) in the cohort as a whole and 0.62 (0.49–0.73) in patients with a medium or high ARRS at diagnosis (Supplementary data, Table S6). The addition of dialysis at diagnosis raised the C-index to 0.90 (0.83–0.94) in the cohort as a whole and 0.88 (0.80–0.93) in patients with a medium or high ARRS at diagnosis.
DISCUSSION
To the best of our knowledge, our cohort study is the first to have investigated the prediction of kidney survival by the ARRS in a specific population of patients over 65 years of age at the time of the ANCA-associated glomerulonephritis diagnosis. The objective of our study was to investigate the ARRS's ability to predict renal survival in patients over 65 years of age, in whom comorbidities and frailty might interfere with the discriminative power of ARRS. The median age of our study population was 73 years, compared with, respectively, 66 and 67.5 years in Brix et al.’s initial training and validation cohorts [12].
Berti et al. compared a cohort of 58 incident AAV patients between 1996 and 2015 with the general population (matched for age and sex) and observed a similar prevalence of cardiovascular risk factors at baseline but a higher subsequent incidence of cardiovascular events in the patients [32]. We did not find any other literature comparisons of older and younger patients with AAV in terms of cardiovascular comorbidities at baseline. Interestingly, the patients in our high-risk group were older and more likely to have diabetes mellitus and cardiovascular diseases than those in the low- and medium-risk groups, which could have led to a loss of renal functional reserve. However, we did not observe a significant influence of cardiovascular comorbidities on the 12-month renal outcome.
In contrast to Brix et al.’s cohorts, our cohort was predominantly positive for MPO-ANCA (69.3% of the patients, vs 52.2% for Brix et al.). Compared with patients with PR3-ANCA, patients with MPO-ANCA tend to be older at diagnosis and are more likely to have kidney involvement. Bai et al. [19] and An et al. [21] also found that the ARRS imperfectly predicted renal survival (see Supplementary data, Table S1) in two Chinese cohorts with a high prevalence of MPO-ANCA (78.5% and 88.1%, respectively). Although Bai et al. and An et al. patients were younger (median age: 62 and 57.5 years, respectively) than our patients, the two studies’ results and our present results all suggest that the ARRS is less predictive in patients with MPO-ANCA.
The prevalences of the three ARRS strata observed in our population were in line with the literature data, which range from 14% to 40% for the low-risk category, from 30% to 60% for the medium-risk category and from 17% to 40% for the high-risk category [12–22]. The cumulative incidences of ESKD at 12 months in our study were similar to those reported previously for validation cohorts (2.8%–2.9% in the low-risk category, 8.5%–11.8% in the medium-risk category and 26.9%–61.1% in the high-risk category) [14, 20]. Importantly, the treatment modalities were quite similar in the medium- and high-risk groups, except that the cumulative dose of CYC was lower in the high-risk group. This finding was expected because the more severe impairment of kidney function led to a dose reduction, as recommended [33].
The severity of kidney disease and the initiation of dialysis at diagnosis were strongly correlated with renal survival at 12 months. It has already been reported that initial kidney function is the best predictor of the kidney prognosis [34, 35]. Patients with an initial need for dialysis may suffer from more advanced kidney disease, together with lower responsiveness to therapy [35]. Furthermore, these patients have a greater risk of adverse reactions to immunotherapy, which might also worsen their kidney prognosis. However, 27% of our patients were able to discontinue dialysis upon treatment, which is consistent with the value of 34% reported in a recent analysis of the European Vasculitis Society (EUVAS) database [36]. The urine sediment anomalies were more severe in the high-risk group. Although the baseline proteinuria level was not associated with the renal prognosis in a univariate analysis, it might constitute an additional prognostic variable [37].
None of the patients in the low-risk group presented ESKD at 12 months. However, a high ARRS poorly predicted ESKD at 12 months, with a cumulative incidence of 44.0% (29.0–58.0), and similar results were obtained when the analysis was restricted to patients over 75 years of age at diagnosis. This poor prediction in older adults with a high ARRS might be due to the concomitant presence of aging kidneys and AAV lesions, which interfere with calculation of the ARRS. The poor observed predictive ability of the ARRS prompted us to improve it by adding relevant clinical variables associated with ESKD at 12 months. Initiation of dialysis at diagnosis appeared to be the most relevant clinical variable and, indeed, significantly improved the prediction. Although the death rates were dissimilar in the three ARRS classes, death was considered as a competing event in the survival analysis using a Fine and Gray model (as recommended in older adults) [38]. Considering early, severe infection as a major risk factor for death during the first year (particularly in older adults presenting severe kidney involvement), this observation could help physicians to choose immunosuppressant-sparing strategies in patients with a high ARRS and dialysis at presentation [39–41].
The main limitation of our study was its retrospective design, which meant that we lacked some data—notably those regarding kidney function before the appearance of AAV. Secondly, the histologic ARRS classification was based on interpretations of the kidney biopsy by each centre's pathologist; the absence of central review might have led to interobserver variations—notably in assessment of the score's T component of the score. Thirdly, we used the MDRD formula to estimate the GFR, as in Brix et al.’s original study, however the Chronic Kidney Disease Epidemiology Collaboration formula is now used frequently in routine practice. Fourthly, we did not include the less clinically relevant low-risk group in the survival analysis, which limited our ability to compare our study cohort with the validation cohorts in the literature. Lastly, the study results were not validated externally in another cohort.
CONCLUSION
According to our present results, the ARRS was a poor predictor of kidney survival at 12 months among patients over 65 years of age with renal AAV involvement—especially those in the high-risk ARRS group. The inclusion of dialysis status at diagnosis as an additional clinical parameter might improve the predictive performance of the ARRS. A tool that better predicts renal survival might guide the clinician more effectively during the initial steps in patient management.
ACKNOWLEDGEMENTS
Part of these results was presented as an oral communication at the SFNDT 2022 Congress.
FUNDING
This research did not receive any specific funding from agencies or organizations in the public, commercial or not-for-profit sectors.
AUTHORS’ CONTRIBUTIONS
Q.B. and D.T.-B. designed the study, collected the data and wrote the manuscript. M.D. performed statistical analyses. R.M., T.Q., C.L., D.G., E.H., J.-B.G., C.C., A.F., V.G. and G.C. provided the data and revised the manuscript.
DATA AVAILABILITY STATEMENT
The datasets used and/or analysed during the current study are available from the corresponding author on reasonable request.
CONFLICT OF INTEREST STATEMENT
The authors declare that they have no conflicts of interest.


Comments