


ABSTRACT
The haemodialysis (HD) population is sedentary, with substantial cardiovascular disease risk. In the general population, small increases in daily step count associate with significant reductions in cardiovascular mortality. This study explores the relationship between daily step count and surrogate markers of cardiovascular disease, including left ventricular ejection fraction (LVEF) and native T1 (a marker of diffuse myocardial fibrosis), within the HD population.
This was a post hoc analysis of the association between daily step count and metabolic equivalent of task (MET) and prognostically important cardiac magnetic resonance imaging parameters from the CYCLE-HD study (ISRCTN11299707). Unadjusted linear regression and multiple linear regression adjusted for age, body mass index, dialysis vintage, haemoglobin, hypertension and ultrafiltration volume were performed. Significant relationships were explored with natural cubic spline models with four degrees of freedom (five knots).
A total of 107 participants were included [age 56.3 ± 14.1 years, 79 (73.8%) males]. The median daily step count was 2558 (interquartile range 1054–4352). There were significant associations between steps and LVEF (β = 0.292; P = .009) and steps and native T1 (β = −0.245; P = .035). Further modelling demonstrated most of the increase in LVEF occurred at up to 2000 steps/day and there was an inverse dose–response relationship between steps and native T1, with the most pronounced reduction in native T1 between ≈2500 and 6000 steps/day.
The results suggest an association between daily step count and parameters of cardiovascular health in the HD population. These findings support the recommendations for encouraging physical activity but are not the justification. Further research should evaluate whether a simple physical activity intervention improves cardiovascular outcomes in individuals receiving maintenance HD.
What was known:
Cardiovascular disease is the leading cause of mortality in the prevalent haemodialysis (HD) population.
Individuals receiving maintenance HD are sedentary compared with both the general population and earlier stages of chronic kidney disease.
Small increases in daily physical activity have been associated with significant reductions in all-cause and cardiovascular mortality in the general population.
This study adds:
Higher daily step count associated with an increase in left ventricular ejection fraction (LVEF) and reduced global native T1 time (a marker of diffuse myocardial fibrosis) on cardiac magnetic resonance imaging, two prognostically important cardiovascular disease markers.
The number of steps associated with improvements in LVEF and global native T1 time were modest: a marked increase in LVEF was associated with 0–2000 steps/day and the most pronounced reduction in native T1 was associated with 2500–6000 steps/day.
Potential impact:
The findings suggest that small improvements in daily physical activity levels potentially have a large impact on cardiovascular health, but further work through longitudinal studies and randomized clinical trials are needed to confirm the associations.
For many, increasing the daily step count is an accessible, cost-effective and easy way to enhance daily physical activity levels.
Clinicians should be confident in advising increasing physical activity levels in the HD population, with the knowledge that those starting from a low-level may stand to benefit the most.
INTRODUCTION
Individuals with end-stage kidney disease (ESKD) receiving haemodialysis (HD) have a significantly increased risk of cardiovascular disease (CVD) [1], which is the leading cause of death in this population [2]. Strategies to mitigate CVD risk have little impact, as pathophysiological processes are driven by non-traditional CVD risk factors such as chronic inflammation, uraemia, anaemia, renal bone disease and HD-induced myocardial stunning [3–5]. Subsequently, the myocardium undergoes remodelling, resulting in cardiomyopathy, impaired left ventricular function and myocardial fibrosis [3].
Individuals receiving maintenance HD are physically inactive compared with both the general population and those with earlier stages of chronic kidney disease (CKD) [6, 7]. Low levels of physical activity strongly associate with CVD and mortality in this population [8–10]. However, the precise relationship between physical activity and CVD remains unclear. In the general population without known CVD, regular physical activity has been associated with the preservation of surrogate markers for cardiovascular health on cardiac magnetic resonance imaging (CMRI), e.g. left ventricular ejection fraction (LVEF), compared with those who are physically inactive [11]. Furthermore, small increases in daily physical activity with a daily step count ≥2300/day associates with reductions in all-cause and CVD mortality in the general population [12]. Currently it is unclear if higher levels of physical activity associate with improved measures of cardiovascular health in the HD population.
In line with the UK Chief Medical Officers guideline [13], the UK Kidney Association (UKKA) clinical practice guideline of exercise and lifestyle in CKD recommends that individuals receiving HD should aim for 150 minutes of moderate-intensity activity per week (or 75 minutes of vigorous activity) [13]. These recommendations are based largely on cohort data from individuals who have self-reported physical activity levels [8, 10, 14], so despite being graded as a strong recommendation, they are of low-quality evidence [13]. It has previously been suggested that 3000–4000 steps/day reliably approximates 30 minutes of continuous moderate-intensity walking (as recommended by the guidelines) [15] and that individuals living with chronic disease should aim for at least 5000 steps/day in total [16], as this level of activity has been proposed as the threshold for a ‘sedentary lifestyle index’. Further understanding of the level of physical activity that associates with improved cardiovascular health in the ESKD population is required.
This study investigated the relationship between levels of physical activity, assessed by average steps per day and metabolic equivalent of task (MET), and CMRI measures of CVD in individuals receiving maintenance in-centre HD.
MATERIALS AND METHODS
This is a post hoc analysis of baseline data from participants enrolled in the CYCLE-HD trial (ISRCTN11299707; Improving cardiovascular health in dialysis patients using a structured programme of exercise) [17]. Detailed descriptions of the trial design, including specific inclusion and exclusion criteria and data collection procedures, are described elsewhere [18]. Briefly, individuals ≥18 years of age receiving maintenance HD for ≥3 months were eligible for inclusion. Major exclusion criteria included inability to participate in the current exercise program due to perceived physical or psychological barriers, unable to undergo CMRI and unfit to undertake exercise according to the American College of Sports Medicine guidelines [19]. As part of their baseline assessment, participants were comprehensively phenotyped, including with CMRI (the gold standard for assessment of cardiovascular structure and function) and objectively derived physical activity from accelerometers. The trial was given ethical approval by the National Health Service (NHS) Research Ethics Committee East Midlands (Northampton, UK; REC ref: 14/EM/1190). The trial was conducted according to the Declaration of Helsinki and all participants provided written informed consent.
Sample size
The CYCLE-HD trial recruited 155 maintenance HD patients [17, 18]. No a priori sample size calculation was completed for this post hoc analysis.
Physical activity
Levels of physical activity were measured using the SenseWear Pro3 Armband (BodyMedia, Pittsburgh, PA, USA), an accelerometer with physiological sensors. Participants were instructed to wear the accelerometer for 7 days on the upper arm (the opposite arm of their vascular access). They were instructed to remove the equipment only for bathing or any other water activity. Accelerometer data were included for analysis as long as it was worn for a minimum of 3 days and included at least one HD day and two non-HD days as previously recommended [20]. The total steps taken and average METs were calculated. For each participant, steps per day data were calculated as the average for total days worn (i.e. the total number of steps divided by days worn).
Cardiovascular outcome assessment
Participants underwent CMRI as part of the CYCLE-HD trial on a Skyra 3T platform (Siemens Medical Imaging, Erlangen, Germany). Scans were performed on non-dialysis days 18–24 hours after the most recent dialysis treatment, avoiding the long interdialytic gap, to standardise fluid status. Scans were anonymised before being randomly allocated for off-line analysis by a single, blinded assessor. LVEF, LV mass, LV mass index (LVMI), LV mass/LV end diastolic volume (LVM/LVEDV), aortic pulse wave velocity (PWV) and native T1 mapping were acquired using CMRI, with acquisition and analysis performed in accordance with international recommendations [21]. Full details of the acquisition sequences and analysis of CMRI parameters have been published previously [18].
Data collection time frame
Baseline data only (completed prior to randomisation) were used for this post hoc analysis. Follow-up data were not used due to the impact of the intervention (intradialytic cycling) on the CMRI surrogate markers of CVD.
Statistical analysis
All data are presented as mean [± standard deviation (SD)] or median [interquartile range (IQR)]. Data were checked for normality by observing the histogram plot and the P-value from the Shapiro–Wilk test. Unadjusted linear regression of the physical activity and CMRI parameters were performed. Significant associations were further explored using a multiple linear regression, adjusting for age, body mass index (BMI), hypertension, haemoglobin level, dialysis vintage and ultrafiltration volume (i.e. dialysis-specific non-traditional cardiovascular risk factors). To further investigate associations between CMRI and physical activity parameters, the relationships were modelled using natural cubic splines with a range of degrees of freedom (2–7) considered. Spline modelling was completed using RStudio (Posit Software, Boston, MA, USA). All other analyses were performed using SPSS for Windows version 28.0 (IBM, Armonk, NY, USA). Statistical significance was accepted at P < .05.
RESULTS
The CYCLE-HD trial enrolled 155 participants from March 2015 through April 2018; 130 participants completed the baseline assessments and were randomised to either the intervention or control (n = 65 in each group). There were 108 participants with physical activity data (average steps per day and METS) and CMRI parameters. One participant completed an average of 19 905 steps/day, which was +2.5 SD away from the group mean. This participant was removed from the analysis.
The demographics of the remaining 107 participants included in this post hoc analysis are presented in Table 1. The median daily step count was 2558 (IQR 1054–4352) and the median METs was 1.2 (IQR 1.0–1.4).
Demographics of CYCLE-HD participants (N = 107) at baseline with CMRI and average daily steps data.
| Variable | Values |
|---|---|
| Age (years), mean ± SD | 56.3 ± 14.1 |
| Male, n (%) | 79 (73.8) |
| Dialysis vintage (years), median (IQR) | 1.1 (0.4–3.4) |
| Interdialytic SBP (mmHg), mean ± SD | 146 ± 36 |
| Interdialytic DBP (mmHg), mean ± SD | 69 ± 16 |
| Pre-dialysis SBP (mmHg), mean ± SD | 139 ± 22 |
| Pre-dialysis DBP (mmHg), mean ± SD | 73 ± 12 |
| Haemoglobin (g/l), mean ± SD | 113 ± 13 |
| Parathyroid hormone (pmol/l), median (IQR) | 29.2 (14.4–77) |
| Diabetes mellitus diagnosis, n (%) | 39 (36.4) |
| CVDa, n (%) | 77 (72.0) |
| Smoker (current or previous), n (%) | 54 (50.5) |
| BMI (kg/m2), median (IQR) | 26.3 (23.0–29.8) |
| Ultrafiltration volume (ml), median (IQR) | 2350 (1600–2800) |
| Daily step count, median (IQR) | 2558 (1054–4352) |
| METs, median (IQR) | 1.2 (1.0–1.4) |
| LVEF (%),median (IQR) | 55.9 (47.7–61.0) |
SBP: systolic blood pressure; DBP: diastolic blood pressure.
aHistory of CVD refers to one or more of peripheral vascular disease, atrial fibrillation, myocardial infarction, ischaemic heart disease, heart failure, stroke or trans-ischaemic attack and hypertension.
Associations between steps per day and CMRI parameters
There was a significant positive association between baseline step count and LVEF (β = 0.247; P = .010). There was a significant negative association between baseline step count and native T1 (β = −0.272; P = .006). There were no significant associations between other CMRI variables and step count (Table 2).
Unadjusted linear regression between CMRI parameters of physical activity: average daily step counts and METs.
| Baseline steps | Baseline METs | |||
|---|---|---|---|---|
| CMRI parameter | β | P-value | β | P-value |
| LVEF (%) | 0.247 | .010* | 0.109 | .263 |
| LVM (g) | −0.031 | .754 | 0.119 | .222 |
| LVEDV (g/ml) | −0.043 | .658 | −0.024 | .804 |
| Global native T1 (msec) | −0.272 | .006* | −0.213 | .032* |
| PWV (per msec) | −0.169 | .098 | −0.288 | .004* |
aDenotes significant associations.
After adjustment for covariates (age, BMI, sex, history of CVD, haemoglobin levels, dialysis vintage and ultrafiltration volume), the positive association between baseline steps and LVEF (β = 0.292; P = .009) persisted (Table 3). Further modelling of this relationship using a natural cubic spline model with five knots (three internal and two boundary knots) showed that most of the increase in LVEF occurred between 0 and 2000 steps/day (Fig. 1A). Four and five knots produced similar results, giving a relationship beyond a linear one but not appearing to overfit the data. The negative association between baseline steps and native T1 (β = −0.245; P = .035) also persisted (Table 4). Natural cubic spline models showed an inverse dose–response association with the most pronounced reduction in native T1, with the sharpest phase of the curve between ≈2500 and 6000 steps/day (Fig. 1B).
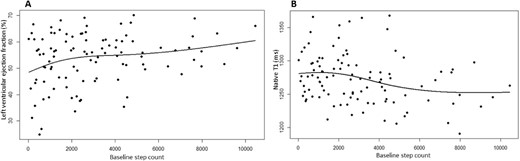
(A) Modelling of baseline step count against LVEF. The increase in LVEF occurs at 0–2000 steps. (B) Modelling of baseline step count against global native T1. The decrease in native T1 time occurs at 2500–5000 steps.
Association between LVEF and baseline step count, adjusted for covariates (age, BMI, sex, history of CVD, haemoglobin level, dialysis vintage and ultrafiltration volume).
| Model summary | ||||||||
|---|---|---|---|---|---|---|---|---|
| R | R2 | Adjusted R2 | SE | R2 change | ANOVA F | df1 | df2 | P-value |
| 0.419 | 0.176 | 0.108 | 9.204 | 0.176 | 2.587 | 8 | 97 | 0.013* |
| Independent variable | β | P-value | ||||||
| Baseline steps | 0.292 | .009* | ||||||
| Age | 0.058 | .603 | ||||||
| BMI | 0.115 | .227 | ||||||
| Sex | 0.297 | .003* | ||||||
| CVD | 0.006 | .952 | ||||||
| Haemoglobin level | 0.025 | .798 | ||||||
| Dialysis vintage | 0.053 | .582 | ||||||
| Ultrafiltration volume | −0.016 | .873 | ||||||
ANOVA: analysis of variance; df: degrees of freedom; SE: standard error.
*Denotes significant associations.
Association between global native T1 and baseline step count, adjusted for covariates (age, BMI, sex, history of CVD, haemoglobin levels, dialysis vintage and ultrafiltration volume).
| Model summary | ||||||||
|---|---|---|---|---|---|---|---|---|
| R | R2 | Adjusted R2 | SE | R2 change | ANOVA F | df1 | df2 | P-value |
| 0.391 | 0.153 | 0.079 | 36.046 | 0.153 | 2.069 | 8 | 92 | 0.047* |
| Independent variable | β | P-value | ||||||
| Baseline steps | −0.245 | .035* | ||||||
| Age | 0.088 | .449 | ||||||
| BMI | −0.250 | .013* | ||||||
| Sex | −0.022 | .832 | ||||||
| CVD | −0.095 | .338 | ||||||
| Haemoglobin level | −0.057 | .568 | ||||||
| Dialysis vintage | −0.015 | .878 | ||||||
| Ultrafiltration volume | 0.016 | .874 | ||||||
ANOVA: analysis of variance; df: degrees of freedom; SE: standard error.
*Denotes significant associations.
Association between METs and CMRI parameters
There were significant negative associations between METs and native T1 (β = −0.213; P = .032) and PWV (β = −0.288; P = −0.004). The remaining CMRI markers did not have a significant association with baseline METs (Table 2).
On adjustment for covariates (age, BMI, sex, history of CVD, haemoglobin levels, dialysis vintage and ultrafiltration volume), the association between METs and native T1 (β = −0.170; P = .187) and PWV (β = −0.031, P = .786) were no longer significant.
DISCUSSION
This study demonstrates that individuals receiving in-centre maintenance HD are inactive, with a low average daily step count and METs. Higher daily step count is associated with an increase in LVEF and reduced global native T1 time (a marker of diffuse myocardial fibrosis [22, 23]); this association remained while controlling for some non-traditional CVD risk factors (dialysis vintage and ultrafiltration volume) unique to the HD population. Further modelling of the data suggested a marked increase in LVEF was associated with 0–2000 steps/day and the most pronounced reduction in native T1 was associated with 2500–6000 steps/day.
The findings from this study corroborate the physical activity levels previously reported for chronic disease and HD populations. There is a clear relationship between low physical activity levels and increased risk of CVD [24]. Chronic non-communicable diseases are often characterised by physical inactivity, promoting deconditioning and loss of functional capacity [25]. This downward spiral of physical inactivity and endemic sedentary behaviour is well recognised in the HD population [7], with physical activity levels well below the healthy sedentary population [6] and associated with both cardiovascular and all-cause mortality [8, 9, 26].
The UKKA guideline takes into consideration the location of activity (i.e. intradialytic versus interdialytic activity) and suggests that some physical activity is better than none, however, it provides neither guidance nor suggestions on the type of activity and advises professional supervision while increasing activity levels [13]. Emerging evidence questions aspects of these recommendations and undermines the definition of the sedentary behaviour index [16]. A meta-analysis of >225 000 participants from six countries demonstrated an increment in daily step count of 500 reduced the risk of cardiovascular mortality by 7% and cardiovascular health benefits were observed from a daily step count ≥2500 [12]. Similarly, in a large cohort study of >70 000 participants from the UK biobank, a daily step count ≥2200 was associated with lower mortality and CVD risk [27]. The results of this exploratory study support these findings within a prevalent HD cohort: small increases in steps per day within the individual's usual and (most probably) unsupervised/personal time is associated with improved surrogates of CVD.
Increased physical activity levels via low-impact aerobic exercise, such as walking, improves traditional CVD risk factors, including lipid levels, insulin sensitivity, blood pressure and weight management [28]. Strategies to mitigate traditional CVD risk factors do not improve cardiovascular outcomes in the HD population as they do in the general population [29, 30]. Non-traditional risk factors, such as chronic inflammation and HD-induced myocardial stunning, are major contributors to pathological myocardial remodelling [5, 31, 32]. Performing physical activity through planned exercise may mediate reductions in some non-traditional risk factors through a number of mechanisms, including improved intradialytic cardiovascular stability [33, 34], release of cardioprotective myokines from skeletal muscle [35], reductions in oxidative stress, shifts to less inflammatory cell and cytokine profiles and reduced recruitment of monocytes into adipose tissue [36]. Thus it is biologically plausible that individuals receiving maintenance HD with higher physical activity levels have less evidence of structural CVD. This is corroborated by the findings of the main CYCLE-HD trial where intradialytic exercise significantly reduced LVM and native T1 mapping [17].
There was not a significant association between participants’ METs and the cardiovascular surrogate markers on CMRI, LVEF and native T1 mapping. The median METs for the cohort was 1.2 (IQR 1.0–1.4). This low METs alongside the narrow variance reflects the majority of participants’ physical activity levels were of low intensity. In contrast, there was greater variance in the volume of physical activity, as reflected by the median daily step count of 2558 (IQR 1054–4352). This may partly explain the lack of association between intensity of the physical activity (as represented by METs) and the CMRI parameters.
There are a number of limitations to this study that need to be considered when interpreting the findings. This study is an exploratory post hoc analysis; it was not a pre-specified assessment of the original CYCLE-HD data. However, the data were collected prospectively from multiple dialysis units. There is a lack of granularity in the steps data; it is unknown how, when and at what intensity the steps were completed, there is little insight into the physical activity behaviour patterns (e.g. planned exercise versus habitual physical activity, sitting and standing durations etc.) and it is not possible to account for unrecorded activity. There are other potential confounding factors which it was not possible to account for, including cardiac biomarkers (e.g. natriuretic peptides) and osteoarticular disorders that may influence daily physical activity levels. The outcome measures considered are surrogate markers for CVD and not clinical endpoints, although they are predictors of cardiovascular events. Importantly, this is a cross-sectional study and direction of causation cannot be inferred. Findings may also be attributable to reverse causality, whereby improved cardiovascular status facilitates increased physical activity levels.
Despite the limitations, these findings have positive implications for clinical practice and further research. Behaviour change interventions that focus on specific health-related behaviours are often unsuccessful [37] and the barriers to exercise within the HD population are multifaceted [38]. The UKKA physical activity guidelines are likely to be a daunting prospect for patients who are not currently active, and despite significant efforts within the renal community to incorporate exercise into usual dialysis care (i.e. intradialytic cycling), implementation into clinical practice is lagging. The number of steps per day that associates with improved measures of CVD was relatively low and far below the recommendation for physical activity in the UKKA guideline. This supports the idea that the most physically inactive have the most to gain from increasing their activity levels and even small increases could have an important effect. Certainly these data support a move away from threshold-based recommendations towards the message that some physical activity is better than none [13]. Further research would involve assessing the impact of a simple physical activity intervention on cardiovascular and mortality endpoints through a randomised controlled trial.
CONCLUSION
The HD population is sedentary, with an overwhelming burden of CVD. Daily step count associates with important structural and functional measures of CVD; benefit was observed at daily step counts >2000, well below the guideline recommendations for physical activity. Lower daily step count associates with important structural and functional measures of CVD, with most of the benefit observed at low levels of daily steps, well below guideline recommendations. For many patients, increasing daily step count is achievable, cost-effective and potentially accessible. Work is needed to explore these findings in longitudinal and interventional studies and to determine the impact on important patient-centred outcomes such as survival and cardiovascular events. Clinicians can be confident in advising increasing physical activity levels, with the knowledge that those starting from a low-level may stand to benefit the most and, for these individuals, small improvements may have large effects.
ACKNOWLEDGEMENTS
The CYCLE-HD study was given ethical approval by the NHS Research Ethics Committee East Midlands (Northampton, UK; REC ref: 14/EM/1190). We are incredibly grateful to the patients who participated in the CYCLE-HD randomised controlled trial and for patients’ contributions to Patient Participation Involvement and Engagement forums. We would like to thank the CYCLE-HD study investigators, Trial Steering Committee and Data Safety and Monitoring Committee.
FUNDING
This work falls under the portfolio of research conducted within the National Institute for Health and Care Research (NIHR) Leicester Biomedical Research Centre. This article presents independent research funded by the NIHR in the UK (grant CS-2013-13-014, to J.O.B.) and supported by Kidney Research UK. The views expressed are those of the authors and not necessarily those of the NHS, the NIHR or the Department of Health and Social Care. After the award of funding, the funder (NIHR) did not have any input into trial design, data collection, data analysis, data interpretation, writing the report or decision to submit for publication. This research has no relationship with industry.
AUTHORS’ CONTRIBUTIONS
K.L.H. and D.S.M. conceived the post hoc analysis plan and led the preparation of the manuscript. J.O.B. is the chief investigator and award holder for the CYCLE-HD randomised controlled trial, conceived the CYCLE-HD study and was responsible for the oversight of manuscript development. M.G.B. is a CYCLE-HD study investigator and was responsible for the oversight of manuscript development. D.C., P.H., A.C.S., H.M.L.Y. and D.S.M. are CYCLE-HD study investigators. L.A., L.J.G. and R.S. were statistical leads. S.B. was responsible for database management. S.F.A. contributed to the post hoc study concept and is a member of the wider research team. R.E.B. and C.J.L. are members of the wider research team. All authors reviewed the final manuscript and agreed to publication.
DATA AVAILABILITY STATEMENT
Deidentified individual participant data collected for the study and a data dictionary defining each field in the set will be made available to others upon specific request to the chief investigator and corresponding author, provided all regulatory and data sharing approvals are obtained afterwards.
CONFLICT OF INTEREST STATEMENT
None declared.


Comments