


ABSTRACT
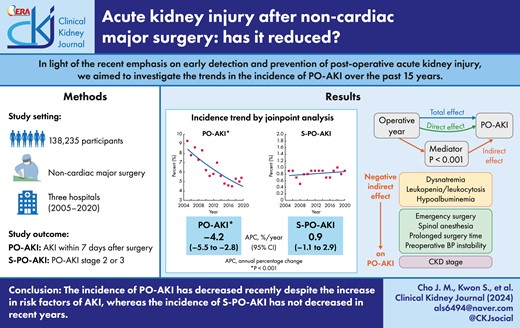
It remains unclear whether the incidence of post-operative acute kidney injury (PO-AKI) has been reduced despite the recent emphasis on its early recognition and prevention in clinical practice. We aimed to investigate the trend in the incidence of PO-AKI and to identify the associated factors affecting its changes.
We gathered clinical data from patients who underwent non-cardiac major surgeries at three referral hospitals from 2005 to 2020. PO-AKI was defined as KDIGO AKI criteria within 7 days after surgery. Severe PO-AKI (S-PO-AKI) was defined as stage 2 or 3 AKI. The temporal change of PO-AKI was evaluated by joinpoint regression analysis and multivariable logistic regression based on a 3-year interval.
Among 138 235 patients, 8156 (5.9%) PO-AKI and 1127 (0.8%) S-PO-AKI occurred, respectively. The patients enrolled in recent years were older and more were women. They had more comorbidities and a higher PO-AKI risk compared with those included in past years. As time passed, the PO-AKI incidence decreased from 8.6% in 2005–07 to 5.1% in 2017–20, whereas S-PO-AKI incidence did not change (0.8% to 0.9%). In joinpoint analysis, PO-AKI incidence tended to decrease with annual percentage change (APC) of –4.2% per year [95% confidence interval (CI) –5.5% to –2.8%, P-value <.001), although S-PO-AKI did not (APC 0.9%, 95% CI –1.1 to 2.9%, P-value = .347). Similarly, the overall PO-AKI incidence decreased but S-PO-AKI did not, even after adjusting covariables.
The incidence of PO-AKI has decreased recently despite the increase in known risk factors; however, the incidence of S-PO-AKI has not decreased in recent years.
ClinicalTrials.gov Identifier: NCT05986474. Name of registry: Development of Synthetic Medical Data Generation Technology to Predict Postoperative Complications. URL: https://classic.clinicaltrials.gov/ct2/show/NCT05986474. Date of registration: 14 August 2023. Date of enrollment of the first participant to the trial: 27 September 2022, retrospectively registered.
INTRODUCTION
Acute kidney injury (AKI) is a critical condition linked to adverse outcomes in hospitalized patients. The impact of AKI is widely recognized and includes an increased risk of mortality [1], a prolonged hospital stay [2], higher medical costs [3], a worse quality of life [4], and subsequent development and progression of chronic kidney disease (CKD) [5, 6]. Because there is currently no specific treatment for AKI, the management primarily involves conservative therapies that address its underlying cause [7]. Therefore, early recognition of patients at high risk of AKI and implementing preventative strategies are considered the best approach to improving patient outcomes [8]. Indeed, various strategies have been attempted to reduce the incidence of AKI, such as identifying risk factors, adjusting correctable clinical factors, and constructing prediction models [9-12] and alert systems in clinical settings [13, 14]. Previously, we constructed the Simple Postoperative AKI Risk (SPARK) index in an effort to develop a practical prediction tool for post-operative AKI (PO-AKI) in patients undergoing non-cardiac surgery [9].
Among various common clinical settings susceptible to the development of in-hospital AKI, PO-AKI after non-cardiac major surgery is of particular interest due to its potential for prevention. PO-AKI is a multifactorial clinical syndrome associated with various perioperative and surgical factors, such as patient comorbidities, exposure to nephrotoxins and intraoperative hemodynamic instability. These factors contribute to reduced kidney microcirculation, ischemic injury and direct toxic injury, leading to adverse kidney and patient outcomes [15]. Therefore, a comprehensive understanding of these risk factors can help stratify the risk of PO-AKI in patients preparing for surgeries, enabling targeted interventions and personalized post-operative management.
Despite the above efforts to reduce AKI, there are limited data on whether these efforts have been successful in real-world settings. A meta-analysis reported a pooled incidence rate of AKI was 21.6% in adults worldwide [16]. However, the temporal trend of AKI incidence remained unclear due to potential bias from simultaneous changes in AKI awareness, monitoring, recognition and clinical practice [17–20]. Limited large-population trend studies have been conducted on PO-AKI of patients receiving non-cardiac major surgeries; however, it is an area of growing interest [15].
Therefore, we expanded our existing SPARK cohort to a large, multicenter cohort, including patients who underwent major non-cardiac surgery. Our goal was to examine the trend in PO-AKI incidence and identify the contributing factors that impacted the sequential changes in PO-AKI incidence. We expected that the increased awareness of PO-AKI and its risk factors in the medical society may have affected physicians’ clinical practice, leading to a decreased incidence of PO-AKI in patients who received major non-cardiac surgeries over the past 15 years.
MATERIALS AND METHODS
Ethical considerations
This study was conducted in accordance with the principles of the Declaration of Helsinki and was approved by the Institutional Review Boards (IRBs) of three participating centers on 26 March 2021: Seoul National University Hospital (SNUH, IRB No. H-2102-192-1203), Seoul National University Bundang Hospital (SNUBH, IRB No. B-2107-698-401) and Seoul Metropolitan Government Boramae Medical Center (SMG-BMC, IRB No. 20-2021-57). The IRBs waived patient informed consent because of the retrospective observational study setting without medical intervention.
Study design and cohort
We conducted a retrospective observational cohort study from three referral hospitals in South Korea. Surgeries after introducing electronic health records in each hospital were considered as follows: Seoul National University Hospital (SNUH), 2005–20; Seoul National University Bundang Hospital (SNUBH): 2003–20; and Seoul Metropolitan Government Boramae Medical Center (SMG-BMC), 2013–20, to obtain large-scale and precise perioperative information. The difference in data collection years is attributed to the differing adoption period of the electronic medical record system. Patients over 18 years old and the first surgery information were included if a patient underwent multiple surgeries during the study period. The non-cardiac surgery from five departments [general surgery, obstetrics and gynecology (OBGY), urologic surgery, neurosurgery, and orthopedic surgery] were enrolled. Major surgery was defined as the operation performed for >1 h of actual anesthetic time [9].
The patients who had the following criteria were excluded: (i) no information on baseline (≤90 days before surgery) or follow-up (≤7 days after surgery) renal function; (ii) exclusive surgery, including surgeries of deceased patients or surgery that directly affect renal function (partial or total nephrectomy, kidney transplantation); (iii) preoperative advanced kidney dysfunction, including preoperative serum creatinine (SCr) ≥4.0 mg/dL, baseline estimated glomerular filtration rate (eGFR) <15 mL/min/1.73 m2, preoperative kidney replacement therapy history, or AKI history within 2 weeks of surgery; (iv) surgery other than general or spinal anesthesia (local anesthesia or monitored anesthesia care); and (v) missing covariates. The eGFR was calculated by Chronic Kidney Disease Epidemiology Collaboration (CKD-EPI) equation using isotope dilution mass spectrometry SCr levels from 2011 to 2020 [21]. The study population was categorized into five groups by 3-year interval (2005–2007, 2008–2010, 2011–2013, 2014–2016 and 2017–2020) to illuminate trends by time progress. Data collection and covariate definition details are described in Supplementary data, Data S1.
Study outcomes
The present study's first aim is to find a temporal trend of PO-AKI for 15 years between 2005 and 2020. PO-AKI was defined as an event satisfying KDIGO AKI criteria, either (i) an increase in SCr by 0.3 mg/dL or more within 48 h, or (ii) an increase in SCr to 1.5 times baseline or more within the 7 days using SCr within 7 days after operation [15, 22]. Baseline SCr was the last laboratory result between 3 months and the day before surgery. Among PO-AKI, S-PO-AKI was defined as AKI stage|$\ \ge $|2 or 3.
Statistical analyses
Baseline characteristics of participants were stratified by 3-year intervals and presented as mean ± standard deviation for continuous variables and frequencies (percentage) for categorical variables. The 3-year interval groups were considered as an ordinal categorical variable. These groups were compared by the chi-squared test for categorical variables and the analysis of variance for continuous variables. The trend between 3-year interval groups was tested by simple linear regression for continuous and Cochran–Armitage trend test for categorical variables.
The joinpoint regression models analyzed the trends of PO-AKI and S-PO-AKI and expressed them as annual incidence proportion (%) [23]. An increasing trend was defined as a parameter estimate of a positive slope, and a decreasing trend was described as a parameter estimate of a negative slope. After validation of the linearity of the trend, we calculated an annual percentage change (APC) for each trend segment and an average APC (AAPC) if there were more than one joinpoints. The trend and risk factors of PO-AKI were also assessed by univariable- and multivariable-adjusted logistic regression. Additionally, we conducted an interaction term analysis as a sensitivity analysis and performed mediation analysis to quantify the mediating effects of various factors between operational year and the occurrence of PO-AKI [24]. From the mediation models (Supplementary data, Fig. S1), regression coefficients for the association of the operative year with the respective mediator were obtained, and from the outcome model, (i) the coefficients for the association of the operative year with PO-AKI, independent of the mediators, and (ii) independent associations between each of the mediators and PO-AKI were obtained.
All statistical analyses were performed with R (version 4.1.2), and statistical significance was set at two-sided P-values <.05. When analyzing the trend of covariate distribution according to year groups, P for the recent year groups was calculated. Joinpoint regression was estimated for each operative year using the Joinpoint Trend Analysis Software Program (version 4.9.1.0), Statistical Research and Applications Branch, National Cancer Institute. The mediation analysis used the “Mediation” package in R (version 0.4.26).
RESULTS
Temporal changes of preoperative characteristics of study patients
Figure 1 outlines the study flowchart, which resulted in a total of 138 235 patients for final analysis (SNUH, n = 67 449; SNUBH, n = 61 858; and SMG-BMC, n = 8928). Table 1 presents the preoperative clinical characteristics and surgery-related factors of study subjects. Patients receiving non-cardiac major surgeries more recently tended to be older and female. Patients with comorbidities such as diabetes, hypertension or cardiovascular disease substantially increased over time, and those with anemia or albuminuria tended to increase. Notably, the use of a preoperative nonsteroidal anti-inflammatory drug (NSAID) steeply decreased (19.4%–10.0%), while the use of renin–angiotensin–aldosterone system (RAAS) blockade (4.2%–8.9%) or diuretics (2.7%–4.7%) increased. Use of anticoagulants or anti-platelet agents, which can increase perioperative bleeding risk, also increased from 1.7% to 3.9%. In addition, surgery duration and proportion of emergency operations gradually decreased while the use of general anesthesia increased. The SPARK index [9], a risk stratification method developed for PO-AKI in non-cardiac surgery patients, was computed to condense multiple patient characteristics in the current study. There was an increase in the proportion of patients classified as SPARK C or higher (from 14.9% to 24.3%), indicating a recent elevation of patients having a higher PO-AKI risk at their preoperative stage.

Study population. sCr, serum creatinine; KRT, kidney replacement therapy.
Trends of baseline characteristics according to operative year-group.
| Operative year-group | ||||||
|---|---|---|---|---|---|---|
| Total (N = 138 235) | 2005–2007 (N = 14 784) | 2008–2010 (N = 18 218) | 2011–2013 (N = 23 614) | 2014–2016 (N = 38 613) | 2017–2020 (N = 43 006) | |
| Demographic characteristics | ||||||
| Age, years | 58.7 ± 14.9 | 55.9 ± 15.3 | 57.5 ± 15.1 | 58.1 ± 14.9 | 59.0 ± 14.8 | 60.4 ± 14.6 |
| Female | 66 149 (47.9) | 6594 (44.6) | 8170 (44.8) | 10 871 (46.0) | 19 117 (49.5) | 21 397 (49.8) |
| Current smoker | 31 543 (22.8) | 3033 (20.5) | 3309 (18.2) | 5171 (21.9) | 9296 (24.1) | 10 734 (25.0) |
| BMI, kg/m2 | 24.5 ± 3.7 | 24.1 ± 3.4 | 24.3 ± 3.5 | 24.3 ± 3.4 | 24.5 ± 3.6 | 24.9 ± 3.9 |
| ≥30.0 | 9205 (6.7) | 697 (4.7) | 971 (5.3) | 1240 (5.3) | 2588 (6.7) | 3709 (8.6) |
| SBP, mmHg | 123.3 ± 18.1 | 123.3 ± 18.1 | 123.7 ± 18.0 | 123.4 ± 17.5 | 121.6 ± 17.5 | 123.7 ± 18.8 |
| DBP, mmHg | 74.1 ± 12.2 | 74.1 ± 12.2 | 74.6 ± 12.5 | 74.2 ± 12.2 | 73.2 ± 12.2 | 74.2 ± 12.0 |
| Laboratory findings | ||||||
| eGFR, mL/min/1.73 m2 | 90.3 ± 18.9 | 86.9 ± 19.3 | 89.2 ± 19.8 | 90.7 ± 18.6 | 90.9 ± 18.8 | 91.1 ± 18.4 |
| ≥90 | 75 338 (54.5) | 6723 (45.5) | 9370 (51.4) | 12 994 (55.0) | 21 806 (56.5) | 24 445 (56.8) |
| ≥60 and <90 | 53 770 (38.9) | 6809 (46.1) | 7476 (41.0) | 9241 (39.1) | 14 325 (37.1) | 15 919 (37.0) |
| <60 | 9127 (6.6) | 1252 (8.5) | 1372 (7.5) | 1379 (5.8) | 2482 (6.4) | 2642 (6.1) |
| Anemia | 49 314 (35.7) | 5121 (34.6) | 6607 (36.3) | 8244 (34.9) | 13 394 (34.7) | 15 948 (37.1) |
| Leukopenia | 6687 (4.8) | 753 (5.1) | 942 (5.2) | 1442 (6.0) | 1717 (4.4) | 1853 (4.3) |
| Leukocytosis | 27 900 (20.2) | 3337 (22.6) | 3883 (21.3) | 4629 (19.6) | 7290 (18.9) | 8761 (20.4) |
| Hyponatremia | 3999 (2.9) | 582 (3.9) | 646 (3.5) | 674 (2.9) | 1171 (3.0) | 926 (2.2) |
| Hypernatremia | 2780 (2.0) | 307 (2.1) | 289 (1.6) | 350 (1.5) | 663 (1.7) | 1171 (2.7) |
| Hypoalbuminemia | 23 178 (16.8) | 2689 (18.2) | 3197 (17.5) | 4019 (17.0) | 5932 (15.4) | 7341 (17.1) |
| Albuminuria | 12 690 (9.2) | 1084 (7.3) | 1607 (8.8) | 2158 (9.1) | 3819 (9.9) | 4022 (9.4) |
| Comorbidity | ||||||
| Diabetes mellitus | 18 890 (13.7) | 836 (5.7) | 1774 (9.7) | 3414 (14.5) | 5875 (15.2) | 6991 (16.3) |
| Hypertension | 39 778 (28.8) | 1881 (12.7) | 4309 (23.7) | 7961 (33.7) | 11 880 (30.8) | 13 747 (32.0) |
| Cardiovascular disease | 4969 (3.6) | 266 (1.8) | 458 (2.5) | 717 (3.0) | 1544 (4.0) | 1984 (4.6) |
| Malignancy | 48 940 (35.4) | 5359 (36.2) | 6051 (33.2) | 8147 (34.5) | 13 118 (34.0) | 16 265 (37.8) |
| Medication usage | ||||||
| NSAID | 18 902 (13.7) | 2865 (19.4) | 3440 (18.9) | 4521 (19.1) | 3783 (9.8) | 4293 (10.0) |
| RAAS blocker | 8765 (6.3) | 617 (4.2) | 873 (4.8) | 1106 (4.7) | 2331 (6.0) | 3838 (8.9) |
| Diuretics | 4407 (3.2) | 393 (2.7) | 429 (2.4) | 493 (2.1) | 1073 (2.8) | 2019 (4.7) |
| Anticoagulants/anti-platelet agent | 4318 (3.1) | 249 (1.7) | 365 (2.0) | 638 (2.7) | 1397 (3.6) | 1669 (3.9) |
| Surgery-related factors | ||||||
| Department | ||||||
| General surgery | 54 993 (39.8) | 6601 (44.6) | 7580 (41.6) | 9809 (41.5) | 14 253 (36.9) | 16 750 (38.9) |
| OBGY | 4673 (3.4) | 226 (1.5) | 415 (2.3) | 801 (3.4) | 1443 (3.7) | 1788 (4.2) |
| Urologic surgery | 13 330 (9.6) | 1214 (8.2) | 1854 (10.2) | 2147 (9.1) | 3615 (9.4) | 4500 (10.5) |
| Neurosurgery | 15 579 (11.3) | 1926 (13.0) | 1442 (7.9) | 1841 (7.8) | 5000 (12.9) | 5370 (12.5) |
| Orthopedic surgery | 49 660 (35.9) | 4817 (32.6) | 6927 (38.0) | 9016 (38.2) | 14 302 (37.0) | 14 598 (33.9) |
| Surgical type | ||||||
| Elective | 132 771 (96.0) | 14 065 (95.1) | 17 290 (94.9) | 22 641 (95.9) | 37 046 (95.9) | 41 729 (97.0) |
| Emergency | 5464 (4.0) | 719 (4.9) | 928 (5.1) | 973 (4.1) | 1567 (4.1) | 1277 (3.0) |
| Anesthetic type | ||||||
| General | 113 918 (82.4) | 11 818 (79.9) | 14 674 (80.5) | 19 812 (83.9) | 31 661 (82.0) | 35 953 (83.6) |
| Spinal | 24 317 (17.6) | 2966 (20.1) | 3544 (19.5) | 3802 (16.1) | 6952 (18.0) | 7053 (16.4) |
| Anesthetic time, h | ||||||
| <2 | 49 710 (36.0) | 4618 (31.2) | 6210 (34.1) | 8560 (36.2) | 14 003 (36.3) | 16 319 (37.9) |
| ≥2 and <4 | 60 518 (43.8) | 6968 (47.1) | 8283 (45.5) | 10 589 (44.8) | 16 485 (42.7) | 18 193 (42.3) |
| ≥4 | 28 007 (20.3) | 3198 (21.6) | 3725 (20.4) | 4465 (18.9) | 8125 (21.0) | 8494 (19.8) |
| SPARK | ||||||
| A | 19525 (15.9) | 1332 (17.1) | 1800 (17.2) | 4062 (17.4) | 6102 (15.9) | 6229 (14.5) |
| B | 76713 (62.3) | 5306 (68.1) | 6898 (66.0) | 14 400 (61.5) | 23 859 (62.0) | 26 250 (61.2) |
| C | 24229 (19.7) | 1052 (13.5) | 1543 (14.8) | 4514 (19.3) | 7782 (20.2) | 9338 (21.8) |
| D | 2587 (2.1) | 107 (1.4) | 217 (2.1) | 426 (1.8) | 749 (1.9) | 1088 (2.5) |
| Incidence of AKI | ||||||
| PO-AKI | 8156 (5.9) | 1269 (8.6) | 1320 (7.2) | 1450 (6.1) | 1918 (5.0) | 2199 (5.1) |
| S-PO-AKI | 1127 (0.8) | 118 (0.8) | 132 (0.7) | 208 (0.9) | 298 (0.8) | 371 (0.9) |
Continuous variables presented as mean ± standard deviation, and categorical variables are presented as frequencies (percentages). There were no missing data in the table. P for trend <.001 in all variables.
eGFR was calculated using the creatinine-based CKD-EPI equation developed in 2009.
BMI, body mass index; SBP, systolic blood pressure; DBP, diastolic blood pressure; WBC, white blood cell.
Time trends of PO-AKI incidence
During the study period, 8156 (5.9%) cases of PO-AKI and 1127 (0.8%) cases of S-PO-AKI were observed. The incidence of PO-AKI consistently decreased from 8.6% in 2005–2007 to 5.1% in 2017–2020, with APC of –4.2%/year (95% CI –5.5 to –2.8%/year, P-value <.001, Table 2 and Fig. 2A). Interestingly, the incidence of S-PO-AKI did not show any time-dependent changes with an APC of 0.9%/year (95% CI –1.1% to 2.9%/year, P-value = .347, Fig. 2B). In the subgroup analysis of PO-AKI according to the surgical department, general surgery (–2.0%/year, 95% CI –3.5% to –0.4%/year, P-value = .019, Table 2 and Supplementary data, Fig. S2) and orthopedic surgery (–6.8%/year, 95% CI –9.8% to –3.7%/year, P-value <.001) showed a significant decreasing trend of PO-AKI. Although there were few inflection points, neurosurgery had a decreasing trend in AAPC (–11.6%/year, 95% CI –21.3 to –0.7%/year, P-value = .038). In the subgroup analysis of S-PO-AKI according to surgical departments, there were no changes in any departments (Table 2 and Supplementary data, Fig. S3).
![The trend of PO-AKI and S-PO-AKI analyzed by the joinpoint regression models. (A) PO-AKI incidence decreased consistently with APC of –4.2%/year (95% CI –5.5 to –2.8%/year, P-value <.001). (B) In S-PO-AKI, no time-dependent changes in incidence were observed [APC of 0.9%/year (95% CI –1.1 to –2.9%/year, P-value = .347)].](https://oup.silverchair-cdn.com/oup/backfile/Content_public/Journal/ckj/17/7/10.1093_ckj_sfae183/9/m_sfae183fig2.jpeg?Expires=1747882742&Signature=S16kuFkEoBuWE99ZBmbu5I1a6-7uPvotlSVwwvqEGpGMwwfy5pf3RprLWy-usyj1ppIk-BOxhsDWp-ZrsqkkedrN5vXTM3bThsJGWMwHr26fqvzN2iZ72aLeoMomRd0D7g66x2raTIFf6okpfpkjT89gkOO3RZA5XiS~IiL6wNudXRco5SNfzBVnlE8-pX72QrskRo62aYSwhQRacsr1LQaRhkQgMRGmh~4~qgJw65qg9P2otC4zfQP2W5Va5nEWwpZ6JF2s037oYTk1ST1UxWUF9oFqnNsl7~Z0ZM1iwArrr8P26PS75cLgUNkuTErMWggx-eBSntxQL8yi48XCdQ__&Key-Pair-Id=APKAIE5G5CRDK6RD3PGA)
The trend of PO-AKI and S-PO-AKI analyzed by the joinpoint regression models. (A) PO-AKI incidence decreased consistently with APC of –4.2%/year (95% CI –5.5 to –2.8%/year, P-value <.001). (B) In S-PO-AKI, no time-dependent changes in incidence were observed [APC of 0.9%/year (95% CI –1.1 to –2.9%/year, P-value = .347)].
Joinpoint analysis of PO-AKI and S-PO-AKI.
| PO-AKI | S-PO-AKI | |||
|---|---|---|---|---|
| APC, %/year (95% CI) | P | APC, %/year (95% CI) | P | |
| Total | –4.2 (–5.5 to –2.8) | <.001 | 0.9 (–1.1 to 2.9) | .35 |
| Surgical department | ||||
| General surgery | –2.0 (–3.5 to –0.4) | .02 | 7.1 (–2.5 to 17.8) | .10 |
| OBGY | –5.3 (–10.9 to 0.7) | .08 | 0.5 (–13.5 to 16.7) | .93 |
| Urologic surgery | –2.7 (–7.7 to 2.5) | .30 | –5.2 (–16.2 to 7.2) | .26 |
| (i) 2004–2016 | –8.8 (–12.4 to –5.0) | <.001 | ||
| (ii) 2016–2020 | 16.1 (–4.0 to 40.4) | .11 | ||
| Neurosurgery | –11.6 (–21.3 to –0.7) | .04 | 0.0 (–10.9 to 12.3) | 1.00 |
| (i) 2004–2010 | –25.2 (–34.8 to –14.2) | <.001 | ||
| (ii) 2010–2013 | 34.1 (–27.5 to 147.8) | .30 | ||
| (iii) 2013–2020 | –16.6 (–23.2 to –9.5) | <.001 | ||
| Orthopedic surgery | –6.8 (–9.8 to –3.7) | <.001 | –4.5 (–11.7 to 3.3) | .16 |
In PO-AKI of urologic surgery and neurosurgery, AAPC was presented because of one or more joinpoints. Also, respective APC was calculated in each trend segment (i)–(iii).
In S-PO-AKI, joinpoint regression analysis was performed after stratification of the study population into 3-year intervals (2005–2007, 2008–2010, 2011–2013, 2014–2016 and 2017–2020) due to its relatively low occurrence in certain years on a yearly basis.
This trend was also found in the logistic regression analysis. The overall risk of PO-AKI steadily decreased (P for trend <.001) even after adjusting for multiple variables. However, the risk of S-PO-AKI did not change over time in univariable and multivariable logistic regression analyses (P for trend = .306, Table 3). Stratification according to surgical departments (Supplementary data, Table S1) and enrolled hospitals (Supplementary data, Table S2) showed consistent trends with the joinpoint analyses.
Risk of post-operative AKI assessed by univariable and multivariable logistic regression according to operational year.
| Univariable | Multivariablea | ||||||
|---|---|---|---|---|---|---|---|
| Operative year | Total (n) | Cases (n) | Incidence rate (%) | OR (95% CI) | P | OR (95% CI) | P |
| PO-AKI | |||||||
| 2005–2007 | 14 784 | 1269 | 8.6 | Reference | Reference | ||
| 2008–2010 | 18 218 | 1320 | 7.2 | 0.83 (0.77–0.90) | <.001 | 0.75 (0.68–0.81) | <.001 |
| 2011–2013 | 23 614 | 1450 | 6.1 | 0.70 (0.64–0.75) | <.001 | 0.66 (0.60–0.71) | <.001 |
| 2014–2016 | 38 613 | 1918 | 5.0 | 0.56 (0.52–0.60) | <.001 | 0.53 (0.49–0.58) | <.001 |
| 2017–2020 | 43 006 | 2199 | 5.1 | 0.57 (0.53–0.62) | <.001 | 0.52 (0.48–0.56) | <.001 |
| S-PO-AKI | |||||||
| 2005–2007 | 14 784 | 118 | 0.8 | Reference | Reference | ||
| 2008–2010 | 18 218 | 132 | 0.7 | 0.91 (0.71–1.16) | .44 | 0.79 (0.62–1.03) | .077 |
| 2011–2013 | 23 614 | 208 | 0.9 | 1.10 (0.88–1.39) | .39 | 1.03 (0.82–1.31) | .78 |
| 2014–2016 | 38 613 | 298 | 0.8 | 0.97 (0.78–1.20) | .76 | 0.96 (0.77–1.20) | .699 |
| 2017–2020 | 43 006 | 371 | 0.9 | 1.08 (0.88–1.33) | .46 | 0.99 (0.80–1.24) | .936 |
Multivariable model was adjusted for age, sex, current smoking, enrolled hospital, surgical department, surgical type, anesthetic type, anesthetic time, body mass index, blood pressure, baseline eGFR stage, history of diabetes mellitus, hypertension, cardiovascular disease, cerebrovascular disease, malignancy, preoperative use of drugs including NSAID, diuretics, RAAS receptor blockade, anticoagulant and anti-platelet agent, serum sodium, potassium and albumin, hemoglobin, white blood cell counts, and presence of dipstick albuminuria.
Risk factors associated with PO-AKI
Next, we explored clinical factors that may affect the development of PO-AKI or S-PO-AKI in the study population. As shown in Table 4, several clinical factors were independently associated with PO-AKI incidence. In addition, emergency surgery, spinal anesthesia and longer anesthetic time were all associated with an increased risk of PO-AKI. Specifically, surgeries performed in the OBGY and urologic surgery departments were at a higher risk of PO-AKI than those performed in the general surgery department. To investigate whether the difference of PO-AKI risk across surgical departments was contributed by the surgery-related factors, we compared their characteristics and performed interaction-term analysis (Supplementary data, Tables S3 and S4). An increased proportion of spinal anesthesia showed interaction with an increased risk of PO-AKI in OBGY. Also, the increased proportion of surgeries with 2–4 h of anesthesia in urologic surgery showed interaction with increased PO-AKI risk.
Risk of PO-AKI and S-PO-AKI analyzed by multivariable logistic regression according to clinicodemographic factors.
| PO-AKI | S-PO-AKI | |||
|---|---|---|---|---|
| Multivariable | Multivariable | |||
| OR (95% CI) | P | OR (95% CI) | P | |
| Demographic characteristics | ||||
| Age, years | ||||
| <40 | Reference | Reference | ||
| ≥40 and <59 | 1.13 (1.02–1.26) | .019 | 1.05 (0.81–1.38) | .733 |
| ≥60 and <79 | 1.28 (1.15–1.42) | <.001 | 1.32 (1.02–1.75) | .042 |
| ≥80 | 1.51 (1.31–1.74) | <.001 | 1.53 (1.05–2.22) | .027 |
| Sex | ||||
| Male | Reference | Reference | ||
| Female | 0.72 (0.68–0.77) | <.001 | 0.87 (0.74–1.01) | .071 |
| Smoking | ||||
| Never | Reference | Reference | ||
| Current | 1.10 (1.03–1.17) | .003 | 1.11 (0.95–1.3) | .185 |
| Ex-smoker | 1.21 (1.07–1.37) | .003 | 1.29 (0.94–1.73) | .096 |
| BMI, kg/m2 | ||||
| ≥18.5 and <25.0 | Reference | Reference | ||
| <18.5 | 1.13 (1.00–1.27) | .055 | 1.11 (0.83–1.46) | .475 |
| ≥25.0 and <30.0 | 1.09 (1.04–1.15) | .001 | 1.15 (1–1.31) | .046 |
| ≥30.0 | 1.33 (1.20–1.47) | <.001 | 1.69 (1.32–2.14) | <.001 |
| Laboratory findings | ||||
| eGFR, mL/min/1.73 m2 | ||||
| ≥90 | Reference | Reference | ||
| ≥60 and <90 | 1.11 (1.05–1.18) | <.001 | 0.66 (0.58–0.77) | <.001 |
| <60 | 2.41 (2.22–2.61) | <.001 | 0.59 (0.47–0.74) | <.001 |
| Hemoglobin | ||||
| Normal | Reference | Reference | ||
| Anemia | 1.38 (1.31–1.46) | <.001 | 1.54 (1.33–1.77) | <.001 |
| WBC counts | ||||
| Normal | Reference | Reference | ||
| Leukopenia | 1.79 (1.63–1.97) | <.001 | 1.9 (1.54–2.33) | <.001 |
| Leukocytosis | 1.06 (0.99–1.12) | .079 | 1.17 (1–1.36) | .043 |
| Serum sodium | ||||
| Normal | Reference | Reference | ||
| Hyponatremia | 1.49 (1.34–1.65) | <.001 | 1.74 (1.38–2.17) | <.001 |
| Hypernatremia | 1.24 (1.06–1.45) | .006 | 1.49 (1.03–2.09) | .026 |
| Serum potassium | ||||
| Normal | Reference | Reference | ||
| Hypokalemia | 1.11 (0.99–1.24) | .068 | 0.95 (0.71–1.24) | .703 |
| Hyperkalemia | 2.11 (1.52–2.88) | <.001 | 3.85 (2.03–6.69) | <.001 |
| Serum albumin | ||||
| Normal | Reference | Reference | ||
| Hypoalbuminemia | 1.89 (1.78–2.02) | <.001 | 2.42 (2.06–2.83) | <.001 |
| Albuminuria | ||||
| Normal | Reference | Reference | ||
| Albuminuria | 1.60 (1.50–1.71) | <.001 | 1.63 (1.4–1.89) | <.001 |
| Comorbidity | ||||
| Diabetes mellitus | 1.31 (1.22–1.39) | <.001 | 1.32 (1.12–1.54) | .001 |
| Hypertension | 1.12 (1.06–1.18) | <.001 | 1.15 (0.99–1.32) | .062 |
| Cardiovascular disease | 1.15 (1.03–1.28) | .01 | 0.93 (0.68–1.24) | .622 |
| Cerebrovascular disease | 1.05 (0.96–1.16) | .267 | 0.91 (0.7–1.18) | .493 |
| Malignancy | 1.19 (1.13–1.26) | <.001 | 1.19 (1.04–1.37) | .013 |
| Medication usage | ||||
| NSAID | 0.93 (0.86–1.00) | .052 | 1.02 (0.83–1.25) | .827 |
| RAAS blocker | 1.77 (1.60–1.96) | <.001 | 1.85 (1.47–2.31) | <.001 |
| Diuretics | 1.27 (1.16–1.38) | <.001 | 1.22 (0.97–1.52) | .083 |
| Anticoagulants/anti-platelet agent | 1.13 (1.00–1.27) | .049 | 1.47 (1.12–1.92) | .005 |
| Surgery-related factors | ||||
| Department | ||||
| General surgery | Reference | Reference | ||
| OBGY | 1.21 (1.04–1.4) | .011 | 1.26 (0.92–1.7) | .138 |
| Urologic surgery | 3.28 (3.06–3.52) | <.001 | 3.94 (3.34–4.63) | <.001 |
| Neurosurgery | 0.41 (0.36–0.46) | <.001 | 0.19 (0.13–0.28) | <.001 |
| Orthopedic surgery | 0.83 (0.76–0.89) | <.001 | 0.37 (0.3–0.47) | <.001 |
| Surgical type | ||||
| Elective | Reference | Reference | ||
| Emergency | 1.48 (1.33–1.65) | <.001 | 1.93 (1.51–2.44) | <.001 |
| Anesthetic type | ||||
| General | Reference | Reference | ||
| Spinal | 1.38 (1.28–1.5) | <.001 | 0.99 (0.76–1.28) | .953 |
| Anesthetic time, h | ||||
| <2 | Reference | Reference | ||
| ≥2 and <4 | 1.21 (1.13–1.29) | <.001 | 1.5 (1.25–1.81) | <.001 |
| ≥4 | 2.83 (2.64–3.03) | <.001 | 3.45 (2.86–4.18) | <.001 |
| Preoperative BP | ||||
| Normotensive | Reference | Reference | ||
| Hypertensive | 1.14 (1.07–1.20) | <.001 | 1.35 (1.17–1.55) | <.001 |
| Hypotensive | 1.01 (0.93–1.09) | .794 | 0.94 (0.77–1.15) | .58 |
Hypertensive and hypotensive BP was defined as those with BP ≥130/80 and <100/60 mmHg, respectively.
eGFR was calculated using the creatinine-based CKD-EPI equation developed in 2009.
BMI, body mass index; WBC, white blood cell; BP, blood pressure.
Similar to PO-AKI, older age, obesity, laboratory abnormalities (anemia, hypoalbuminemia and electrolyte imbalance), comorbidities (diabetes and cancer), emergency surgery and longer anesthetic duration were associated with S-PO-AKI. However, baseline kidney function was not associated with S-PO-AKI. Interestingly, patients with CKD tended not to have elevated S-PO-AKI occurrence.
Factors that may contribute to the decreasing trend of PO-AKI
The mediation analysis showed that several PO-AKI-related factors were significantly associated with the decreasing trend of PO-AKI over time (P < .001 for indirect effect for each model, Supplementary data, Table S5). Notably, the decreasing proportion of patients with specific PO-AKI-related risk factors (dysnatremia, leukopenia/leukocytosis, hypoalbuminemia, emergency surgery, spinal anesthesia, prolonged anesthetic time, preoperative hypo/hypertension and CKD stage) during the study period contributed to the overall lowered risk of PO-AKI (Fig. 3 and Supplementary data, Table S6). Unexpectedly, spinal anesthesia reduction was one of the contributors to a recent PO-AKI reduction, and spinal anesthesia was even a risk factor for PO-AKI in our cohort. We therefore wondered whether anesthesia types related to other clinical factors might have higher PO-AKI risk factors. (Supplementary data, Table S7). Patients receiving spinal anesthesia had a higher patient-related risk, such as a higher proportion of individuals aged 60 years or older, CKD and overweight, but lower risks of surgery-related factors, including emergency surgery or anesthetic time, than those receiving general anesthesia.
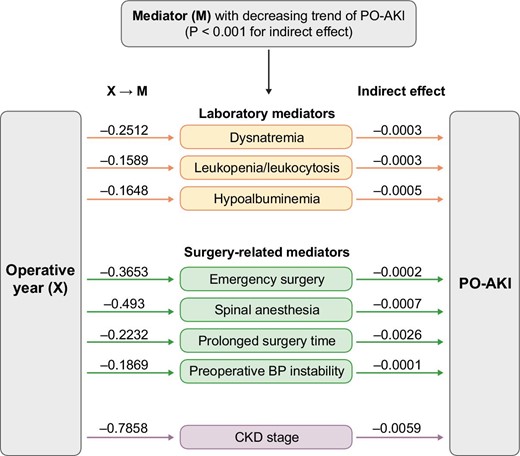
Mediation analysis of operative year and PO-AKI. Mediators that contributed to the decreasing trend of PO-AKI included dysnatremia, leukopenia/leukocytosis, hypoalbuminemia, emergency surgery, spinal anesthesia, prolonged surgery time, preoperative blood pressure instability and CKD (P-value for indirect effect, <.001). Each coefficient (beta) of X → M indicates the causal effect of X (operative year) on each M (mediator) (P-value <.001).
Temporal trends of PO-AKI patients’ characteristics
Although PO-AKI and S-PO-AKI shared similar risk factors, the incidence of S-PO-AKI did not decrease during the study period. In comparisons of the characteristics of study population in PO-AKI and S-PO-AKI, the proportion of patients with abnormal laboratory findings (leukopenia/leukocytosis, dysnatremia and hypoalbuminemia), malignancy, emergency surgery and a longer anesthetic time were significantly higher in S-PO-AKI than in PO-AKI (Supplementary data, Table S8). When both groups were stratified according to operative year, S-PO-AKI presented a significantly increased proportion of patients with obesity, anemia, emergency surgery and a longer anesthetic time (Supplementary data, Table S9).
DISCUSSION
In this large retrospective cohort study, we demonstrated a clear decreasing pattern of PO-AKI incidence over the last 15 years in more than 130 000 individuals who underwent non-cardiac major surgeries. However, no changing pattern was observed in the incidence of S-PO-AKI. The number of patients with comorbidities has increased over time, while the perioperative prescription of nephrotoxic drugs has decreased, making risk-factor analysis more challenging. Mediation analysis revealed that the overall decreasing trend in PO-AKI may be attributed to the decrease in several laboratory and surgery-related risk factors over time. In other words, even with increased risk factors such as comorbidities, age or preoperative use of nephrotoxic medications, the incidence of PO-AKI has decreased as a result of clinicians’ dedicated efforts to address modifiable risk factors associated with PO-AKI before surgery.
Understanding the epidemiological trends and relevant factors of PO-AKI is crucial to establish further prevention and management strategies for PO-AKI. Early studies from the 1900s to the early 2000s reported a growing incidence of AKI [25-27], but more recent reports had indicated a stable or slightly reduced incidence rate [19]. Despite a joint meeting of the Acute Disease Quality Initiative (ADQI-24) and the PeriOperative Quality Initiative (POQI-7) in 2019, which emphasized the importance of early recognition and prevention of PO-AKI, limited studies are exploring the time trend of PO-AKI incidence. In the current study, we attempted to overcome the limitations of previous studies to better understand the exact time trend of AKI incidence.
There are several strengths of our study. First, AKI in the post-operative setting was particularly focused because PO-AKI has the unique characteristic that it may be mitigated through optimal perioperative risk stratification or management [28-30]. The adjustment of risk factors for AKI has been considered as a cornerstone of PO-AKI prevention; however, the evidence for this approach is scarce [15, 31]. Thus, identifying the association between the changing incidence of PO-AKI and perioperative clinical factors might offer valuable insights into the preventative strategies for PO-AKI. Secondly, we demonstrated that the incidence of PO-AKI decreased by 40.7% over 15 years, from 8.6% to 5.1%, through accurate detection and evaluation of PO-AKI by regular testing during the perioperative period, collection of extensive clinical data, and various analytical methods. Third, the current study presents the largest cohort of PO-AKI with the longest observational duration compared with the previous population-based AKI epidemiological studies [18, 19, 25-27], providing recent evidence for the incidence of PO-AKI. Compared with the previous studies which adopted heterogeneous criteria for the definition of AKI, including Acute Kidney Injury Network definition, International Classification of Diseases, Ninth Revision codes or Hou et al. criteria [18, 25-27, 32], a standardized assessment of AKI epidemiology was implemented in our study by applying the KDIGO criteria for the definition of AKI. This enabled more precise and universal evidence regarding the incidence and risk factors associated with AKI could be provided.
The mediation analysis revealed that the decreased effects of specific PO-AKI-related risk factors during the study period contributed to the overall decreasing trend of PO-AKI. These risk factors included dysnatremia, leukopenia/leukocytosis, hypoalbuminemia, emergency surgery, spinal anesthesia, prolonged anesthetic time, preoperative hypo/hypertension and presence of CKD. Females, who are at lower risk than males, exhibited an increased effect during the study period, contributing to the lowered risk of PO-AKI. Nevertheless, it remains uncertain whether adjusting the identified factors in the mediation analysis can lead to decreased PO-AKI incidence in the real world, and further prospective interventional studies are warranted. To date, no pharmacological intervention studies have shown a reduction in the risk of PO-AKI [15] except for perioperative hemodynamic optimization by fluid therapy [33, 34]. The absence of any pharmacological agent associated with the decreasing trend of PO-AKI in the mediation analysis of our study is in line with the findings from the previous studies.
In this study, we confirmed several risk factors for PO-AKI, encompassing both conventional risk factors for AKI and surgery-related factors, which is in line with a recent study regarding PO-AKI [35]. Furthermore, we identified that PO-AKI and S-PO-AKI shared similar risk factors; however, different patterns were found in their incidence trends. S-PO-AKI incidence remained stable over 15 years in this study, from 0.8% in 2005–07 to 0.9% in 2017–20, while proportions of patients with AKI-related risk factors were higher in the S-PO-AKI group than in the PO-AKI group. These findings suggest that the patients who developed S-PO-AKI had higher severity of underlying medical conditions and underwent more life-threatening surgeries than those who developed PO-AKI. The changes in the proportion of risk factors over time was heterogeneous, with certain risk factors showing a decreasing pattern over time while others demonstrated an increasing trend. The comprehensive impact from the varying changes of AKI-related factors over time may have contributed to the non-decreasing incidence of S-PO-AKI. These findings indicate the complex nature of AKI development and its trend due to the dynamic change of various AKI risk factors, making it challenging to understand the current condition and establish a preventative strategy for AKI. Nevertheless, improvements in monitoring and early intervention for patients at risk of PO-AKI over the 15-year period may have prevented an increase in the incidence of PO-AKI and S-PO-AKI. For example, the hemodynamic management and nephrotoxin avoidance strategy proposed by KDIGO in 2012 may have contributed to reducing the occurrence of PO-AKI after surgery [29, 30]. Further interventional studies are warranted to identify and prevent S-PO-AKI, considering patients with S-PO-AKI are at higher risk of cardiovascular or hospital-related outcomes [36, 37].
This study has several limitations. First, patients who underwent non-cardiac surgery were recruited from three referral hospitals in Korea; therefore, careful consideration might be needed in making generalizations. Second, AKI was defined by the KDIGO SCr criteria without considering the urine output-based criteria. Third, it is premature to conclude that the change in perioperative medication usage was not associated with the decreased incidence of PO-AKI, as the complete prescription data may not have been collected.
In conclusion, we demonstrated the significantly decreasing trend of PO-AKI in recent decades in this large-scale multicenter study, whereas no significant change in S-PO-AKI was observed. Further studies are required to investigate whether the decreasing trend of PO-AKI has improved actual clinical outcomes among patients who undergo non-cardiac surgeries.
FUNDING
This study was supported by the Korea Health Technology R&D Project through the Korea Health Industry Development Institute (KHIDI), funded by the Ministry of Health & Welfare, Republic of Korea (Grant number: HI21C1138). The funder had no role in performing the study and the study was performed independently by the authors.
AUTHORS’ CONTRIBUTIONS
J.M.C., S.Kwon, S.Y., S.J., S.P., J.R., S.Kim, J.L., J.P.L., H.-J.Y., J.P., K.K., M.P. and H.L. performed the main statistical analysis including data curation, formal analysis and investigation. J.M.C., S.Kwon, S.Y., S.J., S.P., J.R., S.Kim, J.L., D.K.K., K.K., M.P. and H.L. contributed to the investigation and methodology. J.M.C., S.Kwon, S.P., D.K.K., K.W.J., Y.S.K., K.K. and H.L. contributed to the conceptualization and design of the study. S.Kwon, S.P., M.P. and H.L. advised on statistical aspects and interpreted the data. S.Kwon, S.P., D.K.K., K.W.J., Y.S.K., K.K., M.P. and H.L. offered advice regarding the data interpretation and supervised. H.L. obtained funding and supervised the overall project. All of the authors participated in drafting the manuscript. All of the authors reviewed the manuscript and approved the final version to be published.
DATA AVAILABILITY STATEMENT
The datasets were analyzed during the current study are available from the corresponding author on reasonable request.
CONFLICT OF INTEREST STATEMENT
None of the authors declare conflict of interest.
REFERENCES
Author notes
Equal contribution.


Comments