


ABSTRACT
End-stage renal disease (ESRD) patients on maintenance haemodialysis (HD) often have damage to brain white matter (WM) and cognitive impairment. However, whether this damage is caused by maintenance HD or renal dysfunction is unclear. Herein we investigate the natural progression of WM damage in patients with ESRD and the effects of HD on WM using tract-based spatial statistics (TBSS) and fixel-based analysis (FBA).
Eighty-one ESRD patients, including 41 with no dialysis (ND) and 40 on HD, and 46 healthy controls (HCs) were enrolled in this study. The differences in WM among the three groups [ESRD patients with HD (ESRD-HD), ESRD patients without HD (ESRD-ND) and HCs] were analysed using TBSS and FBA. Pairwise comparison was then used to compare the differences in WM between two groups. The relationships between WM and neurocognitive assessments/clinical data were analysed in ESRD patients with and without HD.
The damage to WM in ESRD-ND and ESRD-HD appeared around the lateral ventricles in TBSS, while FBA reflected that the changes had extended to adjacent WM in the anterior hemisphere, with a larger region in ESRD-HD compared with ESRD-ND and the brainstem was also widely affected in ESRD-HD. The Montreal Cognitive Assessment (MoCA) scores were lower in the ESRD-HD group. RD in the body of the corpus callosum were negatively correlated with MoCA scores in both groups. Fiber density and cross-section (FDC) in the left thalamo-prefrontal projection (T_PREFL) and left and right cingulum (CGL and CGR) were positively correlated with MoCA scores in both groups. Creatinine (Cr) was positively correlated with FDC in some frontal projection fibres in the striatum and thalamus, CG and fronto-pontine tract and was positively correlated with FD mainly in premotor projection fibres in the striatum and thalamus in the ESRD-HD group. Cr was negatively correlated with mean and radial diffusivity in regions of the corona radiata in the ESRD-ND group.
FBA is more sensitive in detecting differences between ESRD patients and HCs. When ESRD patients receive maintenance HD, the degree of WM damage may not be aggravated, but the range of damaged WM may be expanded, especially in the anterior hemisphere and brainstem. Some of these changes in the anterior hemisphere may contribute to cognitive decline.
What was known:
End-stage renal disease (ESRD) requires renal replacement therapies and haemodialysis (HD) accounts for the largest proportion.
ESRD patients on maintenance HD often have brain white matter (WM) injury and cognitive impairment, yet limited attention is given to ESRD patients with no dialysis (ND).
This study adds:
ESRD patients on HD have a larger damaged WM region than ESRD patients with ND, mainly in the bilateral anterior hemispheres and brainstem, while the degree of WM damage may not be aggravated.
ESRD patients on HD have poor cognitive performance, and damaged WM is associated with cognitive decline.
Potential impact:
HD may expand the range while not aggravating the degree of WM injury, which may contribute to cognitive decline in ESRD patients.
INTRODUCTION
Chronic kidney disease (CKD) is defined as the chronic deterioration of renal function resulting from sustained renal injury, eventually progressing to end-stage renal disease (ESRD) [1]. Mortality and incidence rates of ESRD have been increasing rapidly worldwide [2]. Renal replacement therapies such as haemodialysis (HD), peritoneal dialysis (PD) and renal transplantation are essential for maintaining the lives of patients with ESRD. Among these modalities, HD accounts for the largest proportion [3]. Vascular dysfunction [4] and waste clearance system dysfunction [5] lead to brain structure damage and cognitive impairment [6] in CKD patients. Cognitive decline occurs in ESRD, often leading to conditions such as dementia [7]. Although HD can efficiently eliminate water-soluble toxins to prevent uraemic encephalopathy, it is ineffective for protein-bound or medium-sized toxins [6]. Therefore, patients with ESRD still experience structural damage to the brain and cognitive impairment after HD.
Several studies have confirmed cerebral white matter (WM) structural and cognitive changes in patients with CKD. Compared with control subjects, patients with CKD are more likely to have WM lesions, which may be correlated with the degree of estimated glomerular filtration rate (eGFR) reduction [8, 9]. CKD is associated with the progression of deep WM lesions, which may contribute to cognitive degeneration [10]. Furthermore, extensive microscopic WM damage around periventricular regions has been observed in ESRD patients undergoing HD compared with control subjects, with such damage likely correlated with cognitive dysfunction [11–15].
The microstructural damage of WM can be detected through neuroimaging. For instance, diffusion tensor imaging (DTI)-derived measures can reflect various pathological changes in WM, including the integrity of WM, the magnitude of water diffusion and the diffusion rate in parallel and perpendicular directions [16–18]. However, the popular voxel-based method of tract-based spatial statistics (TBSS) is based on the tensor model and voxel-wise analysis, lack specificity to axons. In addition, it is insensitive to crossing fiber which can contribute to inaccuracies of ≥10% in fibre tract identification [19, 20], limiting the biological specificity of associated metrics [21]. A novel method called fixel-based analysis (FBA), which is specifically sensitive to axonal properties, has been proposed recently to investigate WM morphology [20]. In the FBA framework, the WM fibre orientation distributions (FODs) are computed to identify individual fibre populations. Integrating the FOD amplitude across a fibre population yields the fixel-wise fibre density (FD), a metric sensitive to microstructural, within-voxel fibre density alterations. During spatial normalization of the subject image to the template, non-linear warps estimate morphological differences in planes perpendicular to the fixel direction. This metric, the fibre bundle cross-section (FC), quantifies the spatial extent occupied by the fibre bundle, reflecting macrostructural morphological changes such as atrophy of a fibre pathway. The fibre density and cross-section (FDC) metric, a product of FD and FC, disregards microstructural or macrostructural specificity and quantifies the total effect on fibre properties [20].
However, existing studies have primarily focused on ESRD patients undergoing HD (ESRD-HD), with limited attention given to ESRD patients with no dialysis (ESRD-ND). Whether WM changes and cognitive dysfunction in ESRD patients are caused by HD, uraemic toxins (UTs) or both remains unclear. Furthermore, the analysis method in previous studies was relatively simple, using TBSS. A combination of multiple methods may offer a better understanding of pathological changes in WM. Therefore, the aims of this study were to investigate the brain WM structural characteristics in ESRD-ND and ESRD-HD patients using TBSS and FBA to better explore the natural progression of brain damage in patients with ESRD and the effects of HD on brain microstructure and to assess the relationship between cognitive statistics and changes in WM in both groups.
MATERIALS AND METHODS
Participants
Consecutive patients attending the Nephrology Department of the Beijing Friendship Hospital, Capital Medical University were invited to participate in this study (Fig. 1). This study was approved by the Medical Ethics Committee of Beijing Friendship Hospital, Capital Medical University. Written informed consent was obtained from all participants or their relatives or guardians. The inclusion criteria were as follows: right-handedness, age >18 years, CKD was diagnosed based on the National Kidney Foundation Kidney Disease Outcomes Quality Initiative guidelines [22] and ESRD-HD patients underwent HD three times per week for at least 6 months. Patients were excluded if they had central nervous system diseases including cerebrovascular diseases, trauma and tumours; were receiving other dialysis therapies; had significant carotid artery stenosis and intracranial artery stenosis; had a history of drug or alcohol abuse; had vertigo or intolerance of magnetic resonance imaging (MRI) or had psychiatric disorders.
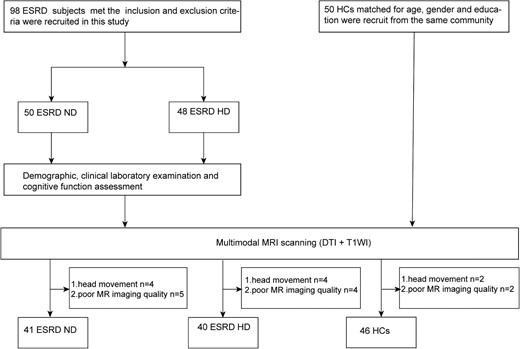
Flow chart of patient recruitment and exclusion.
Clinical data, including both blood biochemistry and cognitive assessment, was acquired within 24 hours before MRI. The Montreal Cognitive Assessment (MoCA) was used to evaluate the cognitive level of ESRD patients [23].
MRI data acquisition
All the patients underwent MRI using a 3.0T system with an eight-channel phased array coil (Discovery MR750W, GE Healthcare, Milwaukee, WI, USA). Diffusion MRI data were acquired using a single-shot echo planar imaging sequence with the following parameters: repetition time (TR), 8000 ms; echo time (TE), 98 ms; slice thickness, 5 mm with 0 mm gap; number of slices, 65; matrix size, 128 × 128; field of view (FOV), 224 × 224 mm2; number of excitations, 1; acquisition voxel size, 1.8 × 1.8 × 5 mm3; and total acquisition time, 8.8 min. Diffusion-sensitizing gradients were applied along 64 non-collinear directions with b = 1000 s/mm2, and one b = 0 s/mm2 was acquired. The scan started from the top of the parietal lobes and ended at the upper or middle of the medulla oblongata. The three-dimensional T1-weighted structural images were obtained using a 3D-BRAVO sequence with the following parameters: slice thickness, 1 mm with no slice gap; number of slices, 196; TR, 8.492 ms; TE, 3.276 ms; inversion time (TI), 450 ms; FOV, 24 × 24 mm2; flip angle, 15°; and matrix size, 256 × 256.
Diffusion tensor imaging analysis
FSL 6.0.4 (http://www.fmrib.ox.ac.uk/fsl) was used to perform DTI analysis [18]. The diffusion MRI data were corrected for distortions caused by motion and eddy current and non-brain tissue was subsequently removed. Finally, the DTI metric maps, including fractional anisotropy (FA), mean diffusivity (MD), axial diffusivity (AD) and radial diffusivity (RD), were computed.
The TBSS, a spatial statistical analysis method based on the WM skeleton to reduce errors arising from imperfect registration, was employed for further analysis. The FA maps were non-linearly aligned to the standard FMRIB58_FA template. By using an FA threshold value of 0.2, a mean FA image was calculated from all the participants’ images and was thinned to create a mean FA skeleton. Then, aligned FA images of all subjects were projected onto the skeleton to generate each subject's skeletonized FA map. The skeletonized maps of MD, AD and RD were obtained using the same projection parameters. Additionally, the Johns Hopkins University (JHU)-ICBM-DTI-81 WM Label Atlas was adopted to identify the differences in WM fibres [24].
FBA
Preprocessing pipeline was performed using QSIPrep 0.14.2 [25], including denoising, bias field correction, eddy current and motion-induced distortion correction. The FBA was performed according to the recommended pipeline [21]. The WM FODs were computed using single-shell three-tissue constrained spherical deconvolution (SS3T-CSD) [26] with the group mean response functions of WM, grey matter (GM) and cerebrospinal fluid (CSF). Next, a group-specific population template was generated with an iterative registration and averaging approach using normalized FOD images from 45 randomly selected subjects (15 HD patients, 15 CKD patients and 15 HCs). Each subject's FOD image was then registered to the template via an FOD-guided non-linear registration and segmented to allow the estimation of fixels and FBA metrics, including FD, FC, and FDC calculated for each fixel. Additionally, FC was converted to logarithmic space (logFC) for ease of analysis [21]. These FBA metrics underwent smoothing through a fixel-to-fixel connectivity matrix, which was calculated based on whole-brain tractography. The whole-brain probabilistic tractography was performed on the population template. Twenty million streamlines were first generated, and subsequently filtered to 2 million using the spherical-deconvolution informed filtering of tractograms algorithm [27] to reduce reconstruction biases.
Total intracranial volume (TIV), as a covariate, was estimated using the voxel-based morphometry (VBM) technique through the Computational Anatomy Toolbox 12 (http://www.neuro.uni-jena.de/cat/), which is an extension of Statistical Parametric Mapping 12 (http://www.fil.ion.ucl.ac.uk/spm/software/spm12/).
Statistical analysis
Statistical analysis was conducted with SPSS Statistics 25.0 (IBM, Armonk, NY, USA). P-values <.05 were considered statistically significant. Group t-tests were conducted for normally distributed data, Kruskal–Wallis and Mann–Whitney U tests were conducted for non-normally distributed data and the chi-squared test was conducted for categorical data. Spearman’s correlation analysis was employed to assess the relationship between DTI and clinical characteristics and Bonferroni correction was used after correlation analysis for multiple comparisons.
The F-test was used to compare the three groups (HCs, ESRD-ND and ESRD-HD), then a two-sample unpaired t-test was used to compare two-group differences. For TBSS analysis, age and sex were used as covariates, and voxel-wise statistics were carried out in the general linear model (GLM) module using the FSL randomize tool with non-parametric permutation testing (5000 random permutations). The results were considered statistically significant with a voxel-level family-wise error (FWE) correction at the level P < .05. Region of interest (ROI)-based analysis was performed to extract the mean DTI measures.
For FBA, the GLM was used to identify differences in FBA metrics between HD, CKD and HCs, with age and sex as nuisance covariates, log-transformed TIV was also included as a nuisance covariate for logFC and FDC (but not FD) to alleviate global effects of brain scaling. FWE-corrected P-values were then assigned to each fixel using non-parametric permutation testing with 5000 permutations. Significant fixels (FWE -corrected P < .05) were displayed using the mrview tool in MRtrix3 (https://www.mrtrix.org/) [28]. ROI-based analysis was performed to extract the mean FBA measures.
RESULTS
Demographic and clinical characteristics
Eighty-one ESRD patients, including 41 with ND and 40 with maintenance HD, and 46 HCs were enrolled in this study. The demographic and clinical characteristics of subjects are listed in Table 1. There were no significant differences in age (P = .500), sex (P = .094) or education level (P = .398) among the three groups. The levels of UA, phosphate, ferritin, serum iron and parathyroid hormone were not significantly statistically different between the ESRD-ND and ESRD-HD groups. The levels of urea, eGFR and MoCA score were higher in the ESRD-ND group than in the ESRD-HD group. The levels of creatinine, calcium and haemoglobin were lower in the ESRD-ND group than in ESRD-HD group.
Demographic and clinical characteristics of ESRD patients and HCs in this study.
| Characteristics | ESRD-ND (n = 41) | ESRD-HD (n = 40) | HCs (n = 46) | P-value |
|---|---|---|---|---|
| Age (years), median (IQR) | 50.0 (40.0–60.5) | 55.5 (45.5–60.8) | 53.5 (42.8–59.0) | 0.500a |
| Sex (male/female), n | 29/12 | 24/16 | 22/24 | 0.094b |
| Education level (years), median (IQR) | 12.0 (12.00–15.00) | 12.0 (12.00–14.00) | 14.0 (9.00–16.00) | 0.398a |
| Urea (mmol/l), mean ± SD | 31.65 ± 7.911 | 21.13 ± 8.008 | NA | <0.001c |
| Creatinine (µmol/l), mean ± SD | 771.5 ± 250.79 | 983.3 ± 208.48 | NA | <0.001c |
| Uric acid (µmol/l), mean ± SD | 408.5 ± 126.81 | 370.4 ± 78.13 | NA | 0.281c |
| Calcium (mmol/l), median (IQR) | 2.1 (1.94–2.28) | 2.3 (2.20–2.43) | NA | <0.001d |
| Phosphate (mmol/l), mean ± SD | 2.05 ± 0.498 | 1.98 ± 0.459 | NA | 0.559c |
| eGFR (ml/min/1.73 m2), median (IQR) | 5.9 (4.25–8.24) | 2.5 (2.20–3.2) | NA | <0.001d |
| Ferritin (ng/ml), median (IQR) | 100.8 (24.78–37.00) | 72.9 (23.68–215.98) | NA | 0.342d |
| Serum iron (µmol/l), median (IQR) | 11.3 (9.10–14.70) | 13.2 (10.15–16.65) | NA | 0.064d |
| Haemoglobin (g/l), median (IQR) | 98 (86.0–105.0) | 116 (109.0–122.8) | NA | <0.001d |
| Parathyroid hormone (pg/ml), median (IQR) | 167.8 (113.85–377.10) | 206.4 (86.95–333.03) | NA | 0.633d |
| MoCA score, median (IQR) | 25 (22.5–27.0) | 21 (18.0–25.0) | NA | <0.001d |
NA: not applicable.
Kruskal–Wallis test.
Chi-squared test.
Two-sample t-test.
Mann–Whitney U test.
Whole-brain TBSS analysis and ROI analysis
Analysis of variance (ANOVA_)
An ANOVA revealed a statistical significance in FA, MD, AD and RD among the three groups (P < .05; Supplementary Fig. 1).
ESRD-ND versus HCs
Compared with HCs, ESRD-ND patients showed lower FA in the body of the corpus callosum (BCC), splenium of the corpus callosum (SCC), bilateral superior corona radiata (SCR) and the right posterior corona radiata (PCR); higher AD in the BCC and SCC; higher MD in the BCC, SCC, right anterior corona radiata (ACR) and SCR, bilateral PCR and left posterior thalamic radiation (PTR); and higher RD in the BCC, SCC, bilateral SCR and PCR, right ACR and external capsule (EC) and left PTR (P < .05; Fig. 2a and Table 2).
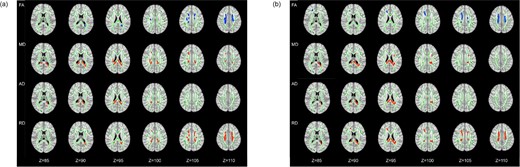
The differences of DTI measures. (a) ESRD-ND versus HCs. (b) ESRD-HD versus HCs. Green represents the mean FA skeleton of all subjects, blue shows regions with decreased FA (1st row) compared with HCs and red shows regions with increased MD (2nd row), AD (3rd row) and RD (4nd row) compared with HCs. The number below the brain image indicates the Z coordinate in the Montreal Neurological Institute (MNI) space.
Comparison of DTI measures in ROI-based analysis.
| ESRD-ND versus HCs | ESRD-HD versus HCs | ||||||
|---|---|---|---|---|---|---|---|
| DTI measures in ROI (%) | ESRD-ND | HCs | P-value | DTI measures in ROI (%) | ESRD-HD | HCs | P-value |
| FA | FA | ||||||
| BCC (15.7) | 0.39251 ± 0.056731 | 0.47664 ± 0.053512 | <.05 | BCC (26.9) | 0.38930 ± 0.044678 | 0.47289 ± 0.052589 | <.05 |
| SCC (7.9) | 0.58005 ± 0.050990 | 0.64471 ± 0.031493 | <.05 | ACRR (37.2) | 0.35827 ± 0.037522 | 0.42558 ± 0.038201 | <.05 |
| SCRR (36.4) | 0.39360 ± 0.038559 | 0.45801 ± 0.037086 | <.05 | SCRR (16.6) | 0.35961 ± 0.039555 | 0.43776 ± 0.045684 | <.05 |
| SCRL (31.4) | 0.38791 ± 0.043856 | 0.46079 ± 0.045539 | <.05 | SCRL (13.8) | 0.39781 ± 0.036975 | 0.46598 ± 0.049491 | <.05 |
| PCRR (8.6) | 0.34293 ± 0.045356 | 0.40828 ± 0.042692 | <.05 | PCRR (4.1) | 0.33436 ± 0.054570 | 0.40623 ± 0.046314 | <.05 |
| PCRL (1.4) | 0.32168 ± 0.047453 | 0.39217 ± 0.057357 | <.05 | ||||
| MD | MD | ||||||
| BCC (6.1) | 0.00092 ± 0.000058 | 0.00083 ± 0.000032 | <.05 | BCC (2.1) | 0.00090 ± 0.000073 | 0.00080 ± 0.000045 | <.05 |
| SCC (67.6) | 0.00084 ± 0.000061 | 0.00073 ± 0.000040 | <.05 | SCC (66.7) | 0.00083 ± 0.000045 | 0.00073 ± 0.000038 | <.05 |
| RLICL (5.0) | 0.00094 ± 0.000078 | 0.00085 ± 0.000039 | <.05 | SCRL (5.4) | 0.00083 ± 0.000051 | 0.00077 ± 0.000032 | <.05 |
| ACRR (1.1) | 0.00084 ± 0.000067 | 0.00076 ± 0.000046 | <.05 | PCRL (19.4) | 0.00097 ± 0.000089 | 0.00085 ± 0.000052 | <.05 |
| SCRR (6.7) | 0.00083 ± 0.000052 | 0.00076 ± 0.000028 | <.05 | PTRL (6.4) | 0.00105 ± 0.000094 | 0.00090 ± 0.000074 | <.05 |
| PCRR (8.9) | 0.00086 ± 0.000063 | 0.00078 ± 0.000035 | <.05 | ||||
| PCRL (4.0) | 0.00089 ± 0.000059 | 0.00082 ± 0.000034 | <.05 | ||||
| PTRL (0.6) | 0.00093 ± 0.001345 | 0.00080 ± 0.000066 | <.05 | ||||
| AD | AD | ||||||
| BCC (1.5) | 0.00183 ± 0.000127 | 0.00170 ± 0.000097 | <.05 | BCC (4.0) | 0.00187 ± 0.000101 | 0.00171 ± 0.000083 | <.05 |
| SCC (98.5) | 0.00172 ± 0.000077 | 0.00156 ± 0.000064 | <.05 | SCC (77.6) | 0.00179 ± 0.000090 | 0.00162 ± 0.000062 | <.05 |
| PCRL (18.4) | 0.00148 ± 0.000019 | 0.00130 ± 0.000081 | <.05 | ||||
| RD | RD | ||||||
| BCC (11.8) | 0.00067 ± 0.000064 | 0.00056 ± 0.000049 | <.05 | BCC (17.0) | 0.00068 ± 0.000061 | 0.00057 ± 0.000053 | <.05 |
| SCC (21.9) | 0.00053 ± 0.000069 | 0.00043 ± 0.000044 | <.05 | SCC (12.9) | 0.00050 ± 0.000054 | 0.00041 ± 0.000051 | <.05 |
| RLICL (5.0) | 0.00070 ± 0.000078 | 0.00057 ± 0.000049 | <.05 | ACRR (25.0) | 0.00067 ± 0.000058 | 0.00058 ± 0.000045 | <.05 |
| ACRR (8.0) | 0.00066 ± 0.000078 | 0.00057 ± 0.000049 | <.05 | SCRR (15.7) | 0.00065 ± 0.000051 | 0.00057 ± 0.000040 | <.05 |
| SCRR (19.3) | 0.00063 ± 0.000051 | 0.00056 ± 0.000036 | <.05 | SCRL (21.5) | 0.00065 ± 0.000053 | 0.00057 ± 0.000044 | <.05 |
| SCRL (21.0) | 0.00065 ± 0.000054 | 0.00057 ± 0.000041 | <.05 | PCRR (6.5) | 0.00070 ± 0.000073 | 0.00062 ± 0.000047 | <.05 |
| PCRR (4.2) | 0.00070 ± 0.000062 | 0.00061 ± 0.000046 | <.05 | PCRL (0.7) | 0.00073 ± 0.000060 | 0.00065 ± 0.000054 | <.05 |
| PCRL (5.0) | 0.00071 ± 0.000053 | 0.00064 ± 0.000040 | <.05 | PTRL (0.7) | 0.00051 ± 0.000074 | 0.00040 ± 0.000068 | <.05 |
| PTRL (0.9) | 0.00057 ± 0.000105 | 0.00045 ± 0.000058 | <.05 | ||||
| ECR (2.9) | 0.00061 ± 0.000076 | 0.00052 ± 0.000040 | <.05 | ||||
ESRD-HD versus HCs
Compared with HCs, ESRD-HD showed lower FA in the BCC, left ACR and bilateral SCR and PCR; higher AD in the BCC, SCC and left PCR; higher MD in the BCC, SCC and left SCR, PCR and PTR; higher RD in the BCC, SCC, bilateral SCR and PCR, right ACR and left PTR (P < .05; Fig. 2b and Table 2).
ESRD-ND versus ESRD-HD
There were no significant differences in FA, AD, MD and RD between the ESRD-ND and ESRD-HD patients.
Whole-brain FBA
ANOVA
There were no significant differences among the three groups in FC, FD and FDC.
ESRD-ND versus HCs
Compared with HCs, macrostructural FC was lower in ESRD-ND patients, mainly concentrated in fibre bundles in the bilateral anterior hemispheres, such as frontal projection fibres in the striatum and thalamus, commissure anterior, rostrum and genu of the corpus callosum and anterior part of the CG. Furthermore, associational fibres such as the bilateral inferior occipito-frontal fascicle (IFO) were also lower. Microstructural FD was lower only in a small portion of bilateral frontal projections and bilateral associational fibres such as the arcuate fascicle (AF) and superior longitudinal fascicle (SLF). When macro- and microstructural fibres were taken together, the regions of lower FDC were similar to the regions of lower FC, with a smaller range than FC in ESRD-ND patients (P < .05; Fig. 3a and Table 3).
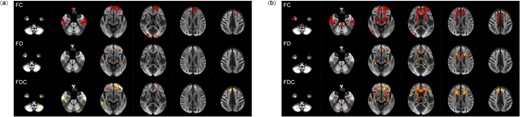
Whole-brain results for FBA. (a) ESRD-ND versus HCs. (b) ESRD-HD versus HCs. Fiber tract–specific significant decreases are displayed in axial slices.
Differences in voxel size of fibre bundles in ESRD-HD and ESRD- ND based on FBA.
| FC | FD | FDC | |||||||||
|---|---|---|---|---|---|---|---|---|---|---|---|
| Label | Name (bundle) | ESRD-HD versus HCs | ESRD-ND versus HCs | Label | Name (bundle) | ESRD-HD versus HCs | ESRD-ND versus HCs | Label | Name (bundle) | ESRD-HD versus HCs | ESRD-ND versus HCs |
| ATR_left | Anterior thalamic radiation | 2044 | 877 | AF_left | Arcuate fascicle | 621 | 5 | ATR_left | Anterior thalamic radiation | 901 | 31 |
| ATR_right | Anterior thalamic radiation | 475 | 64 | AF_right | Arcuate fascicle | 234 | 2 | CC_1 | Corpus callosum rostrum | 1814 | 518 |
| CA | Commissure anterior | 2770 | 641 | ATR_right | Anterior thalamic radiation | 225 | 0 | CC_2 | Corpus callosum genu | 3485 | 289 |
| CC_1 | Corpus callosum rostrum | 2892 | 1369 | CC_1 | Corpus callosum rostrum | 490 | 3 | CG_left | Cingulum | 545 | 11 |
| CC_2 | Corpus callosum genu | 5609 | 2062 | CC_2 | Corpus callosum genu | 817 | 0 | CG_right | Cingulum | 779 | 1 |
| CG_left | Cingulum | 1881 | 1449 | CC_3 | Corpus callosum rostral body | 387 | 1 | FPT_left | Fronto-pontine tract | 602 | 18 |
| CG_right | Cingulum | 2384 | 46 | IFO_left | Inferior occipito-frontal fascicle | 248 | 0 | FPT_right | Fronto-pontine tract | 540 | 2 |
| CST_left | Corticospinal tract | 661 | 37 | SLF_III_left | Superior longitudinal fascicle III | 808 | 2 | IFO_left | Inferior occipito-frontal fascicle | 1451 | 77 |
| CST_right | Corticospinal tract | 442 | 17 | SLF_III_right | Superior longitudinal fascicle III | 266 | 0 | IFO_right | Inferior occipito-frontal fascicle | 422 | 31 |
| FPT_left | Fronto-pontine tract | 2742 | 1167 | ST_FO_left | Striato-fronto-orbital | 272 | 0 | ST_FO_left | Striato-fronto-orbital | 1288 | 214 |
| FPT_right | Fronto-pontine tract | 2904 | 284 | ST_FO_right | Striato-fronto-orbital | 282 | 0 | ST_FO_right | Striato-fronto-orbital | 899 | 136 |
| IFO_left | Inferior occipito-frontal fascicle | 1977 | 299 | ST_PREF_left | Striato-fronto-orbital | 343 | 0 | ST_PREF_left | Striato-prefrontal | 2157 | 150 |
| IFO_right | Inferior occipito-frontal fascicle | 479 | 69 | ST_PREF_right | Thalamo-prefrontal | 453 | 0 | ST_PREF_right | Striato-prefrontal | 1298 | 96 |
| ST_FO_left | Striato-fronto-orbital | 1911 | 586 | T_PREF_right | Thalamo-prefrontal | 246 | 0 | T_PREF_left | Thalamo-prefrontal | 1139 | 46 |
| ST_FO_right | Striato-fronto-orbital | 1125 | 483 | T_PREM_left | Thalamo-premotor | 414 | 2 | T_PREF_right | Thalamo-prefrontal | 574 | 5 |
| ST_PREF_left | Striato-prefrontal | 3632 | 2111 | UF_left | Uncinate fascicle | 917 | 33 | ||||
| ST_PREF_right | Striato-prefrontal | 2247 | 347 | UF_right | Uncinate fascicle | 340 | 45 | ||||
| T_PREF_left | Thalamo-prefrontal | 2619 | 1816 | ||||||||
| T_PREF_right | Thalamo-prefrontal | 1817 | 129 | ||||||||
| UF_left | Uncinate fascicle | 929 | 117 | ||||||||
| UF_right | Uncinate fascicle | 802 | 108 | ||||||||
ESRD-HD versus HCs
Compared with HCs, ESRD-HD patients showed greater lower FC than ESRD-ND patients in fibre bundles in the bilateral anterior hemispheres and temporal lobe. Fibre bundles in the brainstem were also widely affected, such as the corticospinal tract (CST) and fronto-pontine tract (FPT). For FD, ESRD-HD patients had a slightly wider range of involved brain structure than ESRD-ND patients, including bilateral projection fibres and associational and commissural fibres in the bilateral anterior hemispheres. A wider range of lower FDC was found in ESRD-HD patients, with a reduction in regions similar or smaller than FC in ESRD-HD patients (P < .05; Fig. 3b and Table 3).
ESRD-ND versus ESRD-HD
There were no significant differences in FC, FD and FDC between ESRD-ND and ESRD-HD patients.
Correlation analysis in ESRD-ND and ESRD-HD
In the ESRD-ND group, FDC in the right and left cingulum (CGR and CGL) were positively correlated with the MoCA score (r = 0.381, P = .014; r = 0.429, P = .005, respectively). FDC in the left thalamo-prefrontal bundle (T_PREFL) was positively correlated with the MoCA score (r = 0.333, P = .033). RD in the BCC was negatively correlated with the MoCA score (r = −0.405, P = .009) (Fig. 4). After Bonferroni correction, no correlation was found.
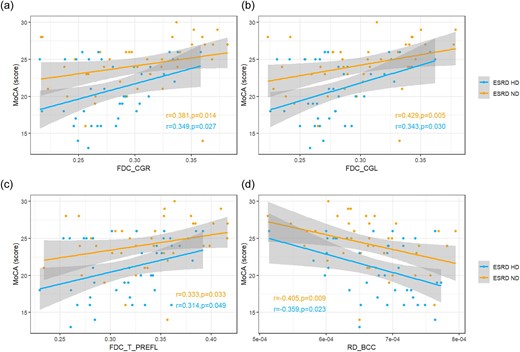
Correlation analysis between deficits in WM and MoCA score in ESRD-ND and ESRD-HD. (a–c) Positive correlations between FDC and MoCA score in CGR, CGL and T_PREFL in both groups (after Bonferroni correction, no correlation was found). (d) Negative correlations between RD in the BCC and MoCA score in both groups (after Bonferroni correction, no correlation was found).
In the ESRD-HD group, FDC in the CGR and CGL was positively correlated with the MoCA score (r = 0.349, P = .027; r = 0.343, P = .003, respectively). FDC in the T_PREFL was positively correlated with the MoCA score (r = 0.314, P = .049). RD in the BCC was negatively correlated with the MoCA score (r = −0.359, P = .023) (Fig. 4). After Bonferroni correction, no correlation was found.
In the ESRD-ND group, Cr was negatively correlated with MD in the right SCR and PCR (r = −0.345, P = .027; r = −0.311, P = .047, respectively). Cr was negatively correlated with RD in the right PCR (r = −0.373, P = .016) (Fig. 5). After Bonferroni correction, no correlation was found.
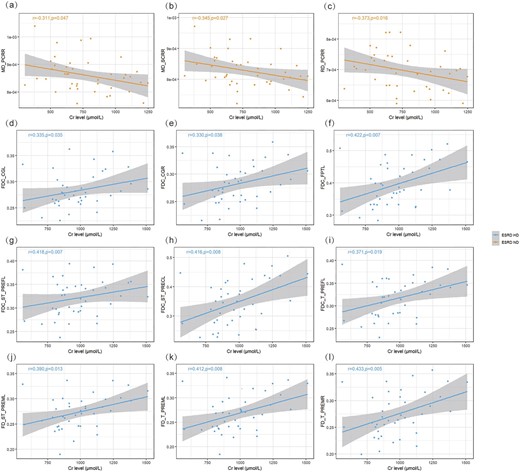
Corrections analysis between deficits in WM and Cr level in ESRD-ND and ESRD-HD. (a, b) Negative correlations between Cr level and MD in the ESRD-ND group (after Bonferroni correction, no correlation was found). (c) Negative correlations between Cr level and RD in the ESRD-ND group (after Bonferroni correction, no correlation was found). (d–i) Positive correlations between Cr level and FDC in the ESRD-HD group (after Bonferroni correction, no correlation was found). (j–l) Positive correlations between Cr level and FD in the ESRD-HD group (after Bonferroni correction, no correlation was found).
In the ESRD-HD group, Cr was positively correlated with FDC in the CGR and CGL (r = 0.330, P = 0.038; r = 0.335, P = .035, respectively), left striato-prefrontal bundle (ST_PREFL), left striato-precentral bundle (ST_PRECL), T_PREFL and FPTL (r = 0.418, P = .007; r = 0.416, P = .008; r = 0.371, P = .019; r = 0.422, P = .007, respectively). Cr was positively correlated with FD in the left thalamo-premotor bundle (T_PREML), T_PREMR and left striato-premotor bundle (ST_PREML) (r = 0.412, P = .008; r = 0.433, P = .005; r = 0.390, P = .013, respectively) (Fig. 5). After Bonferroni correction, no correlation was found.
DISCUSSION
To the best of our knowledge, this study is the first to use a combination of FBA and TBSS to investigate brain WM changes in patients with ESRD-ND and ESRD-HD. In our findings, patients with ESRD with or without HD exhibited similar WM damage around the lateral ventricles compared with HCs, as revealed by TBSS analysis. Intriguingly, compared with HCs, ESRD-HD patients displayed a more extensive range of FC and FDC than ESRD-ND patients, mainly in the bilateral anterior hemispheres. The brainstem was also widely affected in ESRD-HD patients, as demonstrated by FBA. The MoCA score in the ESRD-HD group was lower than in the ESRD-ND group. Correlation analysis showed RD in the BCC was negatively correlated with the MoCA score and CG and T_PREFL were positively correlated with the MoCA score in both ESRD-ND and ESRD-HD patients. Cr was positively correlated with FDC in some frontal projection fibres in the striatum and thalamus, CG and FPT and was positively correlated with FD mainly in premotor projection fibres in the striatum and thalamus in the ESRD-HD group, but was negatively correlated with MD and RD in regions of corona radiata in the ESRD-ND group. The results suggest the degree of WM damage may not be aggravated, the range of damaged WM can be expanded after receiving maintenance HD and enlarged WM injury might be a contributor to cognitive decline.
To further understand the natural process of structural change in patients with ESRD-ND and the effect of HD, we first investigated ESRD-ND patients. For TBSS analysis, the ESRD-ND group exhibited higher AD, RD and MD and lower FA around the lateral ventricles compared with HCs, with a broader lower FA and higher RD. DTI is highly sensitive to the diffusional information of WM and many factors can influence diffusion anisotropy, including the integrity of axonal membranes, damage of neuronal fibre bundles, neural diameter and the integrity of the myelin sheath [17]. Our results suggest damage to the microstructures around the lateral ventricles may be a complex process involving myelin loss, axonal atrophy and fibre bundle damage, with the main pathological change being demyelination. FBA provides fibre tract-specific statistical analysis [29], improves sensitivity to WM changes and can provide total intra-axonal volume of WM axons. Lower FD was found in the anterior and posterior corners of the lateral ventricle in the ESRD-ND group, indicating that axonal loss occurred in this area at the microstructure level. Lower FC was mainly found in the anterior hemispheres, representing axonal atrophy and the absence of extra-axonal matrix in these regions [20]. FDC increases the sensitivity by integrating the information of FD and FC and is more likely to reflect the ability to relay information [20]. However, the range of FDC is much smaller than FC, which suggests that axonal atrophy and the absence of extra-axonal matrix may be the main pathological changes rather than axonal loss or a combination of them in the ESRD-ND group. Although traditional TBSS shows AD reflects axonal injury and RD reflects demyelinating, it is likely to suffer from inaccurate FBA-based projection in regions of crossing fibres and has decreased detection accuracy [20]. TBSS only reflected changes around lateral ventricles, while FBA reflected the changes had extended from the lateral ventricles to adjacent WM. These changes may be related to blood–CSF barrier damage. Under normal conditions, UTs can be efflux transporters expressed at the blood–CSF barrier, keeping the concentration of UTs significantly lower in CSF than that in serum [30]. The transporters can be inhibited by the accumulated UTs caused by renal failure, leading to increased toxins in CSF [30]. The solutes then spread along the perivascular spaces into deeper structures, resulting in WM around the lateral ventricles being affected and gradually extending into the subcortical WM.
Compared with HCs, TBSS analysis showed similar damage to regions in the ESRD-HD group while FBA results showed wider damaged regions with lower FD, FC and FDC. No significant difference was found between ESRD-ND and ESRD-HD in WM using TBSS and FBA. The results may demonstrate that when CKD patients received maintenance HD, the severity of WM damage may not be further aggravated; however, the affected regions may be further expanded. In addition to the frontal projection fibres, the affected regions also extended to the brainstem. FBA indicated further axonal loss and axonal atrophy was further aggravated. Notably, the expansion of FDC was more extensive in the ESRD-HD group, indicating the combined effect of axonal atrophy and axonal loss were the main pathological changes of WM rather than a single pathological change in ESRD-HD patients.
The pathophysiological mechanism of HD that aggravates WM damage remains unclear, but may include the following. First, the ability of vascular automatic regulation and endothelial function are impaired in ESRD patients caused by chronic vascular disease and UT accumulations [31, 32]. The brain is therefore vulnerable to changes in blood flow during HD [33], eventually leading to cerebral hypoperfusion, triggering ischaemic stress response and aggravating cerebral cellular damage [33]. Second, urea is rapidly removed from the blood during HD and the urea concentration of plasma decreases sharply, while only a gradual decrease is found in CSF urea concentration. In the hours after HD, the concentration of urea in CSF remains much higher than that in plasma, resulting in an osmotic gradient favouring free water entering the brain and leading to cerebral oedema [34]. Interestingly, the brainstem of HD patients was damaged in the FBA analysis, and a previous study also observed the pons and cerebellum of CKD patients with HD were affected [11]. The descending and crossing fibre tracts of the brainstem are composed of a great admixture of GM and WM. GM contains 10 times more capillaries than WM and their grid-like or checker-board architecture enables increased contact surface between WM and GM, making the WM more susceptible to unstable cerebral blood flow during HD than other WM in the bilateral hemispheres [35, 36].
Our study found the MoCA score in the ESRD-HD group was lower than in the ESRD-ND group. RD in the BCC was negatively correlated with the MoCA score in TBSS analysis in both ESRD groups. Damage to the BCC may affect visuospatial information transfer, behaviour and consciousness [37] and cause cognitive dysfunction, including relational memory, motor speed and processing [38, 39]. We also found lower FDC in the CG and T_PREFL correlated with lower MoCA scores in both ESRD groups. CG fibres mainly include thalamo-cortical projections, some of which may be involved in the processing of cognitive information [40], as well as connections travelling in prefrontal areas, as almost all prefrontal cortical areas contribute at least some fibres to the CG bundle [41]. Evidence showed the CG bundle mediates performance in cognitive function, especially damage to the anterior CG, which correlated with lower attention/executive and memory performance [42]. The range of FDC was significantly enlarged after HD in our study, especially in the anterior regions, including the corpus collosum, CG and part of the thalamo-cortical projections. Thus we hypothesize that the enlarged WM injury caused by HD might be one of the reasons for cognitive decline after HD.
Interestingly, we found that the Cr level was positively correlated with FD and FDC in the ESRD-HD group and was negatively correlated with MD and RD in the ESRD-ND group, which means a decreased Cr level is related to more serious WM damage. This reverse relationship in HD patients was also found in other studies, as low Cr levels were associated with higher death risk [43, 44], but possible mechanisms remain speculative and may be explained by poor nutritional status, loss of muscle mass, etc. Although the Cr level is considered as an indicator of renal function, it is also a metabolic product of creatine phosphate in muscles, as the amount of muscle mass may be the predominant determinant of creatinine levels in ESRD patients rather than residual renal function [44, 45]. Further, less muscle mass may be associated with decreased WM integrity, but the underlying mechanisms remain unclear [46, 47]. We assumed that a decrease in Cr level in ESRD patients may indicate lower muscle mass, which may affect the integrity of the brain. Investigations should be done to further understand the relationship between muscle mass and brain structure in ESRD patients in the future.
Limitations
First, this study is a cross-sectional single-centre study. Second, the limited sample size may have resulted in lower power. Third, relatively low b-values may have compromised the specificity and sensitivity of FBA results. Finally, due to the special location at the edge of the head coil and individual differences, the lower signal:noise ratio of the brainstem and coverage of the medulla oblongata were slightly different and may have influenced the result. All these limitations should be addressed in the future.
CONCLUSIONS
This study suggests that when CKD patients received maintenance HD, the range of damaged WM can be expanded while the degree of WM damage has little impact. In addition to expansion in the bilateral anterior hemispheres, changes in WM can also spread to the brainstem. Enlarged WM injury caused by HD might be a contributing factor in cognitive decline, but the specific mechanisms need to be further explored.
FUNDING
This work was supported by the National Natural Science Foundation of China (82202099 and 52227814), Beijing Municipal Administration of Hospitals Clinical Medicine Development of Special Funding Support (contract grants ZYLX201824 and ZYLX202101), Beijing Municipal Administration of Hospital's Mission Plan (contract grant SML20150101), Beijing Scholar 2015 (to Z.W.), Beijing Friendship Hospital, Capital Medical University (contract grant: seed project YYZZ202129, yyqcjh2023-7) and Training Fund for Open Projects at Clinical Institutes and Departments of Capital Medical University (CCMU2022ZKYXY011).
AUTHORS’ CONTRIBUTIONS
Y.Q. and L.S.: research design, writing—original draft. H.W., Z.W. and Z.Y.: writing—review, and editing. W.Y., M.L., X.L. and M.L.: data collection. B.X., Z.Z., W.L.: data analysis.
DATA AVAILABILITY STATEMENT
The raw data supporting the conclusions of this article will be made available by the corresponding author upon reasonable request.
CONFLICT OF INTEREST STATEMENT
The authors declare no conflicts of interest.
REFERENCES
Author notes
These authors contributed equally to this work.


Comments