


ABSTRACT
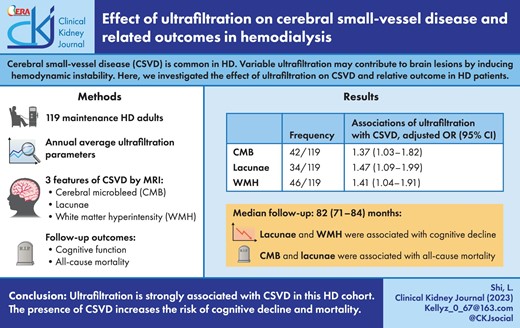
Increasing evidence suggests a high prevalence of cerebral small-vessel disease (CSVD) in hemodialysis patients. Variable ultrafiltration during hemodialysis may contribute to brain lesions by inducing hemodynamic instability. We aimed to investigate the effect of ultrafiltration on CSVD and relative outcome in this population.
In a prospective cohort of maintenance hemodialysis adults, three features of CSVD including cerebral microbleed (CMB), lacunae and white matter hyperintensity (WMH) were measured by brain magnetic resonance imaging. Ultrafiltration parameters included the difference between annual average ultrafiltration volume (UV, kg) and 3%–6% of dry weight (kg), respectively, and the percentage of UV to dry weight (UV/W). The effect of ultrafiltration on CSVD and the risk of cognitive decline were investigated by multivariate regression analysis. Cox proportional hazards model was used to assess mortality over 7 years of follow-up.
In the 119 study subjects, the frequency of CMB, lacunae and WMH was 35.3%, 28.6% and 38.7%, respectively. All ultrafiltration parameters were associated with the risk of CSVD in the adjusted model. There was a 37%, 47% and 41% greater risk of CMB, lacunae, and WMH, respectively, per 1% increment of UV/W. Ultrafiltration showed different effects on different distributions of CSVD. Restricted cubic splines depicted a linear relationship between UV/W and the risk of CSVD. At follow-up, lacunae and WMH were associated with cognitive decline, CMB and lacunae were associated with all-cause mortality.
UV/W was associated with the risk of CSVD in hemodialysis. Reducing UV/W might protect hemodialysis patients from CSVD and subsequent cognitive decline and mortality.
Lay Summary
Previous studies have reported a high prevalence of cerebral small-vessel disease (CSVD) in maintenance hemodialysis patients. CSVD is associated with multiple adverse outcomes including stroke, cardiovascular events and cognitive impairment. Hemodynamic instability resulting from ultrafiltration is considered to cause brain lesions during hemodialysis. In this prospective cohort study, we aimed to explore the effect of ultrafiltration on three typical features of CSVD, including cerebral microbleed (CMB), lacunae and white matter hyperintensity (WMH) and related outcomes in maintenance hemodialysis patients. We found that ultrafiltration parameters were positively associated with increased risk of CSVD. Lacunae and WMH were associated with cognitive decline; CMB and lacunae were associated with all-cause mortality at follow-up. Our findings highlight the essential role of avoiding over-ultrafiltration to prevent CSVD in patients undergoing maintenance hemodialysis. CMB, lacunae and WMH could serve as potential imaging markers to evaluate different clinical outcomes in hemodialysis.
INTRODUCTION
Cerebral small-vessel disease (CSVD) is an important cause and risk factor of stroke, dementia and functional loss [1, 2]. It is also an independent prognostic factor for predicting future development of stroke, cardiovascular events, global cognitive impairment and psychiatric disorders [3, 4]. Since CSVD is asymptomatic in most cases, failure to recognize CSVD and control its risk factors could perpetuate potential harm. Multiple previous studies indicated that there was a higher prevalence of CSVD in patients undergoing hemodialysis than in the general population [5–7]. The pathological mechanisms underlying CSVD formation in hemodialysis patients are complicated and not fully understood. During the process of hemodialysis, ultrafiltration could bring drastic hemodynamic change and consequently high variability of blood pressure. The increase in ultrafiltration volume (UV) compromises cerebral circulation, and the accumulation of repetitive circulatory stress may finally lead to brain lesions [8]. It was reported that higher UV was significantly associated with lower global and regional cerebral blood flow in hemodialysis patients. Further, decline in cerebral blood flow correlated with progression of white matter hyperintensity (WMH) burden [9, 10]. However, detailed studies on the impact of variable ultrafiltration, especially on CSVD, are still insufficient.
In this study, we comprehensively investigated and compared the association of ultrafiltration with three typical features of CSVD including cerebral microbleed (CMB), lacunae and WMH in maintenance hemodialysis patients. We also explored the range of UV that can minimize the risk of CSVD. Moreover, the risk of cognitive decline and all-cause mortality were evaluated at follow-up.
MATERIALS AND METHODS
Study participants
We performed a prospective cohort study of hemodialysis patients from a single medical center. A total of 220 patients who received maintenance hemodialysis at two dialysis centers from July 2013 to July 2014 were screened. Patients who met the following criteria were included: age ≥18 years and regular dialysis for ≥2 months. The exclusion criteria were: (i) systemic infection, acute cardiovascular events, cancer, surgery or trauma in the month prior to the study; (ii) metabolic encephalopathy (e.g. hepatic encephalopathy, uremic encephalopathy, hypoxic encephalopathy), mental disorder, emotional disorder, epilepsy patients on long-term treatments or diagnosed dementia; (iii) history of non-atherosclerotic arterial disease (e.g. vasculitis, Takayasu arteritis); and (iv) metal prosthesis.
This study was approved by the Ethics Committee of Peking Union Medical College Hospital. Written informed consent was obtained from each participant before any data were collected.
Clinical and laboratory data
We gathered demographics and comorbid conditions of all subjects from medical records, including age, gender, education, dialysis vintage, height, weight, BMI, presence of smoking habits, history of hypertension, diabetes mellitus, hyperlipidemia and stroke. A history of stroke was reported by the participants themselves and diagnosed by the imaging appearance of T1- and T2-weighted images. Interdialytic blood pressure was measured on the day before the first hemodialysis session in a week. Data for blood examinations, including hemoglobin, serum albumin, lipid profiles, high sensitivity C-reactive protein, serum creatinine, urea nitrogen and urea were collected pre-dialysis within a week before or after the date of magnetic resonance imaging (MRI) evaluation. Urea reduction ratio (URR) was calculated as: URR = 1 – Ct/C0, where Ct is post-dialysis and C0 is pre-dialysis serum urea concentration. Equilibrated Kt/V was calculated according to the second-generation logarithmic Daugirdas [11].
For patients whose dialysis vintage was at least a year, weekly ultrafiltration parameters were collected for the year before the MRI scan. If the dialysis vintage was less than a year, we would record ultrafiltration data every week in all dialysis months. All the UV involved in the statistical analysis of this study is annual average UV, which was defined by the mean value of all UV readings from a patient. The difference between annual average UV and 3%, 4%, 5%, 6% of dry body weight (UV – 3%W, UV – 4%W, UV – 5%W, UV – 6%W, respectively), and the percentage of UV to dry body weight (UV/W) were calculated.
MRI acquisition and analysis
Brain MR took place immediately after recruitment on a 3.0 T scanner (DISCOVERY MR750; General Electric, Milwaukee, WI, USA) using an eight-channel head coil. The image acquisition and analysis were performed as previously described [12]. MRI sequences including T1- and T2-weighted, fluid-attenuated inversion recovery (FLAIR) and susceptibility-weighted imaging (SWI) were acquired. All MRIs were assessed independently by an experienced neurologist and radiologist who were blinded to clinical information. If there was a discrepancy, a consensus was reached after discussion. The same assessment criteria and image reviewers were applied to minimize the error in lesion detection.
SWI was analyzed for the presence of CMB, which was defined as a round or ovoid, small (2–10 mm) area of homogeneous signal loss surrounded by brain parenchyma (at least half of the lesion). CMB was categorized into three groups by the anatomic localization [13]. Lobar CMB included microbleed located in the cerebral cortices (frontal, parietal, temporal, occipital and insula) or subcortical white matter (SWM). Deep CMB included microbleed in the basal ganglia (BG), thalamus, corpus callosum, internal capsule, external capsule, deep white matter or infratentorial regions (brain stem or cerebellum). The mixed group referred to diffuse CMB in both lobar and deep regions. Lacunae were defined as focal lesions of 3–15 mm in size, with the same signal characteristics as cerebrospinal fluid on all MRI sequences. Lacunae were evaluated in SWM and BG, separately. Deep WMH (DWMH) and periventricular WMH (PVWMH) were graded on axial FLAIR imaging according to the Fazekas scale from 0 to 3, with the total Fazekas score calculated as the sum of these two parts [14]. WMH was defined as a total Fazekas score >2; PVWMHs or DWMHs were defined as the Fazekas score >1, correspondingly.
Cognitive assessment
Cognitive assessment was administered by trained medical staff on an intradialytic day. The Mini Mental State Examination (MMSE) [15] and the Montreal Cognitive Assessment (MOCA) [16] are commonly used to detect cognitive impairment. Each of them contains various cognitive domains [17]. MOCA has higher sensitivity while MMSE exhibits higher specificity [18–20]. Here, we employed Chinese versions of both MMSE and MOCA to combine their benefits and evaluate the global cognitive function of our cohort [12]. Both scores range from 0 to 30. The MOCA was presented as an education-adjusted score, in which one more score was added for those with 12 years or fewer of education.
Follow-up
Patients were followed up until February 2021. A repeat cognitive assessment was performed in August 2019. Information involving death and newly diagnosed cardiovascular disease (CVD) were retrieved from medical records and imaging data. Evidence for death contained death certificates from hospitals or consensus from investigators’ comprehensive review of related reports if a death occurred outside hospitals. Overall survival was calculated until the time of death or the last follow-up. CVD included cerebral infarction, cerebral hemorrhage and myocardial infarction.
Statistics
Demographic and clinical characteristics were expressed as percentages for categorical data, mean ± standard deviation or median (interquartile range) for continuous variables. We conducted univariate analysis of ultrafiltration and CSVD using Mann–Whitney U test. The odds ratio (OR) was calculated with a 95% confidence interval (CI). Multivariate logistic regression analysis was performed to further explore the effect of ultrafiltration on CSVD. Potential nonlinear association between UV/W and the risk of CSVD was examined with restricted cubic splines [21]. A knot is located at the 5th, 50th and 95th percentiles for UV/W measures. Tests for nonlinearity, which compared a model containing only the linear term with a model containing the linear and restricted cubic spline terms, were conducted using likelihood ratio tests. If a test for nonlinearity was not significant, we conducted a test for linearity, comparing a model containing the linear term with a model containing only the covariates of interest. The associations of ultrafiltration and CSVD with cognitive function were investigated by multiple linear regression analysis. Cox proportional hazards model was applied to estimate the adjusted hazard ratio (HR) of all-cause mortality. To evaluate the robustness of our results, we performed sensitivity analyses by excluding 12 subjects with stroke history for associations between ultrafiltration and CSVD. The SPSS 25.0 statistical package (IBM Corporation, Armonk, NY, USA), GraphPad Prism version 9.4 (GraphPad Software, San Diego, CA, USA), and R version 4.1.2 (R Foundation for Statistical Computing, Vienne, Austria) were used for all analyses; P < .05 indicated statistical significance.
RESULTS
Demographic and clinical characteristics
A total of 119 maintenance hemodialysis patients were enrolled in this study. Males and females were almost evenly, 50.4% were male and 40.6% were female. The average age was 56.6 years old. Nearly all patients had a diagnosis of hypertension but were acceptably controlled at time of enrolment. The mean systolic and diastolic blood pressure were 137.9 and 79.5 mmHg, respectively. The median value of UV was 2.3 kg, ranging from 1.8 to 2.8 kg. The median percentage of UV to dry body weight was 3.8% (2.9% to 4.7%) (Table 1).
Demographic and clinical characteristics of the study cohort (n = 119).
| Demographic information and clinical history | |
|---|---|
| Male | 60 (50.4) |
| Age, years | 56.6 ± 13.1 |
| Education level | |
| Elementary school | 4 (3.36) |
| Middle school | 25 (21.0) |
| High school | 45 (37.8) |
| >High school | 45 (37.8) |
| Smoking | 42 (35.3) |
| Hypertension | 117 (98.3) |
| Diabetes mellitus | 25 (21.0) |
| Hyperlipidemia | 43 (36.1) |
| Stroke history | 12 (10.1) |
| Dialysis vintage, months | 58.0 (17.0 to 109.0) |
| Dry body weight, kg | 62.0 ± 12.0 |
| BMI, kg/m2 | 22.7 ± 3.8 |
| SBP, mmHg | 137.9 ± 16.3 |
| DBP, mmHg | 79.5 ± 11.4 |
| MAP, mmHg | 99.0 ± 10.8 |
| Laboratory evaluation | |
| Hemoglobin, g/L | 111.2 ± 13.4 |
| Serum albumin, g/L | 39.7 ± 3.9 |
| Triglycerides, mmol/L | 1.5 ± 0.9 |
| Total cholesterol, mmol/L | 4.2 ± 1.0 |
| HDL-C, mmol/L | 1.1 ± 0.3 |
| LDL-C, mmol/L | 2.4 ± 0.8 |
| Hs-CRP, mg/L | 2.2 (1.1 to 5.4) |
| Serum creatinine, μmol/L | 971.3 ± 238.7 |
| Urea nitrogen, mmol/L | 26.9 ± 5.2 |
| URR | 0.7 ± 0.1 |
| Kt/V | 1.4 ± 0.2 |
| Ultrafiltration profiles | |
| Recorded dialysis period, months | 12.0 (12.0 to 12.0) |
| Recorded dialysis times, sessions | 52.0 (52.0 to 54.0) |
| UV, kg | 2.3 (1.8 to 2.8) |
| UV – 3%W, kg | 0.5 (–0.1 to 1.0) |
| UV – 4%W, kg | –0.1 (–0.8 to 0.4) |
| UV – 5%W, kg | –0.7 (–1.3 to –0.1) |
| UV – 6%W, kg | –1.3 (–2.3 to –0.7) |
| UV/W, % | 3.8 (2.9 to 4.7) |
Data are presented as mean ± standard deviation, median (range) or percentages (%).
BMI, body mass index; SBP, systolic blood pressure; DBP, diastolic blood pressure; MAP, mean arterial pressure; HDL-C: high-density lipoprotein cholesterol; LDL-C: low-density lipoprotein cholesterol; Hs-CRP, high sensitivity C-reactive protein.
Brain MRI assessment of CSVD
All participants received cerebral MRI, and CSVD was presented as the existence of CMB, lacunae or WMH. In terms of the entire study population, 35.3% (42/119) had CMB, which was distributed as 8.4% lobar CMB, 19.3% deep CMB and 7.6% mixed CMB. The frequency of lacunae was 28.6% (34/119), and the proportion of lacunae in SWM and BG was 19.3% and 20.2%, respectively. Some 38.7% (46/119) of subjects suffered abnormal WMH (Fazekas scores >2), of which 36.1% of subjects had periventricular WMH and 26.9% of subjects had deep WMH (Table 2).
Brain MRI assessment of CSVD (n = 119).
| CMB | 42 (35.3) |
|---|---|
| Lobar | 10 (8.4) |
| Deep | 23 (19.3) |
| Mixed | 9 (7.6) |
| Lacunae | 34 (28.6) |
| SWM | 23 (19.3) |
| BG | 24 (20.2) |
| WMH | 46 (38.7) |
| PVWMHs | 43 (36.1) |
| DWMHs | 32 (26.9) |
| CMB | 42 (35.3) |
|---|---|
| Lobar | 10 (8.4) |
| Deep | 23 (19.3) |
| Mixed | 9 (7.6) |
| Lacunae | 34 (28.6) |
| SWM | 23 (19.3) |
| BG | 24 (20.2) |
| WMH | 46 (38.7) |
| PVWMHs | 43 (36.1) |
| DWMHs | 32 (26.9) |
Data are presented as percentages (%).
Association of ultrafiltration with the risk of CSVD
In univariate analyses, we found ultrafiltration parameters were significantly greater in patients with CMB or lacunae than that in patients without. This difference was not observed in patients with WMH (Supplementary data, Table S1). The influences of ultrafiltration on CSVD were further investigated by multivariable logistic regression analyses (Table 3). In the crude model, all ultrafiltration parameters, including UV, the differences between UV and 3%, 4%, 5%, 6% of weight, and UV/W were positively related to the risk of CMB. There were similar influences on lacunae as for CMB, while only UV/W was significantly associated with WMH. After adjusting for age, gender, mean arterial pressure and URR, the positive influences of ultrafiltration parameters on both CMB and lacunae remained and statistical significances reversed. Meanwhile, for WMH, influences of the differences between UV and 3%, 4%, 5%, 6% of weight, and UV/W became statistically significant in the adjusted model. In detail, there was a 37%, 47% and 41% greater risk of CMB (OR 1.37; 95% CI 1.03–1.82), lacunae (OR 1.47; 95% CI 1.09–1.99) and WMH (OR 1.41; 95% CI 1.04–1.91), respectively, per 1% increment of UV/W. The corresponding OR statistics in the adjusted model are also displayed as forest plots in Fig. 1. Further sensitivity analysis excluding 12 subjects with stroke history suggested that the associations between ultrafiltration and CSVD were robust and not influenced excessively (Supplementary data, Table S6).
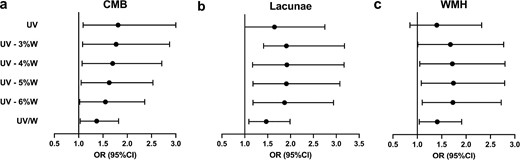
Forest plots of OR statistics for CMB, lacunae and WMH in the adjusted logistic regression models. The dot represents the OR, and the horizontal line represents 95% CI.
Logistic regression analysis of associations between ultrafiltration and CSVD (n = 119).
| CMB | Lacunae | WMH | ||||||||||
|---|---|---|---|---|---|---|---|---|---|---|---|---|
| Crude | Adjusted | Crude | Adjusted | Crude | Adjusted | |||||||
| OR (95% CI) | P-value | OR (95% CI) | P-value | OR (95% CI) | P-value | OR (95% CI) | P-value | OR (95% CI) | P-value | OR (95% CI) | P-value | |
| UV | 1.59 (1.04–2.41) | .03 | 1.81 (1.09–3.00) | .02 | 1.46 (0.95–2.24) | .09 | 1.65 (1.00–2.75) | .05 | 1.12 (0.76–1.65) | .58 | 1.40 (0.85–2.32) | .19 |
| UV – 3%W | 1.62 (1.06–2.49) | .03 | 1.77 (1.08–2.87) | .02 | 1.66 (1.05–2.62) | .03 | 1.91 (1.14–3.18) | .01 | 1.31 (0.88–1.95) | .18 | 1.68 (1.01–2.77) | .04 |
| UV – 4%W | 1.59 (1.05–2.40) | .03 | 1.70 (1.07–2.71) | .03 | 1.68 (1.07–2.63) | .02 | 1.92 (1.17–3.17) | .01 | 1.36 (0.92–2.00) | .12 | 1.72 (1.05–2.80) | .03 |
| UV – 5%W | 1.53 (1.03–2.28) | .04 | 1.63 (1.05–2.53) | .03 | 1.67 (1.08–2.59) | .02 | 1.91 (1.18–3.08) | .01 | 1.39 (0.95–2.03) | .09 | 1.74 (1.08–2.79) | .02 |
| UV – 6%W | 1.48 (1.01–2.15) | .04 | 1.55 (1.02–2.36) | .04 | 1.65 (1.09–2.50) | .02 | 1.87 (1.18–2.94) | .01 | 1.41 (0.98–2.02) | .06 | 1.73 (1.10–2.72) | .02 |
| UV/W | 1.31 (1.01–1.69) | .04 | 1.37 (1.03–1.82) | .03 | 1.36 (1.04–1.79) | .03 | 1.47 (1.09–1.99) | .01 | 1.36 (1.04–1.79) | .03 | 1.41 (1.04–1.91) | .03 |
Crude: unadjusted; Adjusted: adjusted for age, gender, mean arterial pressure and URR.
Bold indicates P < 0.05.
Furthermore, we compared the effects of ultrafiltration on different CSVD lesions in different brain locations in the adjusted model (Table 4). Of all three distribution patterns of CMB, the mixed CMB group demonstrated a distinguishable effect by ultrafiltration. For lacunae, compared with the BG group, the effect of ultrafiltration was significant on lesions in SWM across all the evaluated ultrafiltration parameters. Neither PVWMHs nor DWMHs were noticed to be more significantly affected by ultrafiltration.
Comparison of the effects of ultrafiltration across different CSVD distribution groups (n = 119).
| CMB | Lacunae | WMH | ||||||||||||
|---|---|---|---|---|---|---|---|---|---|---|---|---|---|---|
| Lobar | Deep | Mixed | SWM | BG | PVWMHs | DWMHs | ||||||||
| OR (95% CI) | P-value | OR (95% CI) | P-value | OR (95% CI) | P-value | OR (95% CI) | P-value | OR (95% CI) | P-value | OR (95% CI) | P-value | % CI) | P-value | |
| UV | 1.24 (0.56–2.79) | .60 | 1.36 (0.75–2.46) | .31 | 2.53 (1.01–6.34) | .05 | 2.00 (1.10–3.66) | .03 | 1.18 (0.69–2.03) | .55 | 1.34 (0.78–2.30) | .28 | 1.54 (0.90–2.62) | .12 |
| UV – 3%W | 1.33 (0.60–2.96) | .48 | 1.27 (0.72–2.24) | .41 | 2.55 (1.02–6.41) | .05 | 2.34 (1.26–4.37) | .01 | 1.45 (0.85–2.48) | .17 | 1.58 (0.93–2.69) | .09 | 1.63 (0.96–2.75) | .07 |
| UV – 4%W | 1.34 (0.62–2.89) | .46 | 1.23 (0.71–2.12) | .47 | 2.40 (0.99–5.80) | .05 | 2.35 (1.28–4.30) | .01 | 1.51 (0.90–2.55) | .12 | 1.61 (0.96–2.69) | .07 | 1.61 (0.97–2.66) | .07 |
| UV – 5%W | 1.33 (0.64–2.79) | .44 | 1.19 (0.70–2.01) | .52 | 2.22 (0.97–5.09) | .06 | 2.29 (1.28–4.10) | .01 | 1.56 (0.94–2.57) | .08 | 1.63 (0.99–2.67) | .05 | 1.58 (0.98–2.55) | .06 |
| UV – 6%W | 1.32 (0.66–2.65) | .43 | 1.15 (0.70–1.89) | .58 | 2.04 (0.94–4.40) | .07 | 2.20 (1.27–3.82) | .01 | 1.58 (0.98–2.55) | .06 | 1.62 (1.01–2.59) | .05 | 1.53 (0.97–2.41) | .07 |
| UV/W | 1.17 (0.73–1.86) | .51 | 1.12 (0.80–1.57) | .52 | 1.67 (1.01–2.76) | .05 | 1.75 (1.21–2.53) | .003 | 1.27 (0.93–1.75) | .14 | 1.36 (0.99–1.87) | .06 | 1.33 (0.98–1.81) | .07 |
Adjusted for age, gender, mean arterial pressure and URR.
Bold indicates P < 0.05.
Based on the analysis above, a restricted cubic spline (RCS) fitting logistic regression model was then adopted to visually inspect potential linear or non-linear relationships between UV/W and CSVD. Multivariable-adjusted RCS analyses revealed that there were no non-linear relationships between UV/W and all three signs of CSVD. Nevertheless, evidence of significant linear associations of UV/W with the risk of lacunae and WMH were found. The same linear trend was yielded regarding the association of UV/W with the risk of CMB. Specifically, when UV/W >3%, the shape of the lacunae curve is the steepest of the three curves, again implying the risk of lacunae increases the most when UV/W ratio rises. Comparison of OR estimates for CMB, lacunae and WMH at several UV/W points are listed (Fig. 2).
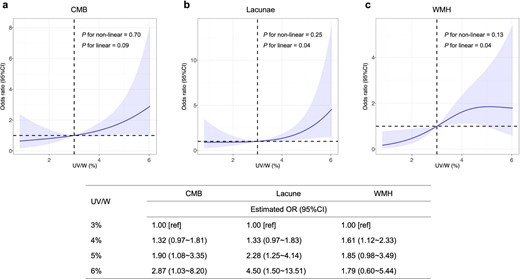
Multivariable-adjusted OR of CMB, lacunae and WMH in participants. The solid curves indicate multivariate-adjusted ORs, and the 95% CIs derived from RCS regression are represented by shaded area. The X-axis is the percentage of UV to weight. The horizontal dashed lines represent where OR equals 1, and the vertical dashed lines represent the corresponding reference value on X-axis (UV/W = 3%). The logistic regression was adjusted for gender, age, mean arterial pressure and URR.
Association of ultrafiltration and CSVD with cognitive function
Sixty-six participants were available for repeat cognitive testing at follow-up; one participant who had received kidney transplantation was excluded from the analysis. The risk of cognitive decline was assessed using a multivariable-adjusted linear regression model. There was no significant effect of any ultrafiltration parameter on cognitive function (Supplementary data, Table S2). The effects of CSVD on cognitive function are shown in Table 5. At baseline, CMB was associated with impaired MMSE scores, and DWMHs were associated with impaired MOCA scores. No other assessment revealed significant differences. At follow-up, both lacunae and WMH were associated with impaired MMSE and MoCA scores. Patients with lacunae in BG showed significantly increased risks of impaired MMSE and MoCA scores. These associations were not observed in patients with lacunae in SWM. PVWMH was associated with impaired MMSE scores, and DWMH was significantly associated with a decline in both MMSE and MoCA scores.
Linear regression analysis of associations between CSVD and cognitive function.
| Baseline assessment (n = 119) | Follow-up assessment (n = 65) | |||||||
|---|---|---|---|---|---|---|---|---|
| MMSE | MOCA | MMSE | MOCA | |||||
| β (95% CI) | P-value | β (95% CI) | P-value | β (95% CI) | P-value | β (95% CI) | P-value | |
| CMB | –1.17 (–2.07 to –0.28) | .01 | –1.10 (–2.60 to 0.41) | .15 | 0.28 (–1.32 to 1.89) | .73 | 0.40 (–1.71 to 2.50) | .71 |
| Lobar | –1.29 (–2.83 to 0.25) | .10 | 0.26 (–2.31 to 2.83) | .84 | 0.33 (–2.09 to 2.74) | .79 | 2.74 (–0.36 to 5.83) | .08 |
| Deep | –0.67 (–1.77 to 0.43) | .23 | –1.59 (–3.39 to 0.21) | .08 | –0.27 (–1.68 to 2.22) | .78 | –0.80 (–3.36 to 1.75) | .53 |
| Mixed | –0.83 (–2.47 to 0.82) | .32 | –0.28 (–3.01 to 2.44) | .84 | –0.21 (–3.73 to 3.30) | .90 | –1.27 (–5.87 to 3.34) | .58 |
| Lacunae | –0.52 (–1.47 to 0.44) | .29 | –1.04 (–2.62 to 0.53) | .19 | –2.09 (–3.78 to –0.39) | .02 | –2.51 (–4.75 to –0.26) | .03 |
| SWM | –0.45 (–1.55 to 0.63) | .41 | –1.07 (–2.84 to 0.71) | .24 | –0.71 (–2.72 to 1.29) | .48 | –1.76 (–4.36 to 0.84) | .18 |
| BG | –0.89 (–1.98 to 0.21) | .11 | –0.68 (–2.50 to 1.14) | .46 | –2.43 (–4.49 to –0.36) | .02 | –3.06 (–5.78 to –0.33) | .03 |
| WMH | 0.57 (–0.40 to 1.54) | .24 | –0.75 (–2.35 to 0.85) | .35 | –1.64 (–3.21 to –0.08) | .04 | –2.11 (–4.17 to –0.05) | .04 |
| PVWMHs | 0.62 (–0.39 to 1.63) | .23 | –0.60 (–2.27 to 1.07) | .48 | –1.76 (–3.37 to –0.14) | .03 | –1.72 (–3.88 to 0.44) | .12 |
| DWMHs | –0.23 (–1.23 to –0.78) | .66 | –1.95 (–3.58 to –0.33) | .02 | –1.90 (–3.58 to –0.22) | .03 | –3.09 (–5.25 to –0.93) | .01 |
Adjusted for age, education level, blood urea nitrogen and hemoglobin.
Bold indicates P < 0.05.
Association of ultrafiltration and CSVD with the risk of all-cause mortality
Next, we calculated the hazard ratio of all-cause mortality in our hemodialysis patients using a Cox regression model with adjustments for age and gender. Three patients lost to follow-up and nine patients who received kidney transplantation were excluded from the analysis. During a median follow-up period of 82 (71 to 84) months, 35 deaths occurred, accounting for 32.7% (35/107) of all subjects. Causes of death can be grouped into five categories: ischemic heart disease (15/35), stroke (3/35), infection (5/35), cancer (3/35) and other/unknown (9/35). The effect of ultrafiltration parameters on all-cause mortality was insignificant (Supplementary data, Table S3). Instead, CMB and lacunae were significantly associated with the risk of all-cause mortality. Among each CSVD distribution group, deep CMB and lacunae in SWM showed strong associations with all-cause mortality (Fig. 3 and Supplementary data, Table S4).
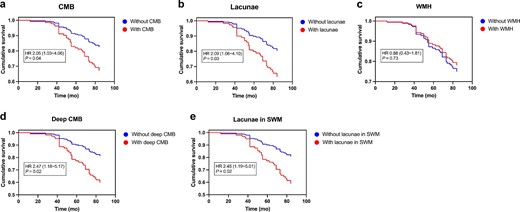
Estimated survival curves for (A) CMB, (B) lacunae, (C) WMH, (D) deep CMB and (E) lacunae in SWM in overall cohort. Hazard ratios were adjusted for differences in age and gender.
DISCUSSION
Although the prevalence of CSVD in dialysis patients has attracted much attention, its clinical implication has not been well explained, and specific studies focusing on the impact of dialysis-related factors on CSVD have been lacking. To the best of our knowledge, this is the first study looking into the association of ultrafiltration with the risk of CSVD among patients receiving maintenance hemodialysis. Of vital importance, we made a systemic evaluation and comparison of three typical features of CSVD, including CMB, lacunae and WMH, covering both ischemic and hemorrhagic lesions, to help in better understanding the possible pathophysiology.
Consistent with previous research findings [22], we found that there was a noticeably high prevalence of CSVD in our hemodialysis cohort. Following routine clinical practice of hemodialysis, to minimize adverse events while ensuring dialysis adequacy, the recommended UV range is approximately 3%–6% of dry body weight [23, 24]. Based on our results from the multivariate regression analysis, after adjusting for several main confounders chosen according to prior studies [25–27], ultrafiltration parameters including UV – 3%W, UV – 4%W, UV – 5%W, UV – 6%W, and UV/W are independent risk factors for all three features of CSVD. Different regional subtypes of CSVD indicate different etiology and pathogenesis in dialysis patients [28, 29]. Accordingly, we performed subgroup analyses to explore the effect of ultrafiltration on each distribution pattern of CSVD. The results demonstrated that patients with lacunae in SWM were superiorly affected by ultrafiltration. The area of SWM is mainly peripheral vessels, which are more susceptible to hypovolemia and hemodynamic instability driven by excessive ultrafiltration. It was found that lacunae in SWM were associated with amyloid deposition, brain atrophy, white matter integrity destruction and subsequent cognitive decline, indicating their potential role in neurodegeneration diseases [30].
To explore the possible range of UV/W linked with a lower risk of CSVD, RCS analysis was employed in our study, and it illustrated a positive linear relationship between UV/W and the risk of CMB, lacunae and WMH, respectively. The magnitude of the risk for CSVD was substantially greater with increasing level of UV/W, especially when UV/W was over 3%. Lacunae were the most affected among all three features of CSVD as UV/W ratio rose. In reality, achieving zero ultrafiltration during a hemodialysis session is almost impossible; thus, finding a reasonable ultrafiltration range to minimize adverse outcomes is meaningful. From our results, it is rational to start paying more attention to UV when it exceeds 3% of dry body weight and to increase UV more cautiously.
The high frequency of cognitive impairment in individuals on hemodialysis is well characterized [31]. In this study, we assessed cognitive function at baseline and follow-up to compare the short- and long-term effects of CSVD on cognitive decline in our cohort. At baseline, the associations between CSVD and cognitive decline were mostly insignificant. By contrast, the increased risk of cognitive decline in patients with lacunae or WMH appeared at follow-up. The effects of lacunae and WMH on cognitive impairment become appreciable over time. Our findings again validate the conclusion of previous studies that lacunae and WMH are powerful predictors of long-term cognitive decline and functional disability [32, 33]. The negative effect of CMB on MMSE scores was no longer detectable at follow-up assessment, which may be due to non-response bias. Hemodialysis patients with cognitive decline are more likely to be less compliant with fluid restriction, and the corresponding increase in UV compromises cerebral circulation, elevating the risk of CSVD, and further deteriorating cognitive function. Despite the fact that a significant association between UV and cognitive decline was not detected in this study, the underlying impact of ultrafiltration on cognitive function in the hemodialysis population is probably substantial and worth further investigation.
Prior studies have shown that higher ultrafiltration rate was associated with greater mortality in maintenance hemodialysis patients [34, 35]. Nevertheless, none of the evaluated ultrafiltration parameters, including ultrafiltration rate, had a significant impact on all-cause mortality in our cohort. Numerous factors contribute to mortality in patients undergoing dialysis. The difficulty of ruling out the possibility of all related confounders may lead to this insignificance. In this study, we demonstrated that the presence of CMB or lacunae were associated with higher mortality, while patients with WMH versus patients without WMH seemed to have no significant difference in survival. This finding addresses an important knowledge gap in studying the effect of CSVD on mortality in hemodialysis patients. The subsequent subgroup analysis found out that deep CMB and lacunae in SWM contributed to death prominently in our cohort. As well as mortality, we also examined the association between CSVD distribution groups and combined CVD outcome with the incident of either newly diagnosed CVD or death from ischemic heart disease as the dependent variable. Lacunae in SWM also had a significant effect on CVD outcome (Supplementary data, Table S5). We infer that lowering the UV/W ratio is likely to control or even avoid lacunae in SWM, thus indirectly promoting survival and potentially reducing CVD risk during the clinical management of hemodialysis patients. Taken together, we can see that CMB, lacunae and WMH each have unique clinical significance, with lacunae in SWM and deep CMB exhibiting a stronger prognostic value and lacunae in BG and WMH having a greater significance for cognitive decline. Different CSVD features could serve as imaging markers for various hemodialysis outcomes.
We admit that there are many limitations to this study. First and foremost, this study was limited by the nature of its observational design. Baseline and repeat MRI studies were lacking; we were not able to identify CSVD onset and changes during hemodialysis. Causality in relation to ultrafiltration and CSVD cannot be speculated. Second, we gathered the ultrafiltration profile within 1 year prior to the MR scan, and the average UV for this year can only reflect the general status of the patient's ultrafiltration. Third, even though we collected patients’ information as comprehensively as possible, there might still be unknown or inaccurate measured factors that were not recorded. In addition, the number of adjusted factors in a regression model is limited by the number of outcome events [36]. Due to the relatively small patient size in our study, background factors may not be fully adjusted for. As a result, confounding bias may arise. The effect of ultrafiltration on CSVD in hemodialysis patients might be overstated in this study; its precise effect remains to be confirmed in larger cohorts.
Overall, our current study suggests that UV/W is closely associated with the risk of CSVD in maintenance hemodialysis patients. Reducing UV/W within an appropriate range may be a potential avenue to protect these patients from CSVD and improve related outcomes in this population. However, the practical impact of UV/W reduction on preventing CSVD events remains to be proven in future interventional clinical trials.
ACKNOWLEDGEMENTS
The authors thank the collaborative team in our dialysis centers and support from all participants in the study.
FUNDING
The contributing study was funded by National High Level Hospital Clinical Research Funding (Grant number 2022-PUMCH-B-021), the Beijing Municipal Science and Technology Project (Grant number D181100000118001), the 12th National Science and Technology Support Program (Grant number 2011BAI10B02) and the National High Level Hospital Clinical Research Funding (Grant number 2022-PUMCH-A-172).
AUTHORS’ CONTRIBUTIONS
All authors contributed study conception, design, analysis and interpretation of data. L.S., K.Z., and Y.Q. drafted the manuscript. Each author contributed important intellectual content during manuscript revision and approved the final manuscript.
DATA AVAILABILITY STATEMENT
The data underlying this article will be shared on reasonable request to the corresponding author.
CONFLICT OF INTEREST STATEMENT
None declared.
REFERENCES
Author notes
These authors contributed equally to this study.


Comments