


Abstract
Emerging evidence suggests that diet, particularly one that is rich in dietary fiber, may prevent the progression of chronic kidney disease (CKD) and its associated complications in people with established CKD. This narrative review summarizes the current evidence and discusses the opportunities for increasing fiber intake in people with CKD to improve health and reduce disease complications. A higher consumption of fiber exerts multiple health benefits, such as increasing stool output, promoting the growth of beneficial microbiota, improving the gut barrier and decreasing inflammation, as well decreasing uremic toxin production. Despite this, the majority of people with CKD consume less than the recommended dietary fiber intake, which may be due in part to the competing dietary potassium concern. Based on existing evidence, we see benefits from adopting a higher intake of fiber-rich food, and recommend cooperation with the dietitian to ensure an adequate diet plan. We also identify knowledge gaps for future research and suggest means to improve patient adherence to a high-fiber diet.
INTRODUCTION
Chronic kidney disease (CKD) is a public health problem with an increasing prevalence worldwide [1]. CKD continues to lead to higher healthcare costs [2] and is associated with poor health outcomes [3]. Regulation of nutrient homeostasis constitutes one of the cornerstones in its management in CKD [4]. The mainstay of dietary treatment for people with Stages 3–5 (not on dialysis) CKD has been the adoption of a low protein diet coupled with low electrolyte intake to reduce the risk of disease progress and complications such as hyperkalemia or hyperphosphatemia. Overzealous restriction of phosphorus and potassium typically results in the knock-on effect of lowering intake of fruits, vegetables, legumes, nuts and whole grains, consequently leading to a reduced intake of dietary fiber and poor dietary quality [5].
Emerging evidence suggests that a focus on dietary quality and diversity, particularly a diet rich in fiber, may have implications in the development and management of various diseases such as Type 2 diabetes, cancers, intestinal disease and cardiovascular disease (CVD) [6], and in complications such as intestinal dysbiosis or constipation [7]. In the general population, adequately powered controlled trials evaluating the effect of fiber supplementation as well as large cohort studies investigating habitual fiber-rich diets on health have resulted in the majority of countries recommending a daily intake of fiber for adults of 25–35 g/day [8]. Despite this recommendation, the average intake of dietary fiber by adults worldwide remains low, with estimated levels of intake below the recommended 25 g/day in the general population [9]. Unfortunately, this is even lower in people with CKD [10–15]. We argue, however, that the health benefits of fiber intake may also be relevant for the prevention of complications and management of patients with CKD. This narrative review aims to summarize current evidence and discusses the opportunities for increasing fiber intake in patients with CKD to improve health and disease complications.
WHAT IS FIBER?
The European Food Safety Authority defines dietary fiber as undigestible and unabsorbable carbohydrate polymers plus lignin, with scientific evidence of benefits for health [16]. Fiber can be divided into four subgroups: non-starch polysaccharides (present in fruits, vegetables, cereals and tubers); resistant oligosaccharides; resistant starch; and lignin associated with the dietary fiber polysaccharides (Figure 1). In this review, the term fiber encompasses dietary fiber (non-digestible carbohydrates and lignin that are intrinsic and intact in plants) as well as functional fiber (isolated non-digestible carbohydrates that have beneficial physiological effects in humans), including non-digestible carbohydrates with a degree of polymerization from 3 to 9 [8, 17].
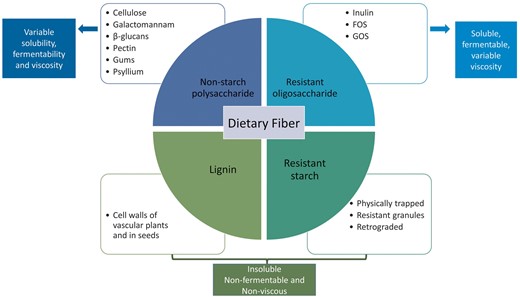
Dietary fiber types, classification and their different physicochemical characteristics (viscosity, solubility and fermentability). Solubility, viscosity and fermentability are physicochemical characteristics of fibers that determine the functional effects of fiber in the gut. Inulin and β-glucans are soluble, fermentable and non-viscous, with a prebiotic effect and short-chain fatty acids (SCFAs) production. Fructooligosaccharides (FOS), galactooligosaccharides (GOS), pectin, galactomannan and gums are soluble, viscous and fermentable, responsible for nutrient availability and SCFA production. Psyllium has moderate solubility, viscosity and low fermentability, with a functional effect on nutrient availability, faster transit and water holding capacity. Cellulose, lignin and resistant starch are insoluble, nonfermentable and non-viscous, being responsible for faster transit and stool bulking.
Dietary fibers can have different physicochemical characteristics (viscosity, fermentability or solubility) depending on their structure, that will influence not only their functional effects locally in the gastrointestinal (GI) tract (e.g. microbiota composition and transit time), but also systemically (such as cholesterol-lowering effects) (Figure 1). While resistant starch and lignin are mostly insoluble in water, the resistant oligosaccharides are often soluble. The solubility of non-starch polysaccharides depends on their length, composition of monomeric units and linkages [18]. Some soluble fibers are fermented by the intestinal microbiota, resulting in selective stimulation of growth and activity of beneficial bacteria, and short-chain fatty acids (SCFAs) production. The length and the structure of the molecule will define the fermentation pattern [19].
FUNCTIONAL CHARACTERISTICS OF FIBER AND KIDNEY HEALTH
Dietary fiber exerts its benefit on general health through several mechanisms, such as contributing to stool output, stimulating changes in microbial composition and metabolite production including the production of SCFAs in the colon, and glucose and lipid absorption in the small intestine. SCFA production has important effects in reducing inflammation, and on lipid and glucose metabolism that lead to positive systemic effects, in particular inhibition of carcinogenic mechanisms, protection against CVD, diabetes and obesity, and promoting a healthier gut microbiota (Figure 2). The above-mentioned mechanisms also have potential for kidney health. For example, dietary fiber consumption decreases circulating serum levels of urea [20], creatinine [20], p-cresyl sulfate (pCS) [21, 22] and indoxyl sulfate (IS) [23] (Figure 3).
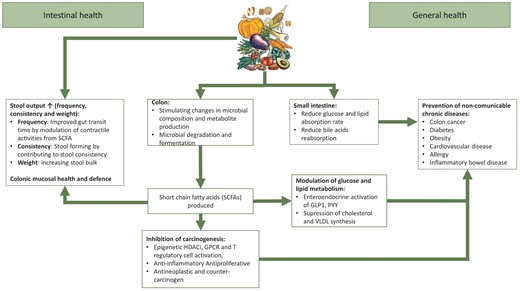
Functional effects of fiber in the intestinal and general health. There are several mechanisms by which dietary fiber exerts its functional properties in the gastrointestinal tract, including contributing to stool output (frequency, consistency and weight), stimulating changes in microbial composition and metabolite production including the production of short-chain fatty acids (SCFAs) in the colon and influencing glucose and lipid absorption in the small intestine. SCFAs have important effects in reducing inflammation, and on lipid and glucose metabolism which lead to positive systemic effects, in particular inhibition of carcinogenic mechanisms, protection against cardiovascular diseases (CVDs), diabetes and obesity, etc. HDACi, histone deacetylase inhibitor; GPCR, G-protein-coupled receptor; GLP-1, glucagon-like peptide-1; PYY, peptide YY; VLDL, very low-density lipoprotein.
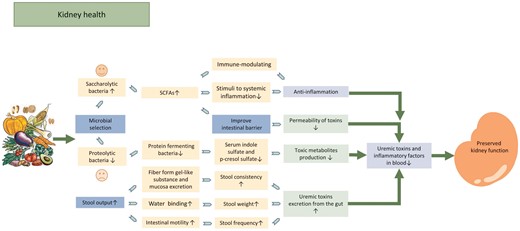
Potential mechanism of beneficial effect of fiber in patients with CKD. Dietary fiber intake decreases levels of uremic toxin in the blood by facilitating laxative to increase uremic toxin excretion and altering the microbiota (to facilitate the growth of less uremic toxin-producing bacteria and to improve the intestinal barriers thus reduces the permeability of toxins from gut to blood). Fiber intake promotes gut microbiota shift toward saccharolytic bacteria and increases SCFAs production. SCFAs contribute to kidney health by reducing stimuli to systemic inflammation, improve intestinal barrier, both modulating the immune system and the anti-inflammatory response. All these processes contribute to the reduction in uremic toxins and inflammations in the circulation and preserved kidney function as a result.
Laxative effect
Dietary fiber facilitates uremic toxin excretion from the colon by increasing stool output. Soluble, viscous, slowly fermented fibers form a gel when in contact with water, but do not undergo extensive fermentation. As such, the capacity of viscous fiber to interact with water is preserved throughout the colon. This can soften the stool and increase stool weight to alleviate constipation, and can also add firmness to loose stools [24, 25]. Conversely, insoluble fibers exert a laxative effect by stimulating the gut mucosa, which increases secretion and peristalsis [26–28]. In fact, nonfermentable insoluble fibers are more strongly related to transit time reduction in comparison with fermentable fibers, because the later do not remain physically intact in the colon [29]. However, fermentable fibers may also have a role in improving gut motility. Evidence from animal studies show that SCFAs, which are produced during the fermentation of fibers, modulate intestinal contractility and potentially reduce stool transit time in the intestine and colon [30].
Microbial selection, reduced production of uremic toxins and inflammation
There are two main types of bacteria in the gut: the saccharolytic (fermenting complex carbohydrates) and the proteolytic (preferably ferment amino acids as alternative substrate for energy harvesting) bacteria. Saccharolytic bacteria are regarded as ‘beneficial’ because of its downstream metabolites (mainly SCFAs) with anti-inflammatory, immune-modulating and gut integrity-promoting action. Further, the growth of saccharolytic bacteria limits the growth of proteolytic bacteria thus reducing the production of many toxic metabolites, such as amines and pCS [31]. Researchers and health professionals consider a ‘healthy gut’ one where saccharolytic fermentation is predominant [32, 33].
The imbalance of these two microbial families contributes to the accumulation of gut-derived uremic toxins and inflammation [34, 35]. The production of uremic toxins such as pCS, IS and trimethylamine-N-oxide, which are generated inside the body from metabolites produced by bacterial fermentation of protein, is strongly associated with the progression of end-stage kidney disease (ESKD) [36, 37]. Besides, these uremic toxins may be responsible for systemic inflammation, which in turn contributes to the progression of CKD [38].
Fermentable fibers, such as oligosaccharides, β-glucans, gums, hemicelluloses and some resistant starches, can be used as prebiotics, a substrate that can be rapidly utilized by saccharolytic bacteria to confer health benefits [39]. Commonly used prebiotics include galactooligosaccharides (GOS), fructooligosaccharides (FOS), oligofructose-enriched inulin and acarbose provided in soluble powder or syrup. Available data show that the type of fiber used seems to be important to induce beneficial effects on uremic toxin production [40–42]. Fibers that can be rapidly fermented in the proximal colon, such as FOS, may have a reduced effect on uremic toxin production compared with prebiotics that reach the distal part of the colon intact, such as inulin [43]. However, other factors such as the dose and duration of prebiotic supplementation likely exerts a major effect on the production of uremic toxins, and more studies are still needed to understand these mechanisms.
The fermentation of fibers produces SCFAs, primarily acetate, propionate and butyrate [32, 33], which, as already mentioned, have local and systemic beneficial effects in the body. A recent animal study showed that dietary fiber protects against diabetic nephropathy through modulation of the gut microbiota, enrichment of SCFA-producing bacteria, and increased SCFA production, mediated by activation of G protein-coupled receptors [44]. Besides, SCFAs may also contribute to kidney health by reducing stimuli to systemic inflammation, maintaining an intact mucosal barrier, modulating both the immune system and the anti-inflammatory response by regulating T cell [45] and modulating inflammatory genes [32, 33].
In general, diets high in nondigestible fibers have a lower dietary inflammatory score and have been associated with lower levels of interleukin-6 and C-reactive protein (CRP) [46]. In persons with CKD enrolled in the National Health and Nutrition Examination Survey (NHANES) III, each 10 g/day increase in total fiber intake decreased the odds of elevated CRP levels by 38% [47]. Similar anti-inflammatory effects have also been seen in hemodialysis (HD) patients consuming 10–20 g soluble fiber for 6 weeks [48].
Improved integrity of the intestinal barrier
The intestinal barrier is markedly compromised in both humans and animal models of CKD [49], in part as a result of altered gut microbiota composition. The marked reduction of colonic tight-junction proteins, such as occludin and zona occludens-1, allow for the penetration of uremic toxins through the intestinal epithelium to promote local inflammation in the GI tract [50]. Increased fiber intake could be beneficial for gut permeability and in this way contribute to reduce inflammation. Some studies indicate that SCFAs can promote gut-barrier integrity [51]. Mice feeding studies have shown that a diet containing 30% resistant starch delays tubular damage and interstitial fibrosis in mice with adenine-induced CKD, a mechanism that could be related to SCFA-mediated normalization of the expression of gut epithelial tight junction proteins [52].
FIBER INTAKE AND OUTCOMES IN PATIENTS WITH CKD
Emerging evidence describes various health benefits of higher fiber intakes with regards to the occurrence and progression of CKD as well as prevention of complications in these patients (Figure 4). Although encouraging, it should be noted that most studies to date are observational in nature, and association does not necessarily imply causation. When interpreting nutritional epidemiological studies, we need to pose some consideration: is the adopted diet a personal choice or the result of physician/dietitian recommendations? In persons at risk of CKD not visiting doctors, a high fiber diet may reflect healthier choices (diet rich in potassium and antioxidants) a healthier lifestyles (e.g. exercise). In persons with diabetes or those referred to nephrology care, it may be the result of a diet prescription. Societal context may also impact the observed associations: in some societies junk food and processed animal foods are cheaper and more commonly consumed than fresh foods by persons with low socioeconomic status. Conversely, in rural/developing areas, a high fiber consumption may signify a lack of finances to afford more expensive animal foods. Finally, food decisions may be the consequence of other disease states, such as old age, periodontitis, missing/decayed teeth or constipation, which are not uncommon features of patients with CKD and influence the choice of foods that are soft, easier to chew or swallow, or that promote bowel motility.
![Higher fiber intake and its health-related outcomes in patients with CKD. There is consistent evidence supporting higher intake of fiber and the primary prevention of CKD and improving constipation across patients with different stages of CKD, while the evidence associated with higher fiber intakes and other health-related outcomes such as progression of CKD, reduced risk of cardiovascular complications and all-cause mortality is inconsistent. The solid lines indicate the association between higher fiber intakes and health-related outcomes, while the dashed lines indicate no association between higher fiber intakes and health-related outcomes. The green box of outcomes indicates consistent results across nondialysis and dialysis CKD populations, while the blue box indicates inconsistent results. RCT, randomized control trial. The fiber supplements used in the interventions in the RCTs were: 11, cereals, cookies and snack bars with 23 g/day of added fiber for 4 weeks [53]; 12, muffins containing pea hull 10 g/day for the first 4 weeks, then pea hull 10 g/day + inulin 15 g/day for 6 weeks [42]; 14, one symbiotic gel [a mix of probiotics (Lactobacillus acidophilus and Bifidobacterium lactis Bi-07); 2.31 g of a prebiotic fiber (inulin); 1.5 g of omega-3 fatty acids and vitamins] per day in fasting for 2 months [54]; 18, about 20 g fructooligosaccharides (FOS) daily for 30 days [55]; 19, about 10 g/day Inulin-type fructan (ITF) for 12 weeks (12 weeks washout) [10]; 20, high-fiber diet (12 g fiber per day) for 4 weeks [56]; 21, resistant starch (9 g/day for the first week, 18 g/day for following weeks) [22]. References: 1, PREDIMED study [57]; 2, Fujii study [58]; 3, Carvalho study [59]; 4, Gopinath study [60], 5, Mirmiran study [61]; 6, ULSAM cohort study [62]; 7, Chiavaroli study [20]; 8, Wu study [21]; 9, Kelly study [63]; 10, ULSAM cohort study (eGFR <60 mL/min/1.73 m2) [64]; 11, Salmean study 2013 [53]; 12, Salmean study 2015 [42]; 13, Dos Santos study [65]; 14, Viramontes-Hörner study [54]; 15, Lin study [66]; 16, Wang study [15]; 17, Xu study [14]; 18, Meksawan study [55]; 19, Li study [10]; 20, Sutton study [56]; 21, Sirich study [22]; 22, Biruete [67]; and 23, Yang [23].](https://oup.silverchair-cdn.com/oup/backfile/Content_public/Journal/ckj/15/2/10.1093_ckj_sfab169/3/m_sfab169fig4.jpeg?Expires=1747860311&Signature=VGmMy~-wLRmXBUNDPvrbS8b9hDb40EQdxLGO3ZD-qLPn7VfTM39W4VwlwNXeZBZbSGRFj9tLjHA2QCCiQWrtqBC2qt7mLSWup9xIOuPySTqPqdtmZ7coHcjc4kXL8SlDb3P~JqQj5SMAlWsRDISD1SQKbd~VaW3Oeh8ETHHdx9de3-TNfAI0ruvj4071Rua0ZffoytoAX38ZBBnW9cnHpYZCYcoK~4HXtdo1Togaas-w9g-P--YAFswJfIx8sfL2soRJ5U83olU8tBC5oPXy8c-ind0FVp80D0nSGxF2AnE2s2TtYHorhM-A99rtzEQckl8aQbErkhL1CgNAZY-n9w__&Key-Pair-Id=APKAIE5G5CRDK6RD3PGA)
Higher fiber intake and its health-related outcomes in patients with CKD. There is consistent evidence supporting higher intake of fiber and the primary prevention of CKD and improving constipation across patients with different stages of CKD, while the evidence associated with higher fiber intakes and other health-related outcomes such as progression of CKD, reduced risk of cardiovascular complications and all-cause mortality is inconsistent. The solid lines indicate the association between higher fiber intakes and health-related outcomes, while the dashed lines indicate no association between higher fiber intakes and health-related outcomes. The green box of outcomes indicates consistent results across nondialysis and dialysis CKD populations, while the blue box indicates inconsistent results. RCT, randomized control trial. The fiber supplements used in the interventions in the RCTs were: 11, cereals, cookies and snack bars with 23 g/day of added fiber for 4 weeks [53]; 12, muffins containing pea hull 10 g/day for the first 4 weeks, then pea hull 10 g/day + inulin 15 g/day for 6 weeks [42]; 14, one symbiotic gel [a mix of probiotics (Lactobacillus acidophilus and Bifidobacterium lactis Bi-07); 2.31 g of a prebiotic fiber (inulin); 1.5 g of omega-3 fatty acids and vitamins] per day in fasting for 2 months [54]; 18, about 20 g fructooligosaccharides (FOS) daily for 30 days [55]; 19, about 10 g/day Inulin-type fructan (ITF) for 12 weeks (12 weeks washout) [10]; 20, high-fiber diet (12 g fiber per day) for 4 weeks [56]; 21, resistant starch (9 g/day for the first week, 18 g/day for following weeks) [22]. References: 1, PREDIMED study [57]; 2, Fujii study [58]; 3, Carvalho study [59]; 4, Gopinath study [60], 5, Mirmiran study [61]; 6, ULSAM cohort study [62]; 7, Chiavaroli study [20]; 8, Wu study [21]; 9, Kelly study [63]; 10, ULSAM cohort study (eGFR <60 mL/min/1.73 m2) [64]; 11, Salmean study 2013 [53]; 12, Salmean study 2015 [42]; 13, Dos Santos study [65]; 14, Viramontes-Hörner study [54]; 15, Lin study [66]; 16, Wang study [15]; 17, Xu study [14]; 18, Meksawan study [55]; 19, Li study [10]; 20, Sutton study [56]; 21, Sirich study [22]; 22, Biruete [67]; and 23, Yang [23].
FIBER INTAKE AND PRIMARY PREVENTION OF CKD
Multiple observational studies have linked higher fiber intake with the risk of developing CKD at the community level [58–62]. For example, in three large cohorts [57, 60, 62], the prevalence of CKD was between 40% and 50% lower among people with the highest consumption of fiber. The risk of developing CKD may be proportional to the amount of fiber ingested: in the Tehran Lipid and Glucose Study (n = 1630), the risk of incident CKD was 11% lower for every 5 g/day increase in total fiber intake [61]. A recent systematic review of seven trials showed that vegetarian dietary patterns, which are inherently higher in fiber compared with traditional western dietary patterns, were associated with lower levels of albuminuria and higher estimated glomerular filtration rate (eGFR) among participants with diabetic kidney disease [59].
FIBER INTAKE, UREMIC TOXINS AND CKD PROGRESSION
A diet low in fiber increases the intestinal production of nitrogenous waste products, contributing to uremia, secondary to increased proteolytic activities by protein fermenting bacteria [34]. This is supported by several small and short-term (4–12 weeks) trials of supplemented prebiotics (i.e. fiber) in people with CKD (Supplementary data, Table S1) that reported a reduction in uremic toxin levels [10, 21]. Because uremic toxins are central to the progression of CKD, some have hypothesized that fiber may slow the progression of CKD. Meta-analyses consistently show the uremic toxin-lowering effect of fiber supplementation on serum creatinine [20], pCS [21] and IS [23], although existing studies to date are of low sample size (typically ˂20 patients per trial). A reduction of serum uremic toxins following fiber supplementation has also been observed in patients receiving dialysis. Among patients on HD and compared with placebo, resistant starch significantly reduced plasma levels of IS [22] and inulin reduced pCS levels [41]. Among patients undergoing peritoneal dialysis (PD) and compared with placebo, inulin-type fructans (ITFs) lowered gut microbiome-generated indol levels [10]. The evidence on this matter is not universal, and Biruete et al. [67] have recently failed to observe any change on fecal pCS or plasma concentration of pCS and IS in a 4-week cross-over study in 12 patients on HD consuming inulin (10–15 g/day) or placebo. The types, dosage and duration of fiber supplementation and patients’ characteristics potentially influence the effect of dietary fiber on uremic toxins. Interventions showing the largest effect sizes have used fructan prebiotics like inulin [41, 42]. Controlled feeding trials in people with CKD have shown a reduction of serum concentrations of pCS a magnitude of 20% lower after 4 weeks of inulin [41, 42], to only 8% lower after 3 months of short-chain carbohydrates, such as FOS [40]. Although plausible, there is as yet no evidence from clinical trials that fiber intake can retard the progression of CKD. Future studies are warranted to evaluate the long-term effects of fiber, including the type and the dose of fiber on kidney-specific outcomes.
FIBER INTAKE AND CONSTIPATION IN PERSONS WITH CKD
Constipation is relatively common among patients with CKD, present in as many as 29% of patients on continuous ambulatory PD (CAPD) and 63% of patients on HD [68]. This difference in prevalence of constipation between dialysis modalities has been attributed to differences in fiber intake: the average daily dietary fiber intake in the CAPD group was (11.0 ± 4.0 g), about twice that in the HD group (5.9 ± 2.7 g) [68]. We speculate that because CAPD patients often preserve their residual kidney function, this may allow for higher intake of plant foods for some individuals. Despite diversity in study designs and patient characteristics, fiber supplementation studies consistently report lower incidence of constipation and alleviation from constipation among patients on HD [65, 62], PD [54, 56] and nondialysis CKD than in patients not receiving supplementation [53, 69].
FIBER INTAKE AND CARDIOVASCULAR COMPLICATIONS IN PERSONS WITH CKD
Dietary fiber improves a variety of CVD risk factors, such as glycemic control, cholesterol levels and blood pressure [70, 71], all of which have been associated with decreased CVD risk [6]. However, the evidence linking fiber intake with the risk of CVD among patients with CKD has not always been consistent. Two observational studies in patients on dialysis [15, 66] report an inverse association between higher intake of fiber has lower risk of cardiovascular death. However, other studies of patients on PD [14] or with nondialysis CKD [64] failed to observe any statistical association. It is difficult to discern whether these differences between studies are explained by low power, differences in the ascertainment of fiber intake from food recalls (and the inherent recall bias of these methods), differences in lifestyle or baseline fiber intake. The associations might be only within the cohort, that is, comparing low versus high intake in a population that overall may have a very high or a very low intake (Table 1). As we discussed earlier, both healthy lifestyles and low social economic status are important determinants of food choices and be contribute the observed association between fiber intake and CVD [74].
Fiber intake in studies including patients with CKD
| References | Patients | Sample | Fiber intake (g/day)a | Country |
|---|---|---|---|---|
| Lin et al. [12] | HD | n = 1044 | <14 g in 90% of the sample | China |
| Demirci et al. [13] | n = 128 | 12.6 ± 4.7 | Turkey | |
| Martins et al. [72] | n = 54 | 13.2 ± 6.6 | Brazil | |
| Yasuda et al. [68] | n = 30 | 5.9 ± 2.7 | Japan | |
| Li et al. [10] | PD | n = 15 | 7.6 ± 2.9 | China |
| Erthal Leinig et al. [73] | n = 52 | 8.7 ± 6.6 | Brazil | |
| Wang et al. [15] | n = 219 | 5.0 ± 2.5 | Hong Kong | |
| Xu et al. [14] | n = 881 | 8.2 ± 3.4 | China | |
| Yasuda et al. [68] | n = 42 | 11.0 ± 4.0 | Japan | |
| Xu et al. [64] | CKD (nondialysis) | n = 390; Stages 3–5 | 16.6 (14.5–19.1) | Sweden |
| Rossi et al. [11] | n = 40; Stages 4 and 5 | 23.8 ± 8 | Australia |
Mean ± SD or median (quartile).
FIBER INTAKE AND RISK OF MORTALITY IN PERSONS WITH CKD
Adherence to fiber-rich plant-based diets is generally associated with reduced risk of all-cause mortality in the general population [75, 76]. Although lacking interventional studies on the matter, available observational evidence suggests this may be possibly the case in people with CKD [47, 62, 63]. Healthy dietary patterns characterized by a higher content of fruits, vegetables and whole grains were consistently associated with a reduced risk of all-cause mortality in a meta-analysis including seven studies involving 15 285 participants with CKD [63]. Interestingly, there are data suggesting that the association between fiber intake and mortality is stronger in persons with nondialysis CKD compared with persons without CKD [47, 61], perhaps evidencing a population generally deficient in fiber that could benefit most from supplementation. For example, the Uppsala Longitudinal Study of Adult Men study reported that higher dietary fiber was associated with lower mortality in participants with eGFR <60 mL/min/1.73 m2 [hazard ratio (HR) = 0.58; 95% CI 0.35–0.98], but not in patients with normal kidney function (HR = 1.30; 95% CI 0.76–2.22; P = 0.04) [62]. Similarly, in a study from the NHANES III in the USA, every 10 g/day increase of dietary total fiber intake was inversely related to mortality in participants with CKD (HR = 0.81; 95% CI 0.71–0.93), but no association was found among participants with normal kidney function (HR = 1.04, 95% CI 0.94–1.18) [47]. However, some studies have failed to observe any link between fiber and the risk of death in patients with HD [66] or PD [14].
CHALLENGES FOR INCREASING DIETARY FIBER IN CKD
The recommendations for fiber intake in the general population have changed over the last decade. Instead of recommending a specific amount of fiber intake per day, focus has shifted to patterns of diet that are likely to achieve sufficient and adequate nutrition intake (including fiber) [77]. Dietary guidelines for people with CKD often fail to make any recommendation on fiber intake (Table 2). Perhaps due to food sources rich in fiber also being a source of potassium, there is concern that people with advanced CKD may be at risk of hyperkalemia if they consume too many plant foods [84–87]. Because clinicians tend to favor simple restriction of foods rather than routinely referring patients for dietetic counseling [88], this often leads to a worse dietary quality, lower potassium, low fiber and higher intake of ultra-processed foods [89, 90]. Although well-intended, the evidence to support the concern of hyperkalemia induced by plant foods is very low. There are indeed studies to suggest that postprandial hyperkalemia may be higher in patients on HD [91], but in the long-term, the association between dietary potassium and serum potassium is, if any, rather weak [92–97]. It is possible that in the long-term, compensatory mechanisms that emerge in advanced CKD attempting to maintain potassium homeostasis, such as increased colonic potassium excretion [98, 99] and increased cellular potassium uptake, play a role [100, 101]. Supporting this, cross-sectional studies see weak or no correlations between serum potassium and dietary potassium in advanced CKD and dialysis [92, 94–96]. Furthermore, cohort studies fail to identify a relationship between diets rich in fruits and vegetables and serum potassium levels [97]. Interestingly, the association of higher intake of fruits and vegetables tends to favor a lower mortality risk in patients on maintenance HD [102].
Dietary recommendation of fiber and potassium from clinical guidelines for patients with CKD
| References | Fiber (g/day) | Potassium (mg/day) | Observation |
|---|---|---|---|
| European Best Practice Guideline on Nutrition [78] | No specific recommendation | 1950–2730 (if serum potassium >6 mmol/L) | |
| European Society for Clinical Nutrition and Metabolism CKD [79] | No specific recommendation | CKD (NDD): 1500–2000 mg/day; HD and PD: 2000–2500 mg/day | |
| Kidney Health Australia—Caring for Australians With Renal Impairment guideline [80] | Consume a diet rich in dietary fiber | Patients with hyperkalemia should lower their potassium intake | Consume a balanced diet rich in fruits and vegetables. Consume a Mediterranean-style diet |
| US Academy of Nutrition and Dietetics expert opinion comment [81] | 25–35 g/day | 2000–4000 mg day. Restriction if hyperkalemia is present | Same as the general population |
| National Kidney Foundation/The KDOQI Nutrition [4] | No specific recommendation | Adjust the dietary potassium to maintain normokalemia | Individualized prescription of vegetables and fruits to maintain normokalemia and to reach health goals such as decrease body weight, blood pressure and net acid production. Dietary pattern similar to the Mediterranean diet is encouraged |
| KDIGO Diabetes [82] | No specific recommendation | No specific recommendation. In advanced CKD, dietary potassium may need to be restricted. Eat lower potassium content fruits and vegetables and limits nuts. Salt substitutes containing potassium should not be used | Individualized diet high in vegetables, fruits, whole grains, fiber, legumes, plant-based proteins, unsaturated fats and nuts. Consider diabetes recommendations for fruits and vegetables |
| KDIGO Blood Pressure [83] | No specific recommendation | No specific recommendation. For CKD patients not on dialysis, DASH diet and use of salt substitutes may not be appropriate in patients with advanced CKD due to the risk of hyperkalemia |
DASH, Dietary Approaches to Stop Hypertension; NDD: nondialysis dependent.
By restricting foods rich in fiber to prevent hyperkalemia, we reject the fact that potassium absorption, distribution and excretion are influenced by the co-ingestion of other nutrients in the diet [86]. For instance, among patients on dialysis, ingestion of a potassium bolus together with glucose/fructose reduced the postprandial potassium rise by half [91]. Co-ingestion of potassium bolus with other alkali facilitates intracellular potassium deposition and favors potassium kidney excretion, resulting in lower serum potassium levels [103]. We also know that in healthy subjects, a high-fiber diet increases fecal potassium excretion by increasing stool volume and alleviating constipation [104]. An old report of people with CKD also shows that administration of 7 g of psyllium (fermentable fiber) resulted in a 32% increase in fecal potassium excretion [105]. All these nutrients (glucose, fructose, alkali and fiber) are present in fruits and vegetables and overall add support for the notion that a plant-based diet may not be unsafe for people with CKD. We speculate that by restricting fruits and vegetables we may be facilitating rather than preventing potassium absorption [96, 97, 102]. Finally, the bio-availability of potassium in form of unprocessed and fresh fruits and vegetables may be lower than that from potassium coming from protein foods and processed plant foods (e.g. processed fruit and juices) [106]. The 2020 Kidney Disease Outcomes Quality Initiative (KDOQI) guidelines recommend ‘adjusting’ potassium intake ‘when needed’ to maintain potassium levels in the normal range, but not routinely, as this may result in deficiencies of other healthy nutrients such as fiber [85]. Clinicians should heed this evidence-based advice, and be encouraged to consider whether by routinely restricting plant-based foods, they are compromising other aspects of their patients’ health.
STRATEGIES TO PROMOTE FIBER INTAKE IN PERSONS WITH CKD
There is no one-size fits all to help patients achieve a fiber-rich dietary pattern. This requires nutritional expertise where individual circumstances, medical history, habitual diet and patient goals are carefully considered.
The current recommendation set to achieve sufficient fiber intake for the general population is a diet containing 2–3 servings of fruits/day, 1–2 servings of vegetables/day; 1 serving of legumes/day; and 2–5 servings of whole grains/day [107]. Generally, we propose to adopt this pattern of eating for patients with CKD, including dialysis patients who do not have apparent hyperkalemia. However, since these patients are at risk for developing hyperkalemia, a regular follow-up on the serum potassium is advised. If hyperkalemia is present or if serum potassium control is challenging for a particular patient, nutritional education to replace fruits and vegetables with high potassium content for those with low potassium content is desirable. In such cases, patients should be referred to a qualified dietitian to ensure an adequate diet quality while also achieving a lower dietary intake of potassium. In Table 3, we list common plant foods according to their fiber and potassium content/serving. The ratio of potassium (mEq)/fiber (g) shown in the table can help clinicians and dietitians to quickly grasp amounts of potassium in relation to fiber of common foods. However, this ratio should not guide decision making when planning dietary counseling, as it has been shown that adherence to dietary plans containing many restrictions is low [108]. Patients chose their foods based on their individual circumstances including dietary preferences, socioeconomic and cultural conditions, food availability, and many other personal and external factors [108]. We believe it may be difficult for patients to understand yet another ratio (such as the phosphorus to protein ratio) and it may therefore become a barrier to healthy eating due to fear of making the wrong dietary choices.
List of foods according to the fiber, potassium, energy and phosphate content per servingc
| Types of food | Serving and grams | Fiber | Potassium | Phosphate | Energy | Potassium/fiber ratio | |
|---|---|---|---|---|---|---|---|
| g | mg K | mEq | mg | kcal | mEq/g | ||
| Legumes (beans and peas) | |||||||
| Fava beans, cooked | 1/2 cup (92 g) | 4.6 | 229a | 5.9a | 107 | 147 | 1.28 |
| Chickpeas, canned | 1/2 cup (90 g) | 6.6 | 216a | 5.5a | 120 | 131 | 0.84 |
| Green peas, cooked | 1/2 cup | 4.7 | 200a | 5.2a | 90 | 67.2 | 1.10 |
| Lentils, canned | 1/2 cup (92 g) | 6.7 | 316a | 8.1a | 154 | 152 | 1.21 |
| Soybeans, cooked | 1/2 cup (92 g) | 5.1 | 441b | 11.3b | 210 | 200 | 2.22 |
| Vegetables | |||||||
| Carrot, cooked | 1 medium (100 g) | 2.9 | 333a | 8.5a | 36 | 43 | 2.94 |
| Carrot, raw | 1/2 cup (60 g) | 1.7 | 192a | 4.9b | 21 | 25 | 2.90 |
| Broccoli (raab), cooked | 1/2 cup (85 g) | 2.3 | 168 | 4.3 | 63 | 39 | 1.87 |
| Cauliflower, cooked | 1/2 cup (85 g) | 1.8 | 264a | 6.8a | 39 | 22 | 3.76 |
| Cabbage, raw | 1/2 cup (45 g) | 1 | 109 | 2.8 | 14 | 14 | 2.79 |
| Radishes, raw | 5 units (25 g) | 0.5 | 55 | 1.4 | 5 | 5 | 2.82 |
| Tomato, raw | 1/2 cup (90 g) | 1.1 | 213a | 5.5a | 22 | 16 | 4.97 |
| Beet, raw | 1/2 cup (68 g) | 2 | 221a | 5.7a | 27 | 29 | 2.83 |
| Persimmon | 1 medium (170 g) | 6.1 | 274a | 7.0a | 29 | 119 | 1.15 |
| Pumpkin, cooked | 1/2 cup (115 g) | 0.6 | 407b | 10.4b | 53 | 59 | 17.39 |
| Fruits | |||||||
| Pineapple | 1/2 cup (83 g) | 1.2 | 91 | 2.3 | 7 | 42 | 1.94 |
| Apple | 1 cup (125 g) | 3 | 134 | 3.4 | 14 | 65 | 1.15 |
| Mango | 1/2 cup (83 g) | 1.3 | 139 | 3.6 | 12 | 50 | 2.74 |
| Pear | 1 cup (125 g) | 3.9 | 145 | 3.7 | 15 | 71 | 0.95 |
| Peach | 1 cup (155 g) | 2.3 | 189 | 4.8 | 34 | 65 | 2.11 |
| Plum | 1 cup (155 g) | 2.2 | 243a | 6.2a | 25 | 71 | 2.83 |
| Banana | 1 cup (150 g) | 3.9 | 537b | 13.8b | 33 | 134 | 3.53 |
| Melon cantaloupe | 1 cup (155 g) | 1.2 | 243a | 6.2a | 26 | 53 | 5.19 |
| Watermelon | 1 cup (155 g) | 0.6 | 174 | 4.5 | 17 | 47 | 7.44 |
| Orange | 1 medium (155 g) | 3.7 | 279a | 7.2a | 22 | 72 | 1.93 |
| Tangerine/clementine | 1 medium (109 g) | 2 | 181 | 4.6 | 22 | 58 | 2.32 |
| Strawberry | 10 units (100 g) | 1.6 | 89 | 2.3 | 20 | 35 | 1.44 |
| Grapefruit | 1/2 unit (154 g) | 2.5 | 200a | 5.3a | 28 | 65 | 2.13 |
| Kiwi | 2 units (150 g) | 4.5 | 296a | 7.6a | 51 | 87 | 1.69 |
| Avocado | 1/2 cup (70 g) | 5 | 364a | 9.3a | 120 | 39 | 1.87 |
| Grapes | 1 cup (150 g) | 1.4 | 286a | 7.3a | 30 | 104 | 5.24 |
| Figs, dried | 1/4 cup (40 g) | 4 | 272a | 7.0a | 27 | 100 | 1.74 |
| Seeds and nuts | |||||||
| Almonds, roasted unsalted | 1/4 cup (28 g) | 3 | 194a | 5.0b | 128 | 170 | 1.66 |
| Sunflower seed, roasted | 1 tbsp (10 g) | 1.1 | 80 | 2.1 | 54 | 107 | 1.86 |
| Brazilian nuts | 3 units (15 g) | 0.9 | 99 | 2.5 | 108 | 99 | 2.82 |
| Whole cereals | |||||||
| Bulgur, raw | 1/2 cup (70 g) | 3 | 48 | 1.2 | 28 | 58 | 0.41 |
| Oats, raw | 1/2 cup (40 g) | 4 | 147 | 3.8 | 166 | 153 | 0.94 |
Medium potassium content according to the servings;
High potassium content according to the servings. The potassium content of cooked items was evaluated using regular cooking procedures and not applying the procedure and methodology used to diminish the potassium content.
Extracted from the food composition table from the US Department of Agriculture, https://fdc.nal.usda.gov/.
Nutrient leeching is an effective strategy to reduce potassium content of foods, but one that comes at the cost of worse taste and palatability. Emphasis and education are needed here, recommending vegetables to be unpeeled and cut-up to increase their surface area before submerging in water. The water should then be drained after boiling, and the vegetables should be washed in cold water before consumption. This method can reduce the potassium content in vegetables, legumes and tuberous roots by 60–80% [109–111]. Clinicians and patients should be advised that this procedure also diminishes the content of other water-soluble vitamins, but when executed correctly, this is still a very practical way to allow the intake of high-potassium containing plant foods and ensure adequate intake of fiber.
When dietary counseling is not possible or not enough, the use of probiotic, prebiotic or synbiotic (a combination of probiotic and prebiotic) supplements can be proposed [43, 112]. Notwithstanding the fact that complex food matrices provide different types of fibers and other beneficial substances, the use of prebiotic fiber could become an ally in restoring the intestinal symbiotic environment of these patients.
EVIDENCE GAPS AND CONCLUSIONS
The consumption of fiber by CKD patients is very low, which likely owes to overzealous and ongoing dietary restrictions placed on them. In this review, we have shown evidence supporting potential health benefits if people with CKD consume more fiber in their diets. We have shown that increasing fiber intake improves stool output, promotes the growth of beneficial bacteria and improves gut-barrier function. This results in lower production of uremic toxins and lower systemic inflammation.
Evidence discussed in this review suggests that a fiber-rich, plant-based diet may be useful in both primary and secondary prevention of CKD, but we recognize that long-term trials are lacking. However, powered trials evaluating lifestyle choices are challenging and are lacking for most non-communicable diseases. We propose considering a higher intake of fiber-rich foods for patients with CKD. When hyperkalemia is present or when serum potassium is difficult to control, a dietary plan should be set to ensure low potassium intake within the context of fiber-rich foods and diet quality. To achieve this, we strongly recommend cooperation with a qualified dietitian. Future research should focus on establishing safe transitions toward higher fiber intake, and how to best support patients achieve this in the long term.
As physicochemical characteristics of fiber such as solubility, viscosity and fermentability drive different functionalities, future research should not only focus on the total fiber intake, but also on the health impact of different types of fiber. Many clinical questions remain unanswered—such as the optimal intake, type and source of fiber required, particularly on long-term hard endpoints, such as incidence of ESKD and mortality in people with CKD.
SUPPLEMENTARY DATA
Supplementary data are available at ckj online.
ACKNOWLEDGEMENTS
The authors are members of the ERA European Renal Nutrition Working Group, an initiative of and supported by the European Renal Association (ERA). Further information on this Working Group and its activities can be found at https://www.era-online.org/en/ern/. G.B.S. acknowledges support by the ERA young fellowship program. We acknowledge Fangyu Chen for the documentation work during this review.
FUNDING
This work was supported by the Swedish Research Council (#2019-01059), the Karolinska Institutet’s internal research funds (No. 2020-01616), National Nature Science Foundation of China (No. 82004205) and China Postdoctoral Science Foundation (No. 2020M672741; No. 2020TQ0137), and partially supported by the Science and Technology Research Fund from Guangdong provincial hospital of Chinese medicine, China (No. YN2018QL08).
CONFLICT OF INTEREST STATEMENT
The authors declare no conflicts of interest.


Comments