


ABSTRACT
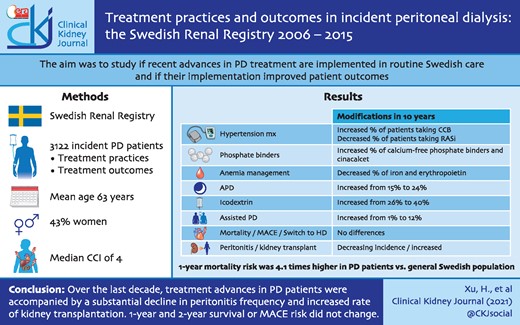
Therapeutic developments have contributed to markedly improved clinical outcomes in peritoneal dialysis (PD) during the 1990s and 2000s. We investigated whether recent advances in PD treatment are implemented in routine Swedish care and whether their implementation parallels improved patient outcomes.
We conducted an observational study of 3122 patients initiating PD in Sweden from 2006 to 2015. We evaluated trends of treatment practices (medications, PD-related procedures) and outcomes [patient survival, major adverse cardiovascular events (MACEs), peritonitis, transfer to haemodialysis (HD) and kidney transplantation] and analysed associations of changes of treatment practices with changes in outcomes.
Over the 10-year period, demographics (mean age 63 years, 33% women) and comorbidities remained essentially stable. There were changes in clinical characteristics (body mass index and diastolic blood pressure increased), prescribed drugs (calcium channel blockers, non-calcium phosphate binders and cinacalcet increased and the use of renin–angiotensin system inhibitors, erythropoietin and iron decreased) and dialysis treatment (increased use of automated PD, icodextrin and assisted PD). The standardized 1- and 2-year mortality and MACE risk did not change over the period. Compared with the general population, the risk of 1-year mortality was 4.1 times higher in 2006–2007 and remained stable throughout follow-up. However, the standardized 1- and 2-year peritonitis rate decreased and the incidence of kidney transplantation increased while transfers to HD did not change.
Over the last decade, treatment advances in PD patients were accompanied by a substantial decline in peritonitis frequency and an increased rate of kidney transplantations, while 1- and 2-year survival and MACE risk did not change.
INTRODUCTION
Mortality and cardiovascular morbidity are extremely high in people on kidney failure replacement therapy (KFRT) [1]. However, during the 21st century there have been considerable advances in the medical treatment of people with end-stage kidney disease. Newer therapies such as calcium-free phosphate binders [2] and calcimimetics [3] have improved the control of chronic kidney disease–mineral and bone disorder (CKD-MBD) and clinical trials have established evidence-based haemoglobin and iron targets for anaemia treatment [4, 5].
In patients on peritoneal dialysis (PD), a series of innovations and the implementation of evidence-based clinical practices have reduced the incidence of peritonitis and other therapy-related complications, allowing patients to be maintained on PD for longer periods [6]. Technical advances have been introduced, such as more biocompatible glucose-based dialysis solutions with fewer detrimental effects on the peritoneal structure and function [7], icodextrin-based long-dwell dialysis fluid facilitating fluid management [8], improved techniques for automated PD (APD) providing lifestyle benefits [9, 10] and new APD devices for remote patient monitoring to improve prescription compliance [11, 12].
During the last decades we have witnessed improvements in the overall survival and cardiovascular mortality of people on KFRT, not least for patients undergoing PD [1, 13]. In Europe, patients on PD experienced a trend towards better survival compared with patients on haemodialysis (HD) between 1993 and 2007, and technique survival also improved [14]. Whether these improvements in outcomes extend to more recent years and how new therapeutic advances in PD are being implemented is not yet known.
The purpose of this analysis was to describe changes in treatment practices and clinical outcomes in a contemporary nationwide cohort of patients starting PD therapy. As study outcomes, we evaluated the risk of death, major cardiovascular events (MACEs), peritonitis frequency, transfer to HD and kidney transplantation incidence. We further compared trends of mortality and MACE incidence with those reported for the general Swedish population.
MATERIALS AND METHODS
Study population
We used information from the Swedish Renal Registry (SRR), which is a nationwide register of patients on KFRT in Sweden (https://www.medscinet.net/snr/) [15] with national coverage since 1991. In addition to data on KFRT initiation, continuously updated information on treatment modalities and subsequent treatment changes (including switch to HD and kidney transplantation), the register also collects yearly information on clinical characteristics, laboratory measurements and dialysis-related information. It has been estimated that >95% of all prevalent dialysis patients in Sweden are included in the yearly follow-up.
We included all patients who initiated KFRT with PD in Sweden between 1 January 2006 and 31 December 2015. Exclusion criteria were missing information on age or sex (n = 30) and dialysis treatment <3 months (due to death, change of dialysis modality or kidney transplantation) (n = 986) (Supplementary data, Figure S1). After exclusions, a total of 3122 PD patients were included. The data were linked to the Swedish National Patient Register (an administrative healthcare utilization data source), the Prescribed Drug Register (a nationwide register of dispensed medications), the Population Register and the Causes of Death Register (a nationwide register for causes of deaths) and anonymized. All patients were informed about their participation in the registry (SRR) and were able to opt out according to the Swedish regulations for research in quality-control registers. The study protocol was approved by the regional ethics committee in Stockholm.
Exposure
The 10-year baseline period was divided into 2-year blocks (2006–2007, 2008–2009, 2010–2011, 2012–2013 and 2014–2015) and each 2-year block was used as the study exposure. The rationale for using 2-year blocks was the need for adequate numbers of events during the 1- and 2-year follow-up periods when comparing standardized incidence rates between time periods and allowing adjustments for multiple comorbidities and treatments.
Outcomes definitions and covariates
The primary study outcomes were 1- and 2-year all-cause mortality and MACEs (composite of cardiovascular mortality, myocardial infarction, hospitalization for heart failure and stroke). The secondary outcomes were 1- and 2-year rates of kidney transplantation, transfer from PD to HD and PD-related peritonitis (for definitions, see Supplementary data, Table S1). The reason for limiting the analyses to short-term outcomes occurring within 1 and 2 years was to ensure that all patients had a full 1- or 2-year follow-up time.
Information on age, sex and selected comorbidities was collected from the SRR and the National Patient Register, which contain complete documentation of all diagnoses issued since inception of the International Classification of Diseases, Tenth revision (ICD-10th) system in 1997 (Supplementary data, Table S2). Definition of comorbidities was based on ICD-10 codes [16]. Medications were obtained from the SRR and enriched with information from the Prescribed Drug Register, which contains information on all dispensed drugs at Swedish pharmacies since 2006. Clinical characteristics [blood pressure (BP) and body mass index (BMI)], laboratory results and treatment characteristics [use of icodextrin, proportion of APD, assisted PD, weekly creatinine clearance and weekly Kt/V (including residual renal function, if present)] were collected from the SRR.
Statistical analysis
Continuous variables are displayed as mean ± standard deviation (SD) or median and interquartile range (IQR) and categorical variables as proportions. Differences over time were tested by Jonckheere–Terpstra trend test for categorical variables and with a linear-by-linear trend test for continuous data. Participants were censored at death, kidney transplantation, switch to HD or the end of follow-up (31 December 2017), whichever occurred first.
Standardized incidence rates of 1- and 2-year short-term outcomes were performed using logistic regression models to account for the effect of differences in patient characteristics throughout the observation period [17]. Stepwise adjustment for explanatory variables included (i) age and sex and (ii) baseline comorbidities (hypertension, diabetes, cardiovascular disease, stroke, atrial fibrillation, chronic obstructive pulmonary disease, rheumatoid disease and cancer).
To assess the effect of time on outcomes, a similar standardization analysis was also performed with the simplifying assumption of a constant hazard ratio (HR) for moving one 2-year block forward, facilitating the computation of confidence intervals (CIs) for the trend. Coxproportional hazard models (for 1-year and 2-year outcomes) were fitted. Stepwise adjustments were performed for (i) age and sex, (ii) baseline comorbidities and (iii) treatment. Sensitivity analyses were performed for PD treatment as intentionto treat, and thus without censoring at kidney transplantation and transfer to HD. To account for mortality changes in the underlying background general population, standardized incidence rate ratios (SIRRs) were also calculated, using an age-, sex- and calendar-year-matched general population from Statistics Sweden (www.scb.se).
Data on BMI, systolic BP, diastolic BP, C-reactive protein, albumin, ferritin, haemoglobin, calcium, phosphate and parathyroid hormone (PTH) were missing for 794 (25%), 984 (32%), 989 (32%), 1087 (35%), 709 (23%), 1592 (51%), 703 (23%), 1135 (36%), 712 (23%) and 947 (30%) patients, respectively. Since clinical and laboratory values were only registered in some patients, these values were only used for description and not used in the analyses to avoid selection bias. All analyses were performed using R (https://www.r-project.org) and Stata version 15.0 (StataCorp, College Station, TX, USA).
RESULTS
Changes in clinical characteristics and laboratory values
The study comprised 3122 incident PD patients (mean age 63 ± 15 years, 34% women) who had been on dialysis treatment >3 months. A flow chart of patient selection is presented in Supplementary data, Figure S1. Across the 2-year time blocks there were no changes at PD initiation in mean age or sex distribution, while BMI and diastolic BP increased (Table 1). The prevalence of most comorbidities and the Charlson comorbidity index were stable over the period, except for an increase in chronic obstructive pulmonary disease. The mean/median levels of C-reactive protein, albumin and haemoglobin decreased, and PTH increased, albeit with minor absolute differences.
Baseline characteristics for incident PD patients (>3 months on dialysis) in Sweden between 2006 and 2015
| Time period | 2006–2007 | 2008–2009 | 2010–2011 | 2012–2013 | 2014–2015 | P-valuea |
|---|---|---|---|---|---|---|
| N | 647 | 660 | 604 | 610 | 601 | |
| Demographics | ||||||
| Age (years), mean (SD) | 63.0 (14.6) | 63.1 (15.4) | 64.4 (15.1) | 63.5 (15.1) | 62.3 (16.1) | 0.86 |
| Women, % | 33 | 35 | 33 | 34 | 33 | 0.88 |
| Clinical characteristics | ||||||
| BMI (kg/m2), mean (SD) (n = 2328) | 25.8 (4.1) | 26.0 (4.5) | 26.2 (4.6) | 26.6 (4.7) | 26.3 (4.6) | 0.02 |
| SBP (mmHg), mean (SD) (n = 2138) | 135 (20.0) | 136 (21.2) | 138 (22.4) | 136 (20.6) | 138 (20.2) | 0.16 |
| DBP (mmHg), mean (SD) (n = 2133) | 77 (11.6) | 78 (11.5) | 78 (12.6) | 78 (12.1) | 79 (11.6) | 0.03 |
| Laboratory values | ||||||
| CRP (mg/L), median (IQR) (n = 2035) | 5.0 (3.0–12.0) | 5.0 (2.4–10.0) | 5.0 (2.1–12.0) | 4.3 (2.0–10.0) | 5.0 (1.9–10.0) | 0.01 |
| Albumin (g/L), mean (SD) (n = 2413) | 32 (5.2) | 32 (5.7) | 31 (5.1) | 32 (5.3) | 31 (5.7) | 0.002 |
| Ferritin (pmol/L), median (IQR) (n = 1530) | 238 (128–431) | 282 (143–433) | 280(140–436) | 273(140–500) | 227 (130–380) | 0.59 |
| Hb (g/dL), mean (SD) (n = 2419) | 124 (15) | 119 (14) | 118 (14) | 116 (13) | 115 (14) | <0.001 |
| Ca (mmol/L), mean (SD) (n = 1987) | 2.5 (0.1) | 2.5 (0.2) | 2.5 (0.2) | 2.5 (0.2) | 2.5 (0.2) | 0.06 |
| Phosphorus (mmol/L), mean (SD) (n = 2410) | 1.6 (0.4) | 1.6 (0.4) | 1.5 (0.4) | 1.5 (0.4) | 1.6 (0.5) | 0.98 |
| PTH (pmol/L), median (IQR) (n = 2175) | 21 (11–31) | 19 (11–32) | 22 (12–38) | 24 (14–39) | 23 (13–40) | <0.001 |
| Comorbidities, % | ||||||
| CCI, mean (SD) | 3.9 (2.1) | 4.0 (2.1) | 4.1 (2.2) | 4.1 (2.3) | 4.1 (2.2) | 0.38 |
| Hypertension | 98 | 99 | 98 | 99 | 99 | 0.78 |
| Diabetes mellitus | 36 | 40 | 36 | 33 | 33 | 0.06 |
| Cardiovascular disease | 33 | 35 | 38 | 37 | 33 | 0.56 |
| Congestive heart failure | 13 | 16 | 16 | 15 | 12 | 0.58 |
| Myocardial infarction | 13 | 13 | 12 | 15 | 11 | 0.66 |
| Peripheral vascular disease | 10 | 9 | 10 | 12 | 10 | 0.61 |
| Cerebrovascular disease | 11 | 13 | 15 | 14 | 13 | 0.36 |
| Stroke | 8 | 9 | 12 | 9 | 9 | 0.54 |
| Atrial fibrillation | 6 | 11 | 8 | 7 | 8 | 0.84 |
| Chronic obstructive pulmonary disease | 3 | 3 | 3 | 5 | 7 | <0.001 |
| Rheumatoid disease | 5 | 3 | 4 | 3 | 3 | 0.16 |
| Cancer (within 3 years) | 8 | 6 | 8 | 8 | 10 | 0.06 |
aP-values were tested with a Jonckheere–Terpstra trend test for categorical variables and with a linear-by-linear trend test for continuous data. Significant values are in bold.
SBP, systolic blood pressure; DBP, diastolic blood pressure; CRP, C-reactive protein; CCI, Charlson comorbidity index.
Changes in treatment characteristics and medications
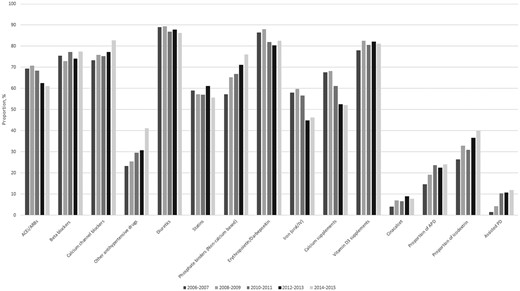
Over the 10-year period, the proportion of patients using calcium channel blockers and other antihypertensive drugs increased, while the use of angiotensin-converting enzyme inhibitors (ACEis) and angiotensin receptor blockers (ARBs) decreased (Table 2). The proportion of patients prescribed calcium-free phosphate binders and cinacalcet increased, whereas the use of calcium-containing phosphate binder supplements decreased substantially, as did treatment with iron and erythropoietin. The prevalence of patients who underwent APD increased from 15% to 24%, the use of icodextrin-based dialysis fluid increased from 26% to 40% and patients receiving assisted PD increased from 1% to 12% (Table 2 and Figure 1).
Medication and dialysis treatment characteristics in Swedish incident PD patients in the Swedish Renal Registry 2006–2015.
Prescribed drugs and dialysis treatment characteristics for incident peritoneal patients between 2006 and 2015
| Time period | 2006–2007 | 2008–2009 | 2010–2011 | 2012–2013 | 2014–2015 | P-valuea |
|---|---|---|---|---|---|---|
| N | 647 | 660 | 604 | 610 | 601 | |
| Dialysis treatment characteristics | ||||||
| Dialysis vintage (months), mean (SD) | 6.9 (3.4) | 5.9 (3.4) | 6.1 (3.3) | 5.9 (3.5) | 6.1 (3.5) | 0.01 |
| Proportion of APD, % | 15 | 19 | 24 | 23 | 24 | <0.001 |
| Kt/V/week, mean (SD) (n = 1517) | 2.3 (0.6) | 2.4 (0.8) | 2.3 (0.6) | 2.4 (0.6) | 2.2 (0.6) | 0.08 |
| CCr/week, mean (SD) (n = 1476) | 82 (28.0) | 79 (27.8) | 83 (32.6) | 83 (32.8) | 81 (27.9) | 0.81 |
| Proportion icodextrin, % | 26 | 33 | 31 | 37 | 40 | <0.001 |
| Proportion APD + icodextrin, % | 7.4 | 8.2 | 9.3 | 11.0 | 12.6 | <0.001 |
| Assisted PD, % | 1.4 | 4.2 | 10.4 | 10.7 | 11.8 | <0.001 |
| Medications, % | ||||||
| ACEis/ARBs | 69 | 71 | 69 | 63 | 61 | <0.001 |
| Beta-blockers | 75 | 73 | 77 | 74 | 77 | 0.35 |
| Calcium channel blockers | 73 | 76 | 75 | 77 | 83 | 0.01 |
| Other antihypertensive drugs | 23 | 26 | 30 | 31 | 41 | <0.001 |
| Diuretics | 89 | 90 | 87 | 88 | 86 | 0.07 |
| Statins | 59 | 57 | 57 | 61 | 56 | 0.67 |
| Erythropoietin/darbepoetin | 86 | 88 | 82 | 80 | 83 | 0.001 |
| Iron (oral/intravenous) | 58 | 60 | 57 | 45 | 46 | <0.001 |
| Phosphate binders (non-calcium based) | 57 | 65 | 67 | 71 | 76 | <0.001 |
| Calcium supplementsb | 68 | 68 | 61 | 53 | 52 | <0.001 |
| Vitamin D3 supplements | 78 | 83 | 81 | 82 | 81 | 0.24 |
| Cinacalcet | 4 | 7 | 7 | 9 | 8 | 0.01 |
aP-values were tested with a Jonckheere–Terpstra trend test for categorical variables and with a linear-by-linear trend test for continuous data. Significant values are in bold.
bCalcium supplements include calcium-containing phosphate binders.
Changes in clinical outcomes
There was no substantial difference in 1- and 2-year unadjusted mortality or MACE incidence over the study period (Table 3 and Supplementary data, Table S3). The standardized incidence rates for death and MACEs did not show any clear trend either (Table 4). There was a gradually decreasing trend for 1- and 2-year peritonitis incidence and the rate of kidney transplantation increased substantially (Table 4). The proportion of patients who switched from PD to HD remained constant over the 10-year period (both crude and standardized; Tables 3 and 4). Similar associations were observed in intention-to-treat analyses (when patients were not censored at kidney transplant or switch to HD; Supplementary data, Tables S4 and S5).
1-year and 2-year outcomes among PD patients according to admission year
| Time period | 2006–2007 | 2008–2009 | 2010–2011 | 2012–2013 | 2014–2015 | P-valueb |
|---|---|---|---|---|---|---|
| N | 647 | 660 | 604 | 610 | 601 | |
| 1-year outcomes | ||||||
| Death | 8.8 | 8.6 | 8.6 | 9.3 | 7.0 | 0.41 |
| MACEa | 13 | 15 | 14 | 14 | 14 | 0.87 |
| Kidney transplantation | 6.8 | 8.8 | 8.6 | 10.8 | 10.3 | 0.01 |
| % increase from 2006–2007 | +29 | +26 | +59 | +51 | ||
| Peritonitis | 21 | 21 | 20 | 15 | 18 | 0.01 |
| % reduction from 2006–2007 | +0.1 | −3 | −30 | −14 | ||
| Transfer to HD | 13 | 17 | 13 | 10 | 13 | 0.30 |
| 2-year outcomes | ||||||
| Death | 16.7 | 18.6 | 18.7 | 18.0 | 15.8 | 0.64 |
| MACEa | 21 | 23 | 21 | 23 | 21 | 0.99 |
| Kidney transplantation | 16 | 16 | 15 | 20 | 21 | 0.01 |
| % increase from 2006–2007 | 0 | −6 | +25 | +31 | ||
| Peritonitis | 32 | 29 | 28 | 24 | 24 | <0.001 |
| % reduction from 2006–2007 | −10 | −14 | −25 | −24 | ||
| Transfer to HD | 26 | 28 | 24 | 21 | 25 | 0.19 |
Values are presented as percentages.
MACEs included cardiovascular death, hospitalization of re-infarction, stroke and heart failure.
bP-values were tested with a Jonckheere–Terpstra trend test for categorical variables and with a linear-by-linear trend test for continuous data.
Standardized incidence rate of 1-year and 2-year risk of death and peritonitis
| 1-year outcomes (%) | 2-year outcomes (%) | |||||
|---|---|---|---|---|---|---|
| Time period | Crude | + Age, sex | + Comorbiditya | Crude | + Age, sex | + Comorbiditya |
| Death | ||||||
| 2006–2007 | 8.8 | 9.1 | 8.1 | 16.7 | 17.2 | 15.3 |
| 2008–2009 | 8.6 | 8.5 | 7.5 | 18.6 | 17.9 | 15.7 |
| 2010–2011 | 8.6 | 7.8 | 7.1 | 18.7 | 17.2 | 16.7 |
| 2012–2013 | 9.3 | 9.2 | 8.0 | 18.0 | 18.0 | 14.8 |
| 2014–2015 | 7.0 | 7.4 | 7.2 | 15.8 | 16.3 | 14.5 |
| MACEsb | ||||||
| 2005–2006 | 12.8 | 13.0 | 11.4 | 20.6 | 20.8 | 17.7 |
| 2007–2008 | 14.8 | 14.9 | 14.0 | 23.0 | 22.9 | 21.3 |
| 2009–2010 | 13.6 | 13.1 | 12.2 | 21.0 | 20.4 | 19.2 |
| 2011–2012 | 13.6 | 13.1 | 12.4 | 22.8 | 22.3 | 20.3 |
| 2013–2014 | 13.8 | 14.4 | 13.0 | 20.6 | 21.5 | 19.2 |
| Kidney transplant | ||||||
| 2005–2006 | 6.8 | 6.5 | 5.9 | 15.9 | 15.3 | 14.7 |
| 2007–2008 | 8.8 | 8.7 | 8.3 | 16.1 | 15.5 | 14.6 |
| 2009–2010 | 8.6 | 9.0 | 7.8 | 15.1 | 15.6 | 13.8 |
| 2011–2012 | 10.8 | 11.2 | 10.0 | 19.7 | 20.4 | 18.6 |
| 2013–2014 | 10.3 | 9.9 | 9.5 | 20.6 | 20.5 | 18.6 |
| Peritonitis | ||||||
| 2005–2006 | 21.0 | 20.9 | 19.4 | 32.0 | 31.7 | 29.3 |
| 2007–2008 | 21.2 | 21.1 | 19.7 | 28.9 | 28.9 | 27.0 |
| 2009–2010 | 20.4 | 21.0 | 19.3 | 27.6 | 27.8 | 26.1 |
| 2011–2012 | 14.8 | 14.6 | 12.9 | 24.1 | 24.5 | 22.9 |
| 2013–2014 | 18.0 | 17.9 | 16.4 | 24.3 | 24.3 | 22.0 |
| Transfer to HD | ||||||
| 2006–2007 | 12.2 | 11.9 | 11.1 | 25.5 | 25.1 | 24.1 |
| 2008–2009 | 16.7 | 17.1 | 16.0 | 27.6 | 28.0 | 26.0 |
| 2010–2011 | 12.6 | 13.7 | 13.1 | 23.7 | 24.9 | 24.1 |
| 2012–2013 | 10.2 | 9.8 | 8.9 | 21.3 | 20.6 | 19.5 |
| 2014–2015 | 13.3 | 13.0 | 12.5 | 25.1 | 24.3 | 23.1 |
Standardized incidence rates of 1- and 2-year outcomes were performed with logistic regression models.
Comorbidity included hypertension, diabetes, cardiovascular disease, stroke, atrial fibrillation, chronic obstructive pulmonary disease, rheumatoid disease and cancer.b MACEs included cardiovascular death, hospitalization of re-infarction, stroke and heart failure.
The multivariable modelling of the association between moving a 2-year block forward and different outcomes showed that after adjusting for age, sex, comorbidity and treatment changes, both the 1- and 2-year risk of peritonitis decreased by 8% [HR 0.92 (95% CI 0.87–0.98) for 1year and HR 0.92 (95% CI 0.87–0.96) for 2 years], while there were no significant changes in the risk of all-cause mortality, MACEs or transfer rate to HD (Figure 2).
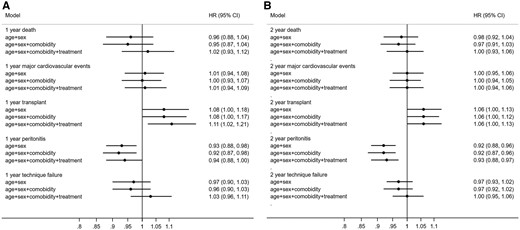
HRs for the association between temporal trends, based on moving a 2-year block forward and (A) 1-year and (B) 2-year outcomes among incident PD patients in Sweden, 2006–2015. Time period used as a continuous variable. *Comorbidity included hypertension, diabetes, cardiovascular disease, stroke, atrial fibrillation, chronic obstructive pulmonary disease, rheumatoid disease and cancer. Treatment included ACEis/ARBs, beta-blockers, calcium channel blockers, other antihypertensives, diuretics, statins, phosphate binders, erythropoietin, iron, calcium supplements, vitamin D3, cinacalcet, dialysis duration, use of icodextrin and proportion of APD and assisted PD.
Changes in mortality compared with the general population
The 1- and 2-year mortality of PD patients were also compared with an age-, sex- and calendar-year-matched Swedish background population. Compared with the general population, the 1-year mortality risk among PD patients was 4.1 times higher in 2006–2007 [SIRR 4.08 (95% CI 3.2–5.3)] and remained fairly stable over the 10-year follow-up period (Supplementary data, Table S6). A similar trend was observed for 2-year mortality.
DISCUSSION
This nationwide study of incident PD patients in Sweden from 2006 to 2015 found a continuous implementation of newer PD practices and guideline-recommended treatments that was paralleled by a substantial decline in peritonitis frequency and an increase in kidney transplantation. Transfer from PD to HD, 1-year and 2-year survival and MACE risk did not change over the 10-year period.
Studies from around the globe have demonstrated higher survival rates for PD patients in the beginning of the 2000s when compared with the 1990s [6]. In Europe, survival improved for patients starting dialysis in 2003–2007 compared with those starting in 1993–1997, both for PD [adjusted HR 0.64 (95% CI 0.61–0.67)] and somewhat less for HD patients [adjusted HR 0.82 (95% CI 0.80–0.84)] with parallel improvements of dialysis technique survival for both modalities [14]. In another study, from Denmark, the survival of incident PD patients improved by 42% from 1990–1999 to 2000–2010 [18]. Our results suggest that the rate of improvement has slowed during more recent years among PD patients in Sweden. This contrasts with results from the USA, where the adjusted mortality rate among PD patients decreased by 37% from 2001 to 2010 and continued to improve by 7% from 2011 to 2017 [1].
In Sweden, there is a relatively high proportion of patients on PD (34% incidence and 21% prevalence in 2019) compared with other countries in Europe and the USA [19]. One may speculate that improvements in PD treatment practices introduced in Sweden during the 1990s and early 2000s may have contributed to lower mortality rates of PD patients before 2006 and that this reduced the potential for further improvements. In contrast, among incident HD patients in Sweden, positive survival trends during the same decade as in the current study have been recently reported [20]. However, the unadjusted mortality rates were still almost twice as high as those of the PD population. Mirroring these findings, the SIRR for 1-year risk of death among HD patients declined from 6 times higher in 2006–2007 to 5.6 times higher in 2014–2015 when compared with the general population, corresponding to a SIRR reduction of 8% [20]. In contrast, the SIRR for 1-year risk of death in the PD patients in our study remained about 4 times higher than the general population throughout the period. One possible explanation for the different trends in Swedish PD and HD patients could be that characteristics and selection criteria for patients starting on PD remained constant, favouring its use for more healthy patients, while the HD patients had a higher comorbidity burden. Contrasting with this assumption is our finding of a substantial increase in the proportion of patients on assisted PD over the period, an indicator of an expansion towards a more frail population. However, for both modalities, mean age (~63 years in PD versus 65 years in HD) and sex distribution (33% women in both modalities) remained similar throughout the period [20].
There are few nationwide comprehensive studies describing the pattern of changes of PD treatment practices and medications in PD patients over time. In the present study, alterations of guideline-recommended clinical practices were gradually implemented during the recent decade and were accompanied by changes in trends of laboratory values and treatments, both for dialysis and medications. The increased use of calcium channel blockers and other antihypertensive drugs accompanied by reduced use of ACEsi/ARBs was associated with a small but statistically significant increase in mean diastolic BP that might reduce the risk of hypotension as a cause for residual renal function decline [21]. The mean systolic BP was almost 10 mmHg lower than among the HD patients in Sweden in the same period [20]. We also observed increasing use of calcium-free phosphate binders and cinacalcet, in line with recommendations for management of CKD-MBD [22], and lower doses of erythropoietin and subsequently lower mean haemoglobin, indicating better adherence to newer targets for anaemia treatment [23].
At the beginning of our study in 2006, all incident PD patients in Sweden used biocompatible glucose-based fluids and the use of APD and icodextrin-based solutions was also quite common. During the 10-year period, the proportion of incident PD patients using APD increased by 60% (from 15% in 2006–2007 to 24% in 2014–2015), the percentage of patients using icodextrin-based dialysis fluid increased by 54% (from 26% to 40%) and the combination of the two increased by 70% (from 7.4% to 12.6%). Although it should be noted that no studies have demonstrated a clear survival benefit associated with the use of biocompatible versus traditional glucose-based fluids [7], icodextrin-based versus glucose-based dialysis fluids [8] and individualized prescriptions using APD versus continuous ambulatory PD [9, 10], these newer therapeutic options have been ascribed various advantages, including better control of BP and fluid status [21].
Another important finding in our study was the continuous reduction of time to a first peritonitis episode over the study period. This is consistent with single-centre studies from Korea and Brazil [24, 25] and with national data from Australia and New Zeeland [26] showing decreasing peritonitis rates. We did not find any substantial change over time in characteristics that were previously linked to a higher risk of peritonitis, such as older age, female sex or comorbidity [27]. However, some earlier reports have suggested that APD use is associated with lower peritonitis rates [28], although results have been conflicting [29].
The proportion of incident PD patients relative to incident HD patients continues to decline in Sweden and Europe [14] and, in the present study, the number of incident PD patients decreased by ~7% during the 10-year period. This is in contrast with marked increases in PD utilization in the USA [1] and some Asian countries, including China and Thailand [19]. It is possible that PD utilization in Sweden to some extent reflects its use as the preferred initial treatment option for the younger and less unhealthy segment of end-stage kidney disease patients, who are also eligible for kidney transplantation. In our study, >20% of the incident PD patients underwent kidney transplantation within 2 years and the proportion of PD patients undergoing kidney transplantation within 1 year increased by >50% from 2006 to 2015. While PD and kidney transplantation, especially pre-emptive kidney transplantation, to some extent compete, they are complementary options and countries with a high incidence of kidney transplantation also tend to have higher use of PD.
Some strengths and limitations should be considered when interpreting the results of the present study. A main strength is our inclusion of all incident PD patients from a country with universal healthcare, no loss to follow-up and access to extensive information regarding dialysis treatment characteristics, comorbid conditions and drug dispensations adjudicated from linkages with national healthcare registries. This allowed us to study changes in practice patterns over a 10-year period, during which patients could benefit from the implementation of dialysis treatment advances and guideline-recommended targets for medications in a stable nationwide inception cohort. We also acknowledge some limitations. The observational design precludes conclusions regarding causal relationships; that is, we cannot conclude that treatment advances, including the increased implementation of APD over the last decade, are the cause of the observed reduction of incidence of peritonitis. Also, the use of diagnostic codes does not consider the severity of underlying disorders and the identification and reporting of comorbidities may have changed over time. In addition, the follow-up time may be too short to fully capture—and may therefore underestimate—the incidence of some outcomes (i. e., transfers from PD to HD) developing over time. Furthermore, we do not have information on ethnicity, as this is not allowed by Swedish law. Finally, these results apply to the conditions in Swedish practice from 2006 to 2015 and extrapolation to other countries or periods should be performed with caution.
In summary, this study shows that the implementation of therapeutic advances among PD patients over the last decade was accompanied by declining peritonitis frequency and an increased incidence of kidney transplantation. There was no change of transfers from PD to HD and 1-year and 2-year survival or MACE risk did not improve.
DATA AVAILABILITY STATEMENT
The data underlying this article cannot be shared publicly due to the privacy of individuals that participated in the study. The data will be shared on reasonable request to the corresponding author.
SUPPLEMENTARY DATA
Supplementary data are available at ckj online.
ACKNOWLEDGEMENTS
The authors would like to thank the nephrology clinics in Sweden for their continuous work with the Swedish Renal Registry and the administrative office for their hard work.
FUNDING
This study was supported by the Swedish Research Council (2019-01059), the Heart and Lung Foundation and the Stig och Gunborg Westman Foundation. H.X. is supported by a postdoctoral position funded by StratNeuro (the Strategic Research Area Neuroscience–Karolinska Institutet, Umeå University and KTH). M.E. is supported by a grant for the Strategic Research Area and CIMED, Karolinska University Hospital and Stockholm City Council (ALF). Baxter Novum is the result of a grant from Baxter Healthcare to Karolinska Institutet. The funders of this study had no role in the study design, data collection, data analysis or interpretation, writing of the report or the decision to submit the report for publication.
AUTHORS’ CONTRIBUTIONS
All authors contributed to the conception, interpretation of the data, revising the manuscript, providing intellectual content of critical importance to the work described and approval of the final manuscript. M.E., H.X. and J.J.C. were responsible for the study design. H.X. was responsible for statistical analysis. M.E. and H.X. drafted the manuscript.
CONFLICT OF INTEREST STATEMENT
B.L. is employed by Baxter Healthcare. M.E. reports payment from Region Jönköping, during the conduct of the study; personal fees from Astra Zeneca, personal fees from Astellas, personal fees from Vifor Pharma, personal fees from Fresenius medical Care, all outside the submitted work; None of the other authors declares relevant financial interests that would represent a conflict of interest.


Comments