


Abstract
The increased survival of patients with multiple myeloma (MM) raises the question of kidney transplantation (KT) in patients with end-stage renal disease (ESRD).
We included 13 patients with MM or smoldering myeloma (SMM) and ESRD transplanted between 2007 and 2015, including 7 MM with cast nephropathy, 3 with MM-associated amyloid light chain amyloidosis or light chain deposition disease and 3 SMM and compared them with 65 control-matched kidney-transplanted patients. Nine of the MM patients with KT were also compared with 63 matched MM patients on haemodialysis.
Pre-transplantation parameters were comparable, except for the duration of renal replacement therapy (57.8 versus 37.0 months; P = 0.029) in MM versus control patients, respectively. The median follow-up post-KT was 44.4 versus 36.4 months (P = 0.40). The median MM graft and patient survival were 80.1 and 117.2 months, respectively, and were not significantly different from control patients, although mortality tended to be higher in the 10 symptomatic MM patients (P = 0.059). MM patients had significantly more viral and fungal infections and immunosuppressive maintenance therapy modifications while they received lower induction therapy. Two MM patients relapsed and two SMM cases evolved to MM after KT. Three cast nephropathies occurred, two of them leading to ESRD. Moreover, survival of MM with KT increased relative to control haemodialysed patients (P = 0.002).
Selected MM patients may benefit from KT but need careful surveillance in the case of KT complications and MM evolution.
INTRODUCTION
Multiple myeloma (MM) accounts for almost 10% of haematological malignancies (HMs). In France, MM has become the most prevalent HM in adults, and the incidence has increased over the last few decades (data from the French Institute for Public Health Surveillance [1]). Kidney failure occurs in 20–30% of MM patients at diagnosis [2, 3] and up to 50% during follow-up. Cast nephropathy or MM-associated disease [4], such as light chain deposition disease (LCDD) or amyloid light chain (AL) amyloidosis, can lead to end-stage renal disease (ESRD). Prognosis is worse in MM patients with initial kidney failure than for other MM patients [5, 6]. While it improves after reversal of renal injury [7, 8], it remains inferior to that for patients with normal renal function at diagnosis [8]. Haematological response to the treatment is mandatory to recover renal function but is sometimes insufficient. Although the prognosis of renal function has improved since the new era of MM treatment [7–9], more than half of severely kidney-injured patients initially requiring haemodialysis still need dialysis 2 years after diagnosis [9].
Because of the malignancy and the poor prognosis of MM, kidney transplantation (KT) for MM has not been considered an option [10]. However, more recent treatments have improved the response and survival rates of patients with MM and kidney failure [11] and it has been proposed that some patients may benefit from KT [12].
However, this new emerging strategy raises questions about renal relapse of MM with graft involvement and survival of such patients. The median survival of MM patients with ESRD was 18.3 months between 2002 and 2011 [13], which was very much worse than the median survival of kidney grafts in the general population [61% survival rate at 10 years after KT from a deceased donor for the period 1993–2012 (French Biomedical Agency data)] [14]. Even if MM patients with good prognosis factors are selected, some of them may die because of refractory myeloma before the physiological loss of their kidney graft.
Prognosis may also be impacted by bacterial and viral infections, both of which are promoted by immunosuppressive therapy and MM itself. Indeed, MM patients already have a 7-fold increased risk of bacterial infection and a 10-fold increased risk of viral infection [15]. Moreover, MM and novel regimen treatments such as lenalidomide plus melphalan may increase the risk of a second malignant neoplasm [16–18], such as skin cancer [17] or other forms of HM [18], especially when used in conjunction with classical IS treatments for KT. MM and plasmacytoma arising after KT are rare but associated with a poor prognosis, with a median survival of 49 months, especially because of the bacterial infection risk during treatment for the haematological disease [19].
During the 1980s and 1990s, cases of MM patients who had renal transplantation were reported but remained anecdotal [20–23]. In the 2000s, five cases of primary allograft dysfunction secondary to myeloma cast nephropathy were reported [24–28] in which MM was undiagnosed during the haemodialysis period and revealed only by the primary allograft dysfunction. During the period 1986–2005, 35 patients in a European registry of ESRD patients received a KT at a mean age of 52.8 years [29]. The median survival of these patients was 9.6 years from the first day of renal replacement therapy.
One successful strategy for patients with MM and ESRD has been the combined transplantation of human leucocyte antigen (HLA)-matched kidney and bone marrow, allowing specific tolerance and a potent antimyeloma response [30]. However, this technique still remains highly specialized and has not been generalized in routine practice.
More recently, four cases of MM patients who underwent KT between 2009 and 2015 were reported [31], with follow-up ranging from 16 to 58 months after KT, with no adverse effect, no graft rejection and survival of both graft and patient in all cases, suggesting that this strategy could be proposed to patients who achieved a very good partial response (VGPR) or complete response (CR) with chemotherapy and autologous stem cell transplantation (ASCT). Two other cases were subsequently reported with stable renal allograft function at 13 and 25 months after KT, under continuous bortezomib treatment [32].
In this study we retrospectively included 13 patients in France with smoldering myeloma (SMM) or MM and ESRD who had KT between 2007 to 2015 and compared them with 65 standard-matched kidney-transplanted controls. Nine of them were also compared with 63 matched MM patients treated by haemodialysis without transplantation.
MATERIALS AND METHODS
Patients and controls
The retrospective, case–control study was conducted in seven French renal transplantation centres. All 33 such centres were asked if they had performed KT in patients with a history of MM or SMM between 2005 and 2015, with 7 centres responding favourably. Thirteen patients were included after identification through the computerized records. The inclusion criterion was MM or SMM defined as plasmacytosis >10% before KT. The aetiology of ESRD was not necessarily linked to the haematological disease, and SMM or symptomatic MM before KT was included. The diagnosis of SMM, MM and MM-associated disease and related organ or tissue impairment (ROTI) was based on the criteria of the International Myeloma Working Group [33] and the International Kidney and Monoclonal Gammopathy group, respectively. Responses to treatments were classified according to International Myeloma Working Group criteria [34].
Sixty-five controls (five per patient) were selected from the French Données Informatisées et VAlidées en Transplantation (DIVAT) multicentre prospective cohort of kidney and/or pancreatic transplant recipients. The 65 control patients were matched with their related cases by sex, year of birth (±6 years), year and range of KT (= 1) and by the type of kidney donor (deceased or living) (Figure 1). Patient and control medical records were accessed and data were analysed anonymously.

Flow chart.
Demographic, clinical and laboratory data were assessed for each patient before KT (sex, previous history of non-haematological or haematological neoplasia, age at ESRD, native kidney disease and dialysis duration), at the time of renal transplantation [age at KT, age of the donor, living donor, dual transplantation, HLA mismatch, Epstein–Barr virus (EBV) and cytomegalovirus (CMV) donor and recipient serology, type of induction therapy and initial maintenance immunosuppression (IS)] and after KT [serum creatinine evolution, graft biopsy and results, graft rejection, delayed graft function (DGF), infections, adaptation of IS treatments, post-transplant cancer, graft loss and patient death]. DGF was defined as the need for haemodialysis during the first week of KT. The estimated glomerular filtration rate (eGFR) was calculated using the Modification of Diet in Renal Disease formula [35]. Data on MM before and after KT were precisely recorded (year of diagnosis, medullary plasmacytosis at diagnosis, paraprotein at MM diagnosis, M spike level at diagnosis and during follow-up, progression of SMM to MM, type of ROTI, MM-associated disease such as LCDD or AL amyloidosis, treatments and responses and recurrences).
Sixty-three MM controls (seven per patient) on haemodialysis without transplantation were selected from the Renal Epidemiology and Information Network (REIN). No match could be found for four patients (Patients 4, 9, 10 and 12 from Table 1). MM with cast nephropathy on haemodialysis were selected during the period 2007–15 and matched with their related cases by sex, year of birth (±6 years) and year of MM diagnosis (±3 years). Dialysis duration and patient survival were recorded and analysed anonymously.
Initial characteristics of MM and SMM patients
| Patient | Sex | Initial diagnosis of HM | Age at diagnosis of HM (years) | Age at ESRD (years) | Time of diagnosis of HM | Time of kidney graft | Paraprotein | Medullary plasmacytosis at diagnosis (%) | Related organ or tissue impairment | Aeiology of renal disease | Relapses before KT, n | Time to relapse (months) | First treatment and response | Second treatment and response | Third treatment and response | Delay between HM diagnosis and KT (months) | Delay between the beginning of the last HM treatment and KT (months) |
|---|---|---|---|---|---|---|---|---|---|---|---|---|---|---|---|---|---|
| 1 | M | SMM | 63.0 | 67.0 | 2001 | 2010 | IgG lambda | 14 | 0 | Nephroangiosclerosis | 0 | x | x | x | x | 118 | x |
| 2 | F | SMM | 67.9 | 68.5 | 2012 | 2013 | IgG kappa | 20 | 0 | Autosomal dominant polycystic kidney disease | 0 | x | x | x | x | 21.1 | x |
| 3 | M | SMM | 65.9 | 69.9 | 2010 | 2015 | IgG kappa | 20 | 0 | Nephroangiosclerosis | 0 | x | x | x | x | 69.4 | x |
| 4 | M | MM | 51.1 | 51.1 | 1994 | 2007 | IgG kappa | 12 | Bone, renal and skin AL amyloidosis | AL amyloidosis | 1 | 36 | MP, VGPR | MP + local radiotherapy (sternal plasmacytoma), VGPR | x | 159.6 | 124.0 |
| 5 | M | MM | 45.6 | 49.6 | 1999 | 2008 | IgA kappa | 20 | Renal insufficiency | Cast nephropathy | 0 | x | VAD then ASCT, CR | x | x | 118.4 | 118.4 |
| 6 | M | MM | 50.6 | 59.0 | 2001 | 2009 | Lambda | 20 | Renal insufficiency | Cast nephropathy | 0 | x | VAMD then ASCT, VGPR | x | x | 100.6 | 100.6 |
| 7 | M | MM | 54.2 | 58.1 | 2001 | 2009 | Lambda | 35 | Renal insufficiency, anemia | Cast nephropathy | 1 | 40 | VAMD then ASCT, CR | TD, CR | x | 98.4 | 54.0 |
| 8 | F | MM | 48.2 | 52.2 | 2002 | 2009 | Kappa | 11 | Renal insufficiency, anemia | LCDD | 1 | 52 | VAMD then ASCT, CR | BTD, SD | BRD, CR | 90.6 | 5.0 |
| 9 | F | MM | 47.1 | 47.1 | 1997 | 2009 | Kappa | 28 | Renal insufficiency | Cast nephropathy | 0 | x | VAD then ASCT, CR | x | x | 148.9 | 148.9 |
| 10 | M | MM | 40.0 | 40.0 | 2006 | 2011 | Kappa | 50 | Renal insufficiency, bone | Cast nephropathy | 0 | x | VAD then ASCT, CR | x | x | 70.1 | 70.1 |
| 11 | M | MM | 63.8 | 63.8 | 2007 | 2012 | IgA kappa | 20 | Renal insufficiency, anaemia | Cast nephropathy | 0 | x | BD then ASCT, CR | x | x | 57.7 | 57.7 |
| 12 | F | MM | 43.7 | 43.7 | 2003 | 2015 | Kappa | 30 | Renal insufficiency | Cast nephropathy | 1 | 23 | VAD DCEP then ASCT, consolidation BTD, VGPR | BTD, SD | RD, VGPR | 146.4 | 101.3 |
| 13 | M | MM | 57.7 | 58.2 | 2012 | 2015 | IgG kappa | 10 | Renal insufficiency and liver amyloïdosis | AL amyloidosis | 0 | x | BCD, CR | x | x | 39.7 | 39.7 |
BCD, bortezomib cyclophosphamide dexamethasone; BRD, bortezomib revlimib dexamethasone; BTD, bortezomib thalidomide dexamethasone; MP, melphalan prednisone; RD, revlimib dexamethasone; SD, stable disease; TD, thalidomide dexamethasone; VAD, vincristine doxorubicin dexamethasone; VAD DCEP, vincristine adriamycine dexamethasone, cyclophosphamide etoposide cisplatin; VAMD, vincristine doxorubicin melphalan dexamethasone.
Statistical analysis
Quantitative data are presented as median (range). Qualitative variables were compared using the Fisher’s exact test. Quantitative variables were compared using the Mann–Whitney U-test. Analysis of eGFR for the period after KT was by multiple t-test without correction.
Survival (graft, patient and time from ESRD to transplantation) was compared using Kaplan–Meier curves and the log-rank (Mantel–Cox) test. Analysis of graft survival was death censored.
All comparisons are two-sided and a P-value <0.05 is considered significant.
Analyses were performed using GraphPad Prism software (GraphPad Software, San Diego, CA, USA).
RESULTS
Characteristics of MM patients before KT
Thirteen patients (nine men and four women; odds ratio 2.25) with a history of SMM or MM were transplanted in France between 2007 and 2015, including seven MM with cast nephropathy, three with monoclonal gammopathy of renal significance and three SMM. MM and SMM were diagnosed before KT, between 1994 and 2012, and the median age at diagnosis was 51.1 years (range 40.0–67.9).
The 10 patients with MM had ESRD, including 7 cast nephropathies, 2 AL amyloidoses and 1 LCDD. All of them achieved a rating of VGPR or CR after the first treatment. Eight of these patients received a high-dose therapy (melphalan) followed by ASCT. Six patients had no relapse until KT. The four other patients had one relapse: two patients with initial cast nephropathy, one patient with initial AL amyloidosis and one patient with initial LCDD. Second-line treatment achieved CR in two of these patients but only stable disease in the remaining two, who nonetheless achieved VGPR and CR after third-line therapy.
The three patients with SMM had nephroangiosclerosis-related ESRD in two cases and autosomal dominant polycystic kidney disease in one case. None of them received treatment before KT.
Data on the initial characteristics of HM patients are summarized in Table 1.
Characteristic of HM patients and control patients at the time of KT
For the 13 patients, the median age at ESRD was 58.1 (range 40.1–69.9) years, the median duration of renal replacement therapy was 57.8 months (range 0–159.9) and the median age at KT was 60.1 years (range 45.8–72.8).
The 65 control patients were comparable to patients except for the type of aetiology of kidney disease [related to MM in 10/13 (77%) patients, P < 0.001] and duration of renal replacement therapy [57.8 months (range 0–159.9) versus 37.0 months (range 0–151.8) for MM and control patients, respectively; P = 0.029]. Initial induction protocol by basiliximab was more frequent in MM patients. Data regarding the initial characteristics at the time of KT are summarized in Table 2.
Initial characteristics at the time of KT
| Characteristics | Patients with HM (n = 13) | Controls (n = 65) | P-value |
|---|---|---|---|
| Age at ESRD (years), median (range) | 58.1 (40.1–69.9) | 56.81 (40.16–69.85) | 0.69 |
| Age at KT (years), median (range) | 61.0 (45.8–72.8) | 60.0 (44.0–74.0) | 0.5 |
| Body mass index (kg/m2), median (range) | 26.2 (21.2–28.4) | 25.90 (19.3–36.4) | 0.4 |
| Sex ratio (male/female) | 2.25 | 2.25 | |
| History, n/N (%) | |||
| Hypertension | 9/13 (69) | 59/65 (91) | 0.056 |
| Dyslipidaemia | 7/13 (54) | 38/65 (58) | >0.99 |
| Diabetes | 4/13 (31) | 13/65 (20) | 0.46 |
| Ischaemic cardiopathy | 1/13 (8) | 21/65 (32) | 0.1 |
| Stroke | 0/13 (0) | 7/65 (11) | 0.35 |
| Aetiology of renal disease, n/N (%) | <0.0001 | ||
| Autosomal dominant polycystic kidney disease | 1/13 (8) | 18/65 (28) | |
| Chronic glomerulonephritis | 0/13 (0) | 10/65 (15) | |
| Other rare aetiology of renal disease | 0/13 (0) | 10/65 (15) | |
| Nephroangiosclerosis | 2/13 (15) | 7/65 (11) | |
| Unknown | 0/13 (0) | 7/65 (11) | |
| Diabetes | 0/13 (0) | 7/65 (11) | |
| Tubulointerstitial nephritis and/or pyelonephritis | 0/13 (0) | 4/65 (6) | |
| Renal trauma | 0/13 (0) | 2/65 (3) | |
| Cast nephropathy | 7/13 (54) | 0/65 (0) | |
| AL amyloïdosis | 2/13 (15) | 0/65 (0) | |
| LCDD | 1/13 (8) | 0/65 (0) | |
| Type of renal replacement therapy, n/N (%) | 1 | ||
| Haemodialysis (with or without previous peritoneal dialysis) | 12/13 (92) | 53/65 (82) | |
| Peritoneal dialysis (exclusively) | 0/13 (0) | 3/65 (4) | |
| Pre-emptive graft | 1/13 (8) | 9/65 (14) | |
| Duration of renal replacement therapy (months), median (range) | 57.8 (0–159.9) | 37.0 (0–151.8) | 0.029 |
| Kidney graft | |||
| Living donor, n/N (%) | 2/13 (15) | 10/65 (15%) | >0.99 |
| Age of donor (years), median (range) | 59.0 (43.0–83.0) | 61.0 (23.0–84.0) | 0.76 |
| Induction protocol , n/N (%) | 0.01 | ||
| Antithymocyte globulin | 3/13 (23) | 40/65 (62) | |
| Basiliximab | 10/13 (77) | 22/65 (34) | |
| No induction protocol | 0/13 (0) | 3/65 (4) | |
| Initial immunosuppresive therapy, n/N (%) | 0.52 | ||
| Tacrolimus, mycophenolate mofetil, prednisone | 6/13 (46) | 38/65 (58) | |
| Tacrolimus, mycophenolate mofetil | 1/13 (8) | 1/65 (2) | |
| Tacrolimus, sirolimus, prednisone | 0/13 (0) | 1/65 (2) | |
| Ciclosporin, mycophenolate mofetil, prednisone | 6/13 (46) | 25/65 (38) | |
| Intravenous immunoglobulin | 0/13 (0) | 5/65 (8) | 0.3 |
| HLA mismatch, median (range) | 3.0 (0–5) | 4.00 (1–6) | 0.1 |
| Cold ischaemia time (h), median (range) | 12.2 (1.6–19.8) | 14.3 (1.0–36.0) | 0.16 |
| Known DSA before kidney graft, n/N (%) | 0/13 (0) | 4/65 (6) | 0.36 |
Graft and patient survival
Regarding patients, median graft survival was 80.1 months and median patient survival after KT was 117.2 months. Death-censored graft and patient survival were not statistically different regarding MM and SMM versus control patients (P = 0.85 and P = 0.15, respectively) (Figure 2A and B). One- and 5-year patient survival was 100% and 65%, respectively. One- and 5-year death-censored graft survival was 92% and 79%, respectively.
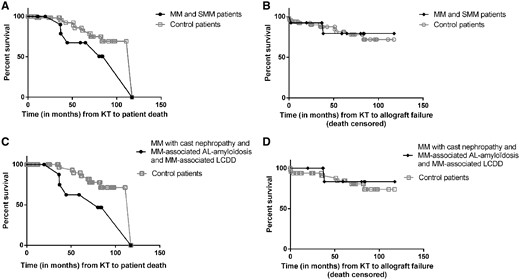
Survival of MM/SMM patients and control patients. (A) Patient survival after KT. Regarding MM/SMM patients, median patient survival after KT was 117.2 months. MM/SMM patients’ and control patients’ survival after KT were not statistically different from control patients (P = 0.15). (B) Death-censored graft survival after KT. Regarding MM/SMM patients, median graft survival after KT was 80.1 months. There was no significant difference with control patients (P = 0.85). (C) We excluded the three SMM patients from the analysis and their 15 related control patients. There was a tendency for decreased survival in MM patients versus control patients (P = 0.059). (D) We excluded the three SMM patients from the analysis and their 15 related control patients. Similar death-censored graft survival was observed in MM patients versus control patients (P = 0.65).
After exclusion of the 3 SMM patients, mortality tended to be higher in the 10 MM patients compared with controls (n = 10 versus 50, respectively) (P = 0.059), but there was no difference regarding the death-censored graft survival (P = 0.65) (Figure 2C and D).
The median survival from the diagnosis of MM or SMM was 229.0 months.
Outcome after KT
The median follow-up after KT was 44.4 months (range 11.1–117.2) and 36.4 months (range 0.1–117.3) for the 13 patients and control patients, respectively (P = 0.40).
DGF occurred in 8/13 (62%) patients versus only 16/65 (25%) control patients (P = 0.008). Renal function for the first year after KT, graft rejection, bacterial infection rates and occurrence of post-transplant cancer were not different between SMM/MM and control patients.
MM and SMM patients had an increased viral infection rate [0.53 (range 0–1.9) versus 0.14 (0.0–1.9) infections/year of follow-up; P = 0.003] and fungal infection rate [0.06 (range 0–0.031) versus 0.02 (0–1.20) infections/year of follow-up; P = 0.02].
Regarding viral infections in MM and SMM patients, extended replication of BK virus in the urine over a period of years was detected in five patients. Three of these also had transient blood replication, but no diagnosis of BK virus–associated nephropathy. Positive EBV quantitative polymerase chain reaction was detected in five patients without EBV-related cell proliferation. CMV primo-infections were diagnosed in two patients and CMV reactivation in two other patients and treated. Other viral infections included two influenza viruses, one herpetic infection, one norovirus infection and one varicella zoster virus reactivation.
Three patients had severe fungal infections. One SMM patient had severe pulmonary aspergillosis while evolving to MM after KT and was successfully treated. One MM patient had candidemia (Candida parapsilosis) in a period of relapse during bortezomib dexamethasone (BD) treatment. One other MM patient had Pneumocystis pneumonia and microsporidum infection during follow-up. One control patient developed Pneumocystis pneumonia during follow-up and another developed pulmonary aspergillosis.
Of note, four MM patients presented with T-cell-mediated rejection (TCMR) during the first year after KT, graded as follows: one borderline, two IA and one IB. All were successfully treated with an intravenous bolus of corticosteroids.
The number of patients with IS treatment modifications during the follow-up, which were mostly a reduction of the IS therapy, was higher in the MM group.
The number of graft losses was similar between groups, but two graft losses were due to cast nephropathy in HM patients.
As mentioned above, the number of deaths was not significantly different between groups [5/13 (38%) and 10/65 (15%); P = 0.11]. No death was directly linked to MM progression. However, one death occurred due to septic shock during BD treatment for relapse of MM and three deaths occurred in MM patients with secondary post-transplant cancer, two of them because of refractory metastatic lesions and one due to septic shock.
Data regarding outcomes after KT for MM patients and control patients are summarized in Table 3.
Outcomes after KT
| Outcomes | Patient with HM (n = 13) | Control (n = 65) | P-value |
|---|---|---|---|
| Primary allograft dysfunction, n/N (%) | 0/13 (0) | 4/65 (6) | 0.36 |
| DGF (prescription of haemodialysis the first week after KT), n/N (%) | 8/13 (62) | 16/65 (25) | 0.008 |
| During the follow-up | |||
| eGFR (MDRD) the first-year after KT (median) (mL/min/1.73 m2) | 54.2 (8.6–67.6) | 44.6 (18.5–77.4) | 0.38 |
| Graft rejects, n/N (%) | |||
| Borderline changes | 1/13 (8) | 7/65 (11) | 1 |
| Active TCMR | 3/13 (23) | 8/65 (12) | 0, 38 |
| Active ABMR | 0/13 (0) | 5/65 (7) | |
| Infections | |||
| Total number of bacterial infections, n | 20 | 46 | |
| Total number of viral infections, n | 25 | 20 | |
| Total number of fungal infections, n | 4 | 2 | |
| Bacterial infection rate, mean (range) | 1.15 (0–11.2) | 1.20 (0–52) | 0, 41 |
| Viral infection rate, mean (range) | 0.53 (0–1.9) | 0.14 (0–1.9) | 0.003 |
| Fungal infection rate, mean (range) | 0.06 (0–0.31) | 0.02 (0–1.20) | 0.02 |
| Adaptation of IS treatments | |||
| Patients with IS modifications during the follow-up, n/N (%) | 8/13 (62) | 12/65 (18) | 0.003 |
| Modifications, n | |||
| Switch calcineurin inhibitor for sirolimus or everolimus | 4 | 5 | |
| Mycophenolate mofetil stop | 3 | 4 | |
| Calcineurin inhibitor stop | 1 | 0 | |
| Switch ciclosporin to tacrolimus after acute cellular reject | 1 | 0 | |
| Switch mycophenolate mofetil to everolimus | 0 | 1 | |
| Switch tacrolimus to ciclosporin | 0 | 1 | |
| Switch mycophenolate mofetil to azathioprine | 0 | 4 | |
| Post-transplant neoplasia, n/N (%) | |||
| Secondary neoplasia after KT | 4/13 (31) | 7/65 (11) | 0.07 |
| Neoplasia leading to death | 2/13 (15) | 2/65 (3) | 0.13 |
| Type of secondary neoplasia, n | |||
| Basal cell carcinoma | 1 | 2 | |
| Epidermoid carcinoma | |||
| Multifocal | 1 | 0 | |
| Skin | 1 | 0 | |
| Oesophagus | 1 | 0 | |
| Unspecified | 0 | 5 | |
| Graft loss, n/N (%) | 6/13 (46) | 17/65 (26) | 0.18 |
| Aetiology of graft loss, n | |||
| Death of the patient | 4 | 10 | |
| Primary allograft dysfunction or acute problem during the first 3 months | 0 | 4 | |
| Chronic allograft dysfunction | 0 | 1 | |
| BK virus nephropathy | 0 | 1 | |
| Acute cellular rejection | 0 | 1 | |
| Cast nephropathy | 2 | 0 | |
| Deaths, n/N (%) | 5/13 (38) | 10/65 (15) | 0.11 |
| Aetiology of death, n | |||
| Severe infection | 2 | 3 | |
| Secondary neoplasia | 2 | 2 | |
| Sudden death by cardiac arrest | 1 | 1 | |
| Undetermined | 0 | 2 | |
| Perioperative complication | 0 | 1 | |
| Stroke | 0 | 1 |
ABMR, antibody-mediated rejection; MDRD, Modification of Diet in Renal Disease.
The mean eGFR over the post-KT period was not different between groups (Figure 3).

Evolution of eGFR (Modification of Diet in Renal Disease equation; mL/min/1.73 m2) after KT. Mean eGFRs (± standard deviation) at each year after KT were not different between the MM and SMM patients and control patients (multiple t-test).
Specific outcome of HM patients after KT
Regarding the 10 MM patients, only 2 patients with initial cast nephropathy relapsed after KT, at 38.3 and 19.6 months. The first patient developed cast nephropathy in the graft, leading to ESRD, with no recovery of graft function despite BD treatment and only a partial response (PR). He died 6 months later from septic shock at the end of this treatment. In the second patient, the relapse was diagnosed by the rapid rise of serum-free kappa light chain, before any ROTI appeared, and treatment by BD was begun at the end of our follow-up.
Of the three SMM patients, two evolved towards MM, with cast nephropathy lesions in the graft 2 and 4 months after KT. These two patients were treated with BD. The first achieved only PR and required immediate haemodialysis. He is still alive and on haemodialysis 11 months later. The second patient achieved CR and still has a functioning graft 64.8 months after KT.
Data regarding specific HM outcomes after KT are summarized in Table 4.
Specific outcomes of HM
| Patient | Initial diagnosis of the HM | Outcome of HM after KT | Type of related organ or tissue impairment | Time from KT to new ROTI (months) | Treatment after KT | Transplant status at the end of the follow-up | Dialysis post-transplant | Duration of KT (months) | Outcome | Follow-up from KT (months) |
|---|---|---|---|---|---|---|---|---|---|---|
| 1 | SMM | Evolution to MM | Renal insufficiency by cast nephropathy | 4 | BD. CR | Functional graft | No | 64.8 | Alive | 64.8 |
| 2 | SMM | x | x | x | x | Functional graft | No | 36.6 | Alive | 36.6 |
| 3 | SMM | Evolution to MM | Renal insufficiency by cast nephropathy | 2 | BD. SD | Failed allograft to cast nephropathy | Yes | 2.1 | Alive | 11.1 |
| 4 | MM | x | x | x | x | Dead with a functional graft | No | 117.6 | Death (sudden death by cardiac arrest) | 117.6 |
| 5 | MM | x | x | x | x | Dead with a functional graft | No | 36.9 | Death (septic shock) | 36.9 |
| 6 | MM | x | x | x | x | Functional graft | No | 83 | Alive | 83 |
| 7 | MM | x | x | x | x | Functional graft | No | 84.1 | Alive | 84.1 |
| 8 | MM | x | x | x | x | Dead with a functional graft | No | 36.5 | Death (multifocal epidermoïd carcinoma) | 36.5 |
| 9 | MM | x | x | x | x | Dead with a functional graft | No | 80.1 | Death (oesophagus epidermoïd carcinoma) | 80.1 |
| 10 | MM | Relapse | Renal insufficiency by cast nephropathy and new bone lesions | 38.3 | BD, PR | Failed allograft to cast nephropathy | Yes | 38.2 | Death (septic shock) | 44.4 |
| 11 | MM | x | x | x | x | Functional graft | No | 59 | Alive | 59 |
| 12 | MM | Relapse | Haematologic progression (rapid ascension of the serum kappa light chain) without new identified ROTI | 19.6 | BD, unrated response | Functional graft | No | 19.6 | Alive | 19.6 |
| 13 | MM | x | x | x | x | Functional graft | No | 19.5 | Alive | 19.5 |
Survival since ESRD
Survival since ESRD was significantly higher in our 9 MM patients with KT versus 63 haemodialysed matched controls (seven per patient) with MM (P = 0.002) (Figure 4). Of note, the median survival for controls with MM and cast nephropathy without KT since ESRD was 61.2 months. Importantly, data regarding the initial response of MM therapy were not available for the control group (MM without KT) and these control patients all had MM plus cast nephropathy.
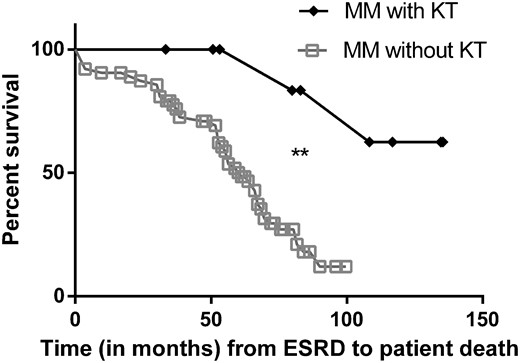
Survival since ESRD of MM with KT versus MM without KT in haemodialysis. The REIN database was used to retrieve data from patients with MM in haemodialysis without KT. These controls were matched with their relative case for sex, year of birth (±6 years) and year of MM diagnosis (±3 years). Control cases were only found for 9/13 MM patients with KT. Patient survival since ESRD was significantly higher in our 9 MM patients with KT versus their 63 (seven per patient) matched control MM patients without KT (P = 0.002).
DISCUSSION
The main question is whether MM patients with ESRD should be considered for KT or not. Given the morbidity and mortality of MM on the one hand and of kidney transplant penury on the other, we should consider with caution if this strategy can benefit this population without wasting valuable kidney grafts.
Several isolated case reports or small series without controls and with really short follow-ups (<5 years of KT) [31, 32] have recently suggested that KT could be safe in selected patients.
In this study we provide a first attempt to analyse the benefit of kidney graft versus continuous haemodialysis in MM patients and we precisely compare the outcomes of kidney graft in MM patients versus control-matched standard kidney-grafted patients.
Survival of patients was greatly increased in MM patients with KT versus those without. Unfortunately we were unable to match our control cases for initial responses to MM therapy and an MM-associated diagnosis. Nevertheless, we select control patients with a relatively good prognosis: the median survival was 61 months, compared with 18 months in the same REIN registry between 2002 and 2011 taking into account all MM patients [13]. However, we cannot conclude if this increased survival in our MM patients with KT is only due to a better initial haematological prognosis and/or to KT. We strongly think that KT is not neutral in increasing the survival of our patients, given the results we obtained compared with control patients with KT without MM.
During the pre-graft period, all patients had at least VGPR after the first treatment for MM. Four patients relapsed once before KT but had VGPR and CR to the second or third line of treatment. We find that KT was delayed by the history of MM, probably because of deferred recruitment to the KT waiting list (data not available). We suggest that patients should be tested for a pre-transplant checkup 1 year after complete remission and registered on the renal transplant list. Two years after the treatment of MM and in the absence of signs of relapse, a graft proposal could be accepted.
After KT, our study reveals that major outcomes regarding graft and patient survival are satisfactory and comparable to control patients. Nevertheless, patient survival tends to be lower in patients with MM/SMM, and especially MM with cast nephropathy, and MM-associated LCDD or AL amyloidosis before KT. This potential impact on mortality is not directly linked to the risk of relapse of MM patients but could reflect an increased global fragility regarding infections and cancer of these patients. In contrast, it seems that graft survival in MM patients is comparable to that of control patients, although the kidney disease may relapse (mainly by cast nephropathy).
We suppose that the use of basiliximab and not thymoglobulin in most of our cases was in part driven by the history of MM. However, the initial maintenance IS therapy was standard in our MM patients.
Minor adverse outcomes after KT were mostly comparable between cases and controls, except for viral and fungal infection rates, probably due to the combining effect of immunosenescence and haematologic treatments. Consistently, more hypogammaglobulinaemia was found in these patients compared with control kidney-transplanted patients of Tenon Hospital (unpublished data) and reflects a defect in lymphocyte B and plasma cell immunity. Viral infection did not have serious repercussions, probably due to the careful monitoring of these patients and the active reduction of IS therapy. These differences in infections occurred even though the induction therapy for KT was lighter in MM patients, as they received more basiliximab and less thymoglobulin. However, there was no increased risk of bacterial infections in MM versus control patients, and kidney graft rejections were also not different. Only TCMR occurred in MM patients, meaning that T-cell immunity was still functional in these patients. The risk of acute humoral rejection could be reduced in these particular patients, but a higher number of HM and control patients are needed to confirm this. Taken together, these results presumably indicate specific defects in immunity in these patients, especially in viral control, fungal resistance and B-cell and humoral immunity. We believe that limiting the risk of IS therapy after KT [36] in these particular patients is probably an important part of their management. As other studies have reported [17], squamous cell carcinomas were frequent in MM patients, although they are also common in transplanted patients generally [37]. These specific risks should be carefully monitored in the future.
The risk of relapse of MM was relatively low and concerned only 20% of patients (2/10). In contrast, two-thirds of SMM evolved to MM during the KT period. The fast evolution of SMM to MM after KT may mean that these SMM patients were probably MM during the last period of haemodialysis before KT, with evolution hidden because of anuria. Specific treatment of SMM patients should be considered 3–6 months before KT in the case of living donation, to diminish the tumour burden and the risk of early relapse. Pretreatment of all SMM patients with a deceased donor transplant is not indicated, as the beneficial effect of this treatment may be diluted over time and as the timing of KT is subject to chance. This treatment could also favour severe infectious disease. A careful examination of the risk of early relapse/evolution, especially around the KT period (before in the case of living donor or after in the case of deceased donor), is of the utmost importance to avoid cast nephropathy.
IS therapy did not seem to alter the outcome of MM, as only a few relapses were diagnosed after KT and no patient died from refractory MM.
There are evident limits to this study, most especially the small number of patients and no possibility of later follow-up analysis.
We believe that a standardized process to select MM patients is urgently needed. New tools are emerging to refine the prognosis in MM patients. These tools {genetic aberrations study, gene expression signatures [microarray], host factors [particularly age], tumour responsiveness to treatment and research for persistent minimal residual disease (MRD) in the bone marrow using flow cytometry or next-generation sequencing and extramedullary MRD using positron emission tomography–computed tomography scan]} [38] should be pooled to select the MM patients eligible for KT. Viral/fungal infections and malignancies should be regularly screened and IS therapy reduced if necessary. Regular screening for relapse of MM after KT is mandatory.
In conclusion, selected MM patients may benefit from KT but need careful surveillance in case of KT complications and evolution to MM.
ACKNOWLEDGEMENTS
We thank the DIVAT consortium for its help and active participation in this project, with particular thanks to Prof. Dany Anglicheau and Clarisse Kerleau; Prof. Frank Bridoux and Prof. Hélène François for their constructive discussions regarding this project and Cecile Couchout, Mathilde Lassalle and Prof. Luc Frimat for their help regarding the REIN database.
CONFLICT OF INTEREST STATEMENT
The authors have no conflicts of interest to disclose.
AUTHORS’ CONTRIBUTIONS
J.P., E.R. and R.K. designed the study. C.P.-N., C.M., B.A., D.V., R.S., J.S., A.D., J.D., S.G., V.P. and L.A. followed the patients and collected data for their centre for patients and/or the control patients issued from the DIVAT cohort. R.K. collected the data from Tenon Hospital patients, performed statistical analysis and wrote the article. All authors revised the manuscript.
REFERENCES
Survie des personnes atteintes de cancer en France métropolitaine 1989-2013. Partie 2: hémopathies malignes/2016/Maladies chroniques et traumatismes/Rapports et synthèses/Publications et outils/Accueil. http://invs.santepubliquefrance.fr/Publications-et-outils/Rapports-et-syntheses/Maladies-chroniques-et-traumatismes/2016/Survie-des-personnes-atteintes-de-cancer-en-France-metropolitaine-1989-2013-Partie-2-hemopathies-malignes (30 August 2017, date last accessed)
Agence de la biomédecine. Le rapport annuel médical et scientifique


Comments