


Abstract
Information regarding coronavirus disease 2019 (COVID-19) in haemodialysis (HD) patients is limited and early studies suggest a poor outcome. We aimed to identify clinical and biological markers associated with severe forms of COVID-19 in HD patients.
We conducted a prospective, observational and multicentric study. Sixty-two consecutive adult HD patients with confirmed COVID-19 from four dialysis facilities in Paris, France, from 19 March to 19 May 2020 were included.
Blood tests were performed before diagnosis and at Days 7 and 14 after diagnosis. Severe forms of COVID-19 were defined as requiring oxygen therapy, admission in an intensive care unit or death. Cox regression models were used to compute adjusted hazard ratios (aHRs). Kaplan–Meier curves and log-rank tests were used for survival analysis.
Twenty-eight patients (45%) displayed severe forms of COVID-19. Compared with non-severe forms, these patients had more fever (93% versus 56%, P < 0.01), cough (71% versus 38%, P = 0.02) and dyspnoea (43% versus 6%, P < 0.01) at diagnosis. At Day 7 post-diagnosis, neutrophil counts, neutrophil:lymphocyte (N:L) ratio, C-reactive protein, ferritin, fibrinogen and lactate dehydrogenase levels were significantly higher in severe COVID-19 patients. Multivariate analysis revealed an N:L ratio >3.7 was the major marker associated with severe forms, with an aHR of 4.28 (95% confidence interval 1.52–12.0; P = 0.006). After a median follow-up time of 48 days (range 27–61), six patients with severe forms died (10%).
HD patients are at increased risk of severe forms of COVID-19. An elevated N:L ratio at Day 7 was highly associated with the severe forms. Assessing the N:L ratio could inform clinicians for early treatment decisions.
INTRODUCTION
In March 2020, Europe became the second epicentre of coronavirus disease 2019 (COVID-19) caused by severe acute respiratory syndrome coronavirus 2 (SARS-CoV-2). Similar to Italy and Spain, France was severely impacted, with the highest infection rates in the northeastern region, Paris and its suburbs. Co-morbidities such as age, hypertension, diabetes, obesity and chronic kidney disease (CKD) are risk factors for developing severe forms of COVID-19 that are associated with the worst outcomes and high in-hospital death rates [1–3].
Haemodialysis (HD) patients have a compromised immune system and present many co-morbidities linked to severe forms of COVID-19 [4, 5]. Travelling from home to dialysis facilities three or more times a week and being surrounded by other patients in a healthcare setting increases their risk for COVID-19 infection and transmission. Prompt identification of SARS-CoV-2 infection and isolation are essential to reducing disease spread and controlling the pandemic, especially in this particularly vulnerable population. To date, available information regarding the epidemiology, outcome and therapeutic strategy for COVID-19 infection in HD patients remains limited [6–8].
This study aims to report on the epidemiological, clinical, biological and radiological characteristics and outcomes of COVID-19 HD patients from four dialysis facilities belonging to the Association pour l’Utilisation du Rein Artificiel en Ile de France (AURA) dialysis care institution.
MATERIALS AND METHODS
Patients
We conducted a multicentre, observational, prospective study of adult HD patients from four main dialysis units of the AURA: AURA Paris Plaisance, Bichat, Saint-Ouen and Corentin Celton. Between 19 March and 19 May 2020, 612 patients were reviewed. One hundred and thirty-seven patients were suspected of SARS-CoV-2 infection and were tested. Sixty-two were diagnosed as positive.
Inclusion criteria were adult (>18 years) patient on HD >6 months and infection by SARS-CoV-2. Diagnosis was assessed by reverse transcription polymerase chain reaction (RT-PCR) for SARS-CoV-2 on nasopharyngeal swab samples or by typical COVID-19 radiological images on thoracic computed tomography (CT) scan. The date of diagnosis was defined as the day when RT-PCR or the CT scan results confirmed the diagnosis.
Data collection
We collected patient epidemiological and laboratory data using our medical informatics record system (Medial, France). Demographic data collected were age, sex, weight, body mass index (BMI), ethnicity, diabetes, history of coronary artery disease (CAD), stroke, atrial fibrillation, chronic obstructive pulmonary disease (COPD), sleep apnoea, history of renal transplantation and autoimmune disorders, HD vintage, HD technique [haemodiafiltration (HDF) or HD] and the use of antihypertensive drugs [β-blocker, renin–angiotensin–aldosterone system inhibitors (RAASis), calcium channel blockers, diuretics], immunosuppressive drugs, anticoagulation treatment, statins and native and active vitamin D derivatives.
Symptoms during the observational period were also collected, including fever, chills, fatigue, cough, dyspnoea, myalgia, arthralgia, headache, anosmia, ageusia, rhinitis and diarrhoea, as well as clinical dialysis parameters, including pre-dialysis systolic and diastolic blood pressure (BP) and dry weight.
Strategy for COVID-19 detection
Only patients showing signs suggestive of infection or isolated biological signs of COVID-19 [lymphopaenia, elevated C-reactive protein (CRP) and ferritin levels] were tested for SARS-CoV-2. Nasopharyngeal swab samples were collected and SARS-CoV-2 was assessed by RT-PCR with two different tests: the Cobas SARS-CoV2 kit (Roche, Basel, Switzerland) and the RealStarSARS-CoV-2 RT-PCR Kit 1.0 (Altona Diagnostics, Hamburg, Germany).
When RT-PCR was negative but the clinical suspicion was strong, a second RT-PCR and/or a thoracic CT scan were performed. The CT scan data were collected from five departments (Hôpital Bichat, Clinique du Landy, Hôpital Saint-Joseph, Clinique Labrouste, Hôpital Privé des Peupliers). All images were assessed by a trained local radiologist.
Biological monitoring for COVID-19 patients
For each patient with a positive COVID-19 diagnosis, a blood test for inflammation markers [CRP, ferritin, fibrinogen, lactate dehydrogenase (LDH)] and standard full blood examination (FBE) analysis was performed every 7 days from the diagnosis of infection Day 0 to Day 14. Routine monthly blood test results prior to COVID-19 infection were used as the reference (referred to as M-1).
Outcome and patients
Severe forms of COVID-19 were defined as requiring oxygen ventilation therapy, admission into an intensive care unit (ICU) or death. Patients with severe forms of COVID-19 were hospitalized in the nearest teaching hospital. Compassionate treatment was initiated by the physician according to local practice and doses were adjusted to kidney function. Patients received either lopinavir/ritonavir, 200 mg twice a day for 7 days; hydroxychloroquine, 600 mg on Day 1 and 200 mg twice a day for 9 days, plus azithromycin 500 mg on Day 1 and 250 mg/day for 5 days; tocilizumab, 8 mg/kg by two consecutive intravenous infusions every 12 h; anakinra, 100 mg subcutaneously on Day 1 then 100 mg after each dialysis session for 9 days or prednisone, 2 mg/kg for 3 days then 1 mg/kg for 3 days.
Statistical analysis
For baseline characteristics and continuous variables, Student’s t-test, Welsh’s t-test or Mann–Whitney–Wilcoxon test were used. For binary variables, χ2 test or Fisher’s exact test were used to assess the significance of observed differences. For discrete variables, χ2 test was used.
For survival analyses, Day 0 was the date of diagnosis or hospital entry, whichever came first. Kaplan–Meier curves were drawn and survival functions were compared using a log-rank test.
For regression analyses, all values available upon diagnosis and without missing data were assessed using univariate Cox regression. Continuous-to-discrete transformation was performed for biological values using the median value as a cut-off.
All variables significantly associated with the event in univariate Cox regression with a P-value <0.1 were used to build a multivariate Cox model (termed Model 1). Biological values obtained after Day 0 were added to Model 1 as time-dependent covariates to correct for immortality bias.
We also built a second multivariate Cox model (termed Model 2) that includes all variables associated with COVID-19 in the literature, such as age, arterial hypertension, diabetes, CAD and BMI. All tests were two-sided and a P-value <0.05 was considered significant. Statistical analyses were performed using R version 4.0.0 (R Foundation for Statistical Computing, Vienna, Austria).
Ethical statement
Our study is a prospective human non-interventional study and was approved by the local institutional review board (Hôpital Saint-Joseph, Paris). All patients provided written consent and all patients received notification of their inclusion in the study.
RESULTS
Baseline characteristics
General screening and prompt isolation measures were applied to all patients (temperature evaluated at the entrance, mandatory face mask and hand washing, dedicated attendance hall). Of the 612 patients presenting for HD during March 2020, 137 patients were suspected of SARS-CoV-2 infection and were tested. A total of 62 patients tested positive (55 by RT-PCR, 7 by CT scan). The median age was 62.5 years and 61% of patients were male. A comparison of the baseline demographic characteristics and clinical findings between non-severe and severe patients are detailed in Table 1. Arterial hypertension was common in the patients (84%). Diabetes was present in half of them—slightly more often in patients developing severe COVID-19 infection, but this was not statistically significant (P = 0.61). Among all co-morbidities, only BMI was significantly higher in symptomatically severe patients (29.2 ± 7.3 versus 24.6 ± 5.6, P = 0.01). Severe patients also tended to have an increased history of stroke and sleep apnoea, but this did not reach statistical significance. Most patients were treated by HDF. The mean dialysis vintage was higher in the severe group (78.8 ± 77.5 versus 68.9 ± 57.7 months, P = 0.79). Baseline medication was similar in both groups, except for a higher prevalence of steroid (18% versus 4%, P = 0.12) and RAASi use (56% versus 32%, P = 0.11) in the non-severe patients.
Patient characteristics, dialysis parameters and clinical findings at COVID-19 diagnosis
| Characteristics | All patients (N = 62) | Non-severe patients (n = 34) | Severe patients (n = 28) | P-value |
|---|---|---|---|---|
| Age (years), mean ± SD | 62.5 ± 17 | 60.8 ± 18 | 64.5 +/- 17 | 0.40 |
| Male, n (%) | 38 (61) | 22 (65) | 16 (57) | 0.73 |
| Ethnic group, n (%) | 18 (53) | NS | ||
| Caucasian | 27 (44) | 0 (0) | 9 (32) | |
| North African | 2 (3) | 12 (35) | 2 (7) | |
| African American | 28 (45) | 4 (12) | 16 (57) | |
| Asian | 5 (8) | 1 (4) | ||
| Co-morbidity, n (%) | ||||
| Diabetes | 31 (50) | 16 (47) | 15 (54) | 0.61 |
| Hypertension | 52 (84) | 29 (85) | 23 (82) | 1.00 |
| CAD | 20 (32) | 11 (32) | 9 (32) | 1.00 |
| Atrial fibrillation | 9 (15) | 4 (12) | 5 (18) | 0.72 |
| History of stroke | 8 (13) | 3 (9) | 5 (18) | 0.45 |
| COPD | 4 (6) | 1 (3) | 3 (11) | 0.32 |
| Sleep apnoea | 11 (18) | 4 (12) | 7 (25) | 0.20 |
| History of kidney transplantation | 8 (13) | 6 (18) | 2 (7) | 0.28 |
| Cancer | 4 (6) | 2 (6) | 2 (7) | 1.00 |
| Autoimmune disorders | 3 (5) | 2 (6) | 1 (4) | 1.00 |
| BMI (kg/m2), mean ± SD | 26.7 ± 6.7 | 24.6 ± 5.6 | 29.2 ± 7.3 | 0.01 |
| Blood type, n (%) | ||||
| A | 19 (31) | 8 (24) | 11 (39) | NS |
| B | 11 (18) | 6 (18) | 5 (18) | |
| AB | 4 (6) | 3 (9) | 1 (4) | |
| 0 | 25 (40) | 15 (43) | 10 (35) | |
| NA | 3 (5) | 2 (6) | 1 (4) | |
| Treatment, n (%) | ||||
| RAASi | 28 (45) | 19 (56) | 9 (32) | 0.11 |
| *ACE inhibitors | 10 (16) | 7 (21) | 3 (11) | 0.49 |
| *ARB | 19 (31) | 13 (38) | 6 (21) | 0.18 |
| Calcium channel inhibitor | 24 (39) | 14 (41) | 10 (36) | 0.86 |
| β-blockers | 36 (58) | 22 (65) | 14 (50) | 0.24 |
| Diuretics | 37 (60) | 18 (53) | 19 (68) | 0.23 |
| Statins | 32 (52) | 15 (44) | 17 (61) | 0.19 |
| Anti-platelet therapy | 32 (52) | 15 (44) | 17(61) | 0.19 |
| Vitamin K antagonist | 6 (10) | 3 (9) | 3 (11) | 1.00 |
| Nutritional vitamin D | 48 (77) | 25 (74) | 23 (82) | 0.62 |
| Active vitamin D analogs | 22 (35) | 13 (38) | 9 (32) | 0.82 |
| Steroid | 7 (11) | 6 (18) | 1 (4) | 0.12 |
| Dialysis modality | ||||
| Dialysis vintage, mean ± SD | 73 ± 67 | 69 ± 58 | 79 ± 76 | 0.79 |
| Type of dialysis (HD/HDF), n/n | 22/40 | 12/22 | 10/18 | 1.00 |
| Vascular access (AVF), n (%) | 60 (97) | 33 (97) | 27 (96) | NS |
| Local anti-coagulation (yes/no), n/n | 57/5 | 31/3 | 26/2 | NS |
| Blood flow rate (mL/min), mean ± SD | 348 ± 41 | 349 ± 40 | 346 ± 42 | 0.73 |
| Dialysis time (min), mean ± SD | 237 ± 46 | 232± 44 | 243 ± 48 | 0.46 |
| Sessions per week, mean ± SD | 3.1 ± 0.5 | 3.1 ± 0.6 | 3 ± 0.2 | 0.10 |
| Clinical findings, n (%) | ||||
| Fever | 45 (73) | 19 (56) | 26 (93) | <0.01 |
| Chills | 31 (50) | 17 (50) | 14 (50) | 1.00 |
| Fatigue | 35 (56) | 18 (53) | 17 (61) | 0.54 |
| Cough | 33 (53) | 13 (38) | 20 (71) | 0.02 |
| Dyspnoea | 14 (23) | 2 (6) | 12 (43) | <0.01 |
| Myalgia | 17 (27) | 8 (24) | 9 (32) | 0.57 |
| Arthralgia | 8 (13) | 4 (12) | 4 (14) | 1.00 |
| Headache | 11 (18) | 4 (12) | 7 (25) | 0.20 |
| Anosmia | 5 (8) | 4 (12) | 1 (4) | 0.37 |
| Ageusia | 5 (8) | 4 (12) | 1 (4) | 0.37 |
| Rhinitis | 5 (8) | 4 (12) | 1 (4) | 0.37 |
| Diarrhoea | 10 (16) | 4 (12) | 6 (21) | 0.32 |
| Physical examination, mean ± SD | ||||
| Temperature (°C) | 37.6 ± 1 | 37.5 ± 1 | 37.8 ± 1 | 0.16 |
| Percutaneous Sat O2 (%) | 96 ± 5 | 98 ± 2 | 94 ± 6 | 0.01 |
| sBP (mmHg) | 149 ± 28 | 146 ± 21 | 153 ± 35 | 0.42 |
| dBP (mmHg) | 74 ± 15 | 76 ± 13 | 72 ± 16 | 0.23 |
| Heartbeat (per minute) | 80 ± 17 | 77 ± 18 | 85 ± 14 | 0.05 |
| Weight (kg) | 75 ± 19 | 69 ± 17 | 82 ± 18 | 0.01 |
| Time from illness to test (day) | 4 ± 4 | 4 ± 5 | 3 ± 2 | 0.44 |
| COVID-19 diagnosis, n (%) | 0.03 | |||
| RT-PCR | 55 (89) | 28 (82) | 27 (96) | 0.01 |
| CT scan | 39 (63) | 16 (47) | 23 (82) | |
| CT scan lesion involvement, n (%) | NS | |||
| <25% | 21 (34) | 11 (32) | 10 (36) | |
| 25–50% | 8 (13) | 3 (9) | 5 (18) | |
| 50–75% | 3 (5) | 0 (0) | 3 (11) | |
| >75% | 3 (5) | 0 (0) | 3 (1) | 1.00 |
| Pulmonary embolism, n (%) | 1 (2) | 0 (0) | 1 (4) |
ACE, angiotensin-converting enzyme; ARB, angiotensin-receptor blocker; AVF, arteriovenous fistula; Percutaneous Sat O2, percutaneous oxygen saturation; sBP, systolic blood pressure; dBP, diastolic blood pressure; CT scan, thoracic computed tomography; NS, non significant.
Compared with the control patients, severe COVID-19 patients had higher rates of fever (93% versus 56%, P < 0.01), cough (71% versus 38%, P = 0.02) and dyspnoea (43% versus 6%, P < 0.01). Fatigue was also evident in more than half of the total number of patients. Other minor symptoms such as anosmia, ageusia and rhinitis were more frequent in the non-severe group, but this was not statistically significant. No significant difference in the ABO blood type was observed between the two groups. Most of the patient cohort had typical bilateral radiologic signs of COVID-19 (interstitial syndrome, nodular lesion). Only one patient had a pulmonary embolism.
Inflammatory profile during the 14 days post-diagnosis
At diagnosis, all patients presented lymphopaenia and an inflammatory state that included increased CRP and ferritin levels compared with their previous routine blood test (Figure 1). Severe patients had a higher mean CRP level (56 ± 57 versus 34 ± 40 mg/L, P = 0.05) and mean fibrinogen level (5.6 ± 1.1 versus 4.3 ± 1.3 g/L, P = 0.03) as compared with non-severe patients (Table 2). At Day 7, the means of five biomarkers were statistically different between severe and non-severe patients: neutrophil count (4641 ± 1977 versus 3410 ± 1410/mm3, P = 0.02), CRP (92 ± 109 versus 30 ± 53 mg/L, P < 0.01), ferritin (2089 ± 1403 versus 975 ± 831 ng/mL, P < 0.01), fibrinogen (6.6 ± 2.1 versus 4.9 ± 1.1 g/L, P = 0.01) and LDH (397 ± 175 versus 259 ± 119 UI/L, P < 0.01) (Figures 1 and 2). The neutrophil:lymphocyte (N:L) ratio was also higher in the severe patient group at Day 7 (7.4 ± 5.8 versus 3.4 ± 2.1, P < 0.01) and at Day 14 (5.8 ± 5.1 versus 2.9 ± 1.5, P < 0.01) (Figure 1).
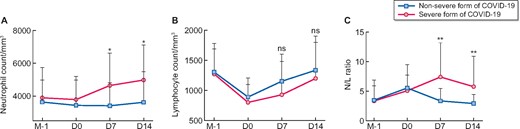
(A) Neutrophil count, (B) lymphocyte count and (C) N:L ratio kinetic in non-severe (blue) and severe (red) forms of COVID-19. M-1: last monthly routine measure; D0: day of COVID-19 diagnosis. Data are expressed as mean ± SD. *P < 0.05, **P < 0.01, ns: non-significant (Mann–Whitney test).
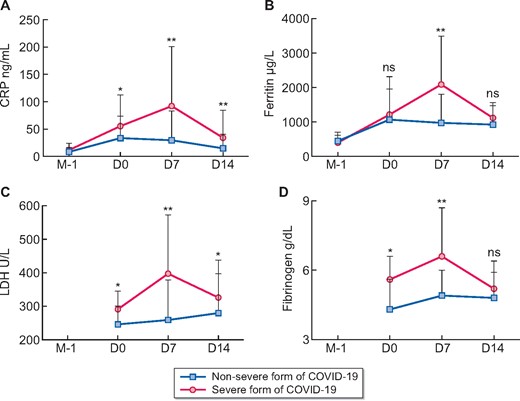
Circulating (A) CRP level, (B) ferritin level, (C) LDH level and (D) fibrinogen in non-severe (blue) and severe (red) forms of COVID-19. M-1: last monthly routine measure was not available for LDH and fibrinogen; D0: day of COVID-19 diagnosis. Data are expressed as mean ± SD. *P < 0.05, **P < 0.01, ns: non-significant (Mann–Whitney test).
Biological findings at COVID-19 diagnosis
| Findings | All patients (N = 62) | Non-severe patients (n = 34) | Severe patients (n = 28) | P-value |
|---|---|---|---|---|
| Haemoglobin (g/dL) | 11 ± 1.3 | 11 ± 1.3 | 11.1 ± 1.3 | 0.63 |
| Leucocyte count (/mm3) | 5099 ± 1633 | 4997 ± 1895 | 5223 ± 1268 | 0.33 |
| Neutrophil count (/mm3) | 3575 ± 1527 | 3431 ± 1770 | 3750 ± 1175 | 0.09 |
| Lymphocyte count (/mm3) | 850 ± 308 | 890 ± 316 | 803 ± 298 | 0.51 |
| Platelet count (/mm3) | 181 ± 65 | 191 ± 75 | 169 ± 47 | 0.15 |
| Ferritin (ng/mL) | 1111 ± 944 | 1067 ± 889 | 1215 ± 1101 | 0.90 |
| TSAT (%) | 18 ± 9 | 19 ± 9 | 12 ± 5 | <0.01 |
| CRP (mg/L) | 44 ± 49 | 34 ± 40 | 56 ± 57 | 0.05 |
| Aspartate amino transferase (UI/L) | 28 ± 12 | 29 ± 14 | 28 ± 11 | 0.84 |
| Alanine amino transferase (UI/L) | 18 ± 12 | 19 ± 15 | 18 ± 7 | 0.53 |
| GGT (UI/L) | 46 ± 45 | 43 ± 48 | 51 ± 42 | 0.22 |
| PAL (UI/L) | 99 ± 57 | 102 ± 62 | 93 ± 46 | 0.77 |
| Creatine kinase (UI/L) | 125 ± 135 | 142 ± 156 | 87 ± 66 | 0.74 |
| LDH (UI/L) | 264 ± 64 | 246 ± 54 | 291 ± 72 | 0.06 |
| Fibrinogen (g/L) | 4.7 ± 1.4 | 4.3 ± 1.3 | 5.6 ± 1.1 | 0.03 |
| PT (%) | 86 ± 27 | 92 ± 24 | 71 ± 32 | 0.11 |
| Sodium (mmol/L) | 137 ± 3 | 137 ± 3 | 137 ± 4 | 0.93 |
| Potassium (mmol/L) | 4.4 ± 1 | 4.5 ± 1 | 4.3 ± 1 | 0.35 |
| 25(OH)D (ng/mL) | 45 ± 17 | 45 ± 20 | 44 ± 10 | 0.86 |
Values are expressed as mean ± SD.
TSAT, transferrin saturation Index; GGT, gamma glutamyl transferase; PAL, total alkaline phosphatases; PT, prothrombin time; 25(OH)D, 25-hydroxyvitamin D.
Treatment
All severe group patients received broad-spectrum antibiotics early (<72 h after the diagnosis) and comprised cephalosporin (third generation) and macrolides (Table 3). Hydroxychloroquine was given to a total of six patients but was stopped for two patients due to the development of a long QT interval.
Patient treatment and outcome
| Treatment or outcome | All patients (N = 62) | Non-severe patients (n = 34) | Severe patients (n = 28) | P-value |
|---|---|---|---|---|
| Antibiotic therapy | 23 (37) | |||
| Cephalosporin (third generation) | 21 (34) | 7 (21) | 16 (57) | <0.01 |
| Macrolide | 14 (23) | 6 (18) | 15 (54) | 0.01 |
| Others | 4 (12) | 10 (36) | 0.03 | |
| Chloroquine | 6 (10) | 1 (3) | 5 (18) | 0.08 |
| Ritonavir/lopinavir | 3 (6) | 1 (3) | 3 (11) | 0.32 |
| Immunomodulatory therapy | 12 19) | 0 (0) | 12 (43) | NA |
| Oral steroids | 10 (16) | 0 (0) | 10 (36) | <0.01 |
| Anakinra | 6 (10) | 0 (0) | 6 (21) | 0.01 |
| Tocilizumab | 1 (2) | 0 (0) | 1 (4) | 0.45 |
| Outcome | ||||
| ICU admission, n (%) | 5 (8) | 0 (0) | 5 (18) | NA |
| Oxygen therapy length (days) | 6 ± 4 | NA | 6 ± 4 | NA |
| Hospitalization length (days) | 12 ± 9 | 7 ± 5 | 13 ± 10 | 0.08 |
| Recovery, n (%) | 54 (87) | 33 (97) | 21 (75) | 0.02 |
| Mean recovery time (days) | 14 ± 6 | 14 ± 5 | 15 ± 7 | 0.40 |
| Weight loss at recovery (kg) | 3.8 ± 4 | 2.3 ± 1.5 | 5.8 ± 5.3 | <0.01 |
| Weight loss at recovery (%) | 5.1 ± 4.7 | 3.5 ± 2.3 | 7.2 ± 6.2 | <0.01 |
| Death, n (%) | 6 (10) | 0 (0) | 6 (21) | NA |
Values are expressed as mean ± SD unless stated otherwise.
Finally, 12 severe group patients (43%) received immunomodulatory therapy depending on local practice (steroids, anakinra or tocilizumab). Five severe group patients (18%) were admitted to an ICU. Six deaths were observed (10% of all COVID-19 patients and 21% of severe patients).
During admission, the ultrafiltration rate and dry weight were constantly evaluated and modulated to avoid pulmonary oedema; we observed a mean weight loss of 5.8 ± 5.3 kg in the severe patients. The average weight loss between admission and Day 14 was 5.1 ± 4.7 kg and was greater in the severe-symptoms patient group (3.5 ± 2.3 versus 7.2 ± 6.2 kg, P < 0.01) (Table 3).
Risk factors associated with the severe forms
The median follow-up time was 48 days (range 27–61). The multivariate analysis model 1 revealed an N:L ratio >3.7 was the main marker associated with severe COVID-19, with an adjusted hazard ratio of4.28 (95% confidence interval 1.52–12.0, P = 0.006; Table 4 and Figure 3). A similar result was observed when we used a broader analytical model (Model 2) that included all variables associated with COVID-19 outcomes that have been reported in the literature, such as age, arterial hypertension, diabetes, CAD and BMI, which were not statistically significant in our univariate analysis (Supplementary data, Table S1). We also analysed the risk associated with the use of RAASis (Supplementary data, Figure S1). While this was lower in the severe-symptom group (44% versus 67%), this did not reach statistical significance (P = 0.07).
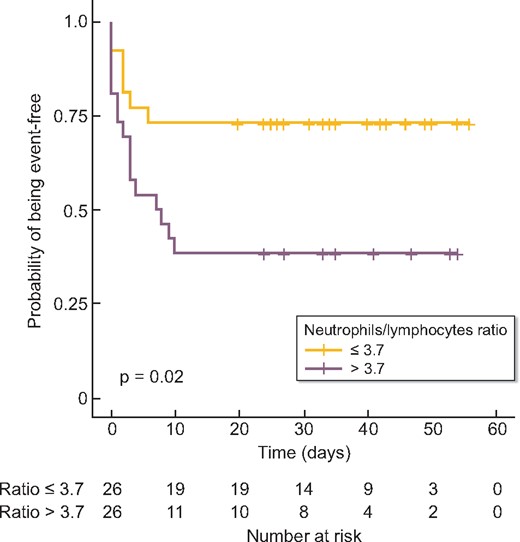
Survival free of oxygen therapy, ICU admission or death among HD patients diagnosed with SARS-CoV-2 infection. Kaplan–Meier method was used to draw survival curves and the log-rank test was used for comparison of survival curves.
Cox regression model 1
| Variable | HR | 95% CI | P-value |
|---|---|---|---|
| Fever | 6.78 | 1.21–38 | 0.03 |
| Cough | 1.09 | 0.45–2.7 | 0.85 |
| Dyspnoea | 1.19 | 0.46–3.1 | 0.72 |
| Pulmonary disease | 1.65 | 0.75–3.6 | 0.27 |
| RAASi treatment | 0.85 | 0.38–1.9 | 0.71 |
| BMI >25 kg/m2 | 1.58 | 0.70- 3.6 | 0.27 |
| N:L ratio >3.7 | 4.50 | 1.54–13.1 | <0.01 |
Pulmonary disease: history of sleep apnoea syndrome and/or chronic respiratory failure; CI, confidence interval.
DISCUSSION
HD patients are immunocompromised and accumulate numerous risk factors predisposing them to developing severe forms of COVID-19, including age, diabetes, arterial hypertension, obesity and cardiovascular diseases. Several recent reports have described the clinical features, biological findings, therapeutic strategies and evolution of COVID-19 in HD patients [6, 7, 9–11]. Herein we report a multicentre experience of 62 consecutive COVID-19-positive HD patients. A detailed description of the clinical, biological, treatment and evolutionary characteristics of both ambulatory and severe forms of COVID-19 is presented.
The incidence of COVID-19 in our HD cohort was 11%. While this was much higher than that reported by the national CKD French registry ‘Réseau Epidémiologie et Information en Néphrologie’ (REIN; 3% on 4 May 2020), it is less compared with China (16%), Spain (12%) and Italy (15%) [6–8, 10]. This lower incidence may be explained by two factors. First, our local policies include rapid testing of all symptomatic patients and their immediate isolation in dedicated dialysis areas with COVID-19-dedicated nurses and doctors as recommended by the ERA-EDTA guidelines [12]. While this was possible in our dialysis centres, this may not be the case for all hospitals and clinics. Second, in our dialysis clinics we enforce strict implementation of protective measures, including the wearing of surgical face masks by patients, personal caregivers and clinical staff; forbid all food intake in the dialysis area and perform rigorous and routine disinfection of the entire dialysis area, including furniture and dialysis machines and equipment.
In the context of COVID-19, HD patients represent a unique cohort because viral infection can be detected at an early phase and they can be closely examined and retested every 48–72 h until the inflammatory phase (Days 10–14) as part of their normal hospital visitation schedule. While most of our patients had fever and upper respiratory tract symptoms similar to the general population, a small group of them also had atypical symptoms such as isolated ageusia/anosmia or only biological abnormalities [13]. Asthenia was a common symptom seen in many patients at diagnosis and during the evolution of the disease as reported by Goicoechea et al. [6]. At diagnosis, only higher body temperature (>39°C), cough and relatively low peripheral oxygen saturation could discriminate between patients with mild symptoms and those who would become ‘symptomatically severe’ during the following days. Thoracic CT scans performed either at diagnosis or during the following 10 days also contributed to identifying the severe forms, which showed typical signs of COVID-19 such as bilateral interstitial syndrome and nodular lesions.
Severe forms of COVID-19 elicit an ‘explosive’ inflammatory reaction that causes direct tissue injury and organ failure [14, 15]. This ‘cytokine storm’ differs from that observed in malignant haemopathy, with other elements such as vasculopathy and thrombosis also present [16, 17]. Several biomarkers for COVID-19 have been proposed, including lymphopaenia (reduced CD4+ and/or CD8+ T cells) and increased circulating levels of CRP, LDH and cytokines (IL-6, IL-10 and tumour necrosis factor) [14, 18]. Our biological monitoring allowed us to decipher the complex inflammatory response mounted during the two COVID-19 phases (early and inflammatory). We observed that the blood test performed on Day 7, rather than at diagnosis (Day 0), better discriminates patients who will develop severe forms of COVID-19 from those with the non-severe forms, and this was based on the combination of several markers: neutrophils (N), lymphocytes (L), N:L ratio, LDH, fibrinogen, CRP and ferritin. However, in multivariate analysis, only an N:L ratio >3.7 at Day 7 was associated with the severe form and with poor survival. This finding is similar to the recent report by Qin et al. [18] showing that an N:L ratio >5.2 was associated with the most severe form of COVID-19 within a cohort of 452 patients. Thus the N:L ratio could be useful for clinicians to identify early those patients likely to develop the severe form of the disease.
We observed that only 6 of the 62 patients presenting the severe form of COVID-19 (10%) died after a median follow-up period of 48 days (range 27–61). This death rate is lower than that reported by REIN (13.2% for Paris and its suburbs and 17.5% for the whole country on 19 May 2020) and other reports from China (16%), Spain (31%) and Italy (29%) [6–8, 10]. We cannot explain the reason for the lower mortality rate observed in our cohort since these patients share approximately the same number of co-morbidities, except for ischaemic cardiac disease and older age being more frequent in the Brescia cohort [7]. However, we hypothesize that we paid specific attention to preventing patient fluid overload in order to avoid and/or exacerbate pulmonary congestion. This intervention was reflected by the weight loss of our patients, which was markedly greater in severe patients compared with that in patients with milder forms (4.4 versus 3.7 kg, respectively) over a short period of time (generally from Day 0 to Day 10 after disease onset). Finally, 43% of our patients with the severe form received immunomodulatory treatment. The specificity and the delay of initiation of such therapy, which was used in a compassionate context, might have improved their outcomes and suggests promising effects for these medications [9, 19]. However, our study was not powered to assess the predictive value of any treatment.
Several concerns were raised at the beginning of the COVID-19 pandemic regarding the potential deleterious effect of RAASis [20]. Surprisingly, in our cohort the use of RAASis seems to be associated with a better outcome; however, the association did not reach statistical significance, probably due to the small number of patients. Nevertheless, our findings are in line with those reported by two other studies on larger populations [21, 22].
Our study has some limitations. First, it is a small population cohort. Second, our definition of severe forms of COVID-19 differs from the World Health Organization definition, as respiratory frequency was lacking at diagnosis and was only available during hospitalization. Our definition is only based on initiation of oxygen therapy and/or ICU admission. Third, as opposed to blood testing, thoracic CT scans were not performed at the same time as illness onset. Thus we could not assess its predictive value for clinical evolution. Fourth, some biological measures such as D-dimer, Hs-troponin and cytokine levels (IL-1β, IL-6, IL-12) were not performed systematically and were not included in our biological profile. However, our study’s strength is our biological samples that were performed systematically for each patient.
In conclusion, HD patients are at increased risk of COVID-19. We observed a lower mortality rate compared with other European countries. Longitudinal biological monitoring, specifically the N:L ratio at Day 7, may represent a reliable biomarker of COVID-19 severity.
SUPPLEMENTARY DATA
Supplementary data are available at ckj online.
ACKNOWLEDGEMENTS
The authors would like to thank all the medical and nursing staff at all AURA facilities that were and are still fully engaged during this time.
CONFLICT OF INTEREST STATEMENT
The authors declare no competing financial interest.
DATA AVAILABILITY STATEMENT
The data that support the findings of this study are available from the corresponding author upon reasonable request (Contact M.T, [email protected]).
REFERENCES
Author notes
Prisca Mutinelli-Szymanski, Iulia Hude and Emilie Merle authors contributed equally to this work as co-first authors.
Yannis Lombardi and Pascal Seris authors contributed equally to this work as co-second authors.
Pablo Ureña-Torres and Maxime Touzot authors are co-senior authors.


Comments