


Abstract
End-stage kidney disease (ESKD) treatment is very costly and accounts for a significant percentage of public healthcare expenditures. Beyond direct costs, dialysis patients use other healthcare levels, but the impact of public investment on each of these levels is unclear. This study aimed to investigate the association between direct financing at different healthcare levels and overall mortality in peritoneal dialysis (PD) patients.
We included all adult incident PD patients from a Brazilian prospective, nationwide PD cohort. Overall mortality was the primary outcome of interest. We used a three-level multilevel survival analysis to investigate whether mortality was associated with the investments destined to different levels of healthcare complexity: (i) primary, (ii) medium and high and (iii) professional healthcare training and community awareness.
We evaluated 5707 incident PD patients from 78 Brazilian cities, which were divided into four quartiles for each healthcare level (Groups I–IV). After taking the highest quartile (Group IV) as a reference, investment in the primary health level was not associated with patient survival. Otherwise, medium and high complexity levels were associated with higher mortality risk. Also, investment in healthcare manager training and community awareness had an impact on patient survival.
Investments in different levels of the healthcare system have distinct impacts on PD patient survival. Investment in healthcare manager training and community awareness seems to be a promising strategy on which to focus, given the relatively low cost and positive impact on outcome.
INTRODUCTION
End-stage kidney disease (ESKD) has an enormous impact on the economy of a country [1, 2]. In general, there is a huge discrepancy between the percentage of total healthcare expenditures dedicated to ESKD patient treatment and ESKD prevalence in the population. For example, in the USA, on 31 December 2016, there were 726 331 prevalent cases of ESKD, about 0.22% of the general population. Of note, between 2015 and 2016, spending for Medicare beneficiaries with ESKD increased from $33.8 billion to $35.4 billion, accounting for 7.2% of overall paid Medicare claims. A similar scenario is present in developing economies [1, 3]. In Brazil, the direct cost of dialysis therapy accounted for ∼2.5% of the public healthcare budget, with a prevalence of 0.06% in 2017 (133 000 people undergoing dialysis in a population of 209 million) [4].
Peritoneal dialysis (PD) is seen as an alternative for reducing the costs associated with renal replacement therapy (RRT). A recent initiative of the US government aims to achieve 80% of ESKD patients on home dialysis by 2025 [5]. PD offers similar life expectancy and quality of life compared with hemodialysis (HD), but at a lower cost [6, 7]. PD costs are also high, although they are less when compared with HD, and measures are needed to reduce the economic burden of both methods on the healthcare system. The costs of PD can be addressed through several fronts that may differ from country to country.
In Brazil, national PD data were previously reported by our group. In general, even though the patient’s mean age (59.8 ± 16.2 years) and proportion of diabetics (48%) are high, our results showed that the peritonitis rate was 1 episode per 36 patient-months; technique survival at 1, 2, 3, 4 and 5 years was 91, 84, 77, 68 and 58%, respectively, and patient survival was 85, 74, 64, 54 and 48%, respectively [8, 9]. These results are comparable with those of developed country cohorts [10–,12]. One possible explanation is that almost all PD treatment is financed by the Brazilian Unified Health System (SUS), an open and universal access system [13]. However, in Brazil it is theoretically possible to obtain benefits and improve outcomes from investments directed at dialysis itself, including better reimbursement for doctors and the multidisciplinary team and/or the acquisition of better dialysis supplies [13]. In the same way, investments in the primary healthcare system, in which PD patients often need a referral for free access to diabetes and hypertension medications and treatment of comorbidities that are not dialysis-related and for those medium- and high-level hospitals that admit ESKD patients, can potentially influence patient outcomes. Finally, we can achieve better PD results by investing in new policy development, implementing guidelines and training and qualifying healthcare professionals specifically directed at ESKD care.
However, no previous studies have analyzed whether such investments could really affect PD patient outcomes. Therefore the objective of this study was to investigate whether the investments in different healthcare levels influence overall PD patient mortality.
MATERIALS AND METHODS
This was a nationwide prospective study from the Brazilian Peritonel Dialysis Multicenter Cohort Study (BRAZPD II) . Its general characteristics have been reported elsewhere [9]. Adult patients initiating PD from December 2004 to January 2011 were included. The database consists of data from 122 dialysis centers in 78 cities that cover all regions of Brazil. The medical ethical committees of all participating centers approved the study.
Definitions
Total investments
These investments consist of the total investments in healthcare from the SUS in a reference year. The investments included the budget for primary healthcare, for the treatment of medium- and high-complexity diseases, pharmacy assistance, structural investments and educational actions for healthcare managers and community participation.
Investments in primary healthcare
These investments consist of two budgets. The first is a fixed amount that is transferred monthly from the government in a systematic way to the cities and needs to be used in primary healthcare programs. The second is variable and depends on local project approval that aims to improve or influence the primary care system in agreement with specific rules.
Investments in medium- and high-complexity healthcare levels
For medium- and high-complexity healthcare levels, the investments are compounded by a regular monthly transfer of financial resources from the government to the states and cities in order to implement the policies of medium and high complexity to the population. In addition, they have additional resources that are used to reimburse medium- and high-complexity procedures, including dialysis and related procedures. Of note is that in Brazil, access to high-cost drugs (e.g. erythropoietin, intravenous iron, sevelamer, cinacalcet, calcitriol, etc.) is universal and does not change from region to region. In addition, the number of PD exchanges does not impact the cost of the therapy to the government because the values are fixed per patient.
Investments in manager training and community awareness
These investments are used for the development and training of managers, including resources for regulation, control, measurement, audits and monitoring, budgeting and planning, intelligence technology programs and actions and projects for involving and sensitizing the population.
Group definitions
For each of the four types of investment presented above, we created four groups of cities using quartiles according to ‘per capita’ investment (Groups I–IV). Group I will always have the lowest investment ‘per capita’ while Group IV will have the highest. The latter will be considered the reference group for all statistical comparisons. Of note is that groups created for each type of investment may be composed of different cities.
Statistical analysis
Continuous variables are expressed as mean ± SD or median and interquartile range while categorical variables are expressed as frequencies or percentages.
The primary outcome was mortality resulting from any cause. We used a three-level multilevel multivariate survival analysis to investigate whether the budget destined to healthcare in different levels of complexity was associated with mortality risk. The results were adjusted for all variables available in the database and included family income at baseline (measured as the Brazilian minimum wage); age; history of HD, peripheral artery disease, diabetes or coronary artery disease (CAD); race; literacy; center size; body mass index (BMI); predialysis care; residual renal function (RRF) at baseline; initial PD modality and peritonitis rate. Akaike information criteria were used to choose the best-fit survival model. Statistical significance was set at P < 0.05. All analyses were performed with Stata 14 (StatCorp, College Station, TX, USA).
RESULTS
Study population and baseline characteristics
We included 5707 incident PD patients from 78 Brazilian cities. The mean age of the population was 59.4 ± 15.9 years, 43.5% were diabetics, 47.5% were males, 65.2% had <4 years of formal education and 33.8% had, on average, a monthly family income of <US$370 per family. The investments for each healthcare level are expressed in Table 1. Supplementary data, Table S1 summarizes the demographic and clinical characteristics of patients according to group.
Financial investments at different healthcare levels
| Group | Investments (US$ per capita) | |||
|---|---|---|---|---|
| Education of health managers and community awareness | Primary care | Medium and high complexity | Total investment | |
| I | Up to US$0.06 | Up to US$10.3 | Up to US$37.6 | Up to US$51.9 |
| (n = 1417) | (n = 1420) | (n = 1464) | (n = 1433) | |
| II | US$0.07–0.30 | US$10.4–13.5 | US$37.7–79.6 | US$52–102.9 |
| (n = 1440) | (n = 1427) | (n = 1391) | (n = 1445) | |
| III | US$0.31–1.09 | US$13.6–16.6 | US$79.7–150.6 | US$103–197.9 |
| (n = 1567) | (n = 1418) | (n = 1424) | (n = 1358) | |
| IV | >US$1.09 | >US$16.6 | >US$150.6 | >US$198 |
| (n = 1283) | (n = 1442) | (n = 1428) | (n = 1471) | |
Outcomes
There were 1057 deaths in the study population and their distribution according to group of investment is shown in Table 2.
Mortality in PD patients stratified by financial investments
| Group | Number of deaths for any cause and incidence rate per 1000 days in treatment (95% CI) | |||
|---|---|---|---|---|
| Education of health managers and community awareness | Primary care | Medium and high complexity | Total investment | |
| I | n = 331 | n = 312 | n = 328 | n = 321 |
| 11.1 (10.0–12.4) | 10.3 (9.2–11.5) | 11.0 (9.8–12.3) | 11.4 (10.3–12.8) | |
| II | n = 301 | n = 284 | n = 271 | n = 280 |
| 11.2 (10.0–12.6) | 10.0 (8.8–11.3) | 10.3 (9.2–11.6) | 10.0 (8.9–11.2) | |
| III | n = 238 | n = 250 | n = 208 | n = 243 |
| 8.9 (7.9–10.1) | 9.1 (7.9–10.4) | 10.4 (9.1–11.7) | 10.5 (9.3–11.9) | |
| IV | n = 187 | n = 211 | n = 250 | n = 213 |
| 9.4 (8.2–10.9) | 11.8 (10.4–13.3) | 9.2 (8.0–10.5) | 8.9 (7.8–10.2) | |
Investments in the primary care system had no impact on patient survival. Taking as a reference the quartile of cities that received >US$16.6 ‘per capita’ (Group IV), the hazard ratio (HR) and the 95% confidence interval (CI) for the first, second and third quartiles (Groups I, II and III, respectively) were HR 1.21 (95% CI 0.92–1.45), 1.06 (95% CI 0.85–1.32) and 0.91 (95% CI 0.73–1.13), respectively.
The investment in medium- and high-complexity diseases was associated with better patient survival. Compared with cities that received >US$150.6 ‘per capita’ (Group IV), Group I [HR 1.67 (95% CI 1.14–2.45)] and Group II [HR 1.37 (95% CI 1.01–1.90)] had a higher mortality risk. Group III presented no significant difference from Group I [HR 1.24 (95% CI 0.96–1.60)].
Finally, investments in healthcare manager training also had a positive impact on patient survival. Group I [HR 1.54 (95% CI 1.17–2.02)] and Group II [HR 1.52 (95% CI 1.17–1.97)] had a higher mortality risk than Group I that received >US$1.09 ‘per capita’. Group III [HR 1.20 (95% CI 0.96–1.41)] had no significant difference compared with the reference group. Figure 1 summarizes these findings.
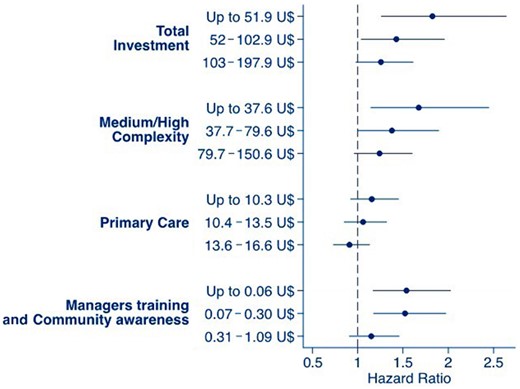
PD patient’s survival according to investment levels in primary care, medium- and high-complexity assistance level and manager training and community awareness. Data from patients treated by SUS from 2004 to 2011. Mixed-effect model considered patients nested in their respective dialysis center as random effects and the other covariates as fixed effects.
The covariates selected were the same for all models and included age, RRF, previous HD, peripheral artery disease, diabetes, CAD, race, literacy, center size and BMI.
DISCUSSION
To our knowledge, this is the first study that has investigated whether financial investments in different healthcare levels are associated with PD patient mortality rates. We found a direct and linear association between investments for medium- and high-complexity levels, in addition to resources for healthcare professional education, and patient survival.
Brazil has a public health system that provides universal access to its citizens [13]. The financial resources to maintain such a system are scarce and are due at least in part to changes in demographic and epidemiological profiles with a growing prevalence of chronic diseases [14, 15]. During the study period, the Brazilian government invested ~8.0% on average of the gross domestic product (GDP) in the healthcare system [2, 14, 15]. It is worth noting that the world average was 9.0% of GDP for healthcare at that time. Brazilian numbers were not too different even for developed economies such as France, Spain and Switzerland. In 2010, France allocated 10.7% of its GDP to healthcare, Spain 9.0% and Switzerland 10.7% [16].
According to Brazilian laws from 2012, states and the Federal District have annually applied to public health actions and services at least 12% of tax collection, while municipalities have invested 15% [17]. In turn, the annual federal investments in healthcare must be at least the amount committed in the previous financial year plus the percentage corresponding to the nominal growth in GDP that occurred in the year prior to the annual budget law. However, regional managers have the autonomy to define priority actions at each level of complexity.
The lack of well-defined criteria or structures for regulating the way in which the healthcare budget should be applied favors huge distortions within cities and regions. On the other hand, such heterogeneity provides an opportunity to investigate whether different amounts of investment ‘per capita’ through different levels of the healthcare system may influence PD patient outcomes.
Direct investments in high and medium healthcare levels, which included dialysis, were linearly associated with patient survival. It is important to further discuss possible explanations for this association because these are findings from a public system in which all patients were supposed to receive similar treatment options. One of them is the lack of a good hospital structure (such as a lack of beds in both wards and intensive care units or even technology for some complementary exams or cardiology procedures) that would be crucial for dialysis patients in urgent situations.
We also investigated whether investment in primary care could affect patient survival because the treatment of several PD patient comorbidities is managed at this level. Our findings depicted in Figure 1 suggest a linear increase in patient survival, but the differences between groups did not reach statistical significance, which may have been influenced by the small difference in investments between the lowest and highest quartiles (<US$7 per year). Therefore our results were unable to predict if greater financial investment at this level of the healthcare system would have any benefits with respect to patient survival.
Finally, a very interesting finding was the positive impact of investments in healthcare system worker training on patient survival. Possibly, well-trained professionals are more capable of engaging in good clinical practice, act to prevent comorbidities and identify priorities based on local clinical indicators. In 2004, a national policy of permanent healthcare education was established in Brazil, which aims at transforming and qualifying healthcare training processes and healthcare education practices. The present results may influence the definition of priorities in this policy [18].
Our study has limitations inherent to any cohort study and others that were study specific. RRF was not measured as a continuous variable and was only available at baseline. However, we could not find any plausible explanation suggesting that RRF could be different between centers; Kt/V was also not captured in the BRAZPD, but this marker of small solute removal has been diminished in importance given several limitations that were recently published in the International Society for Peritoneal Dialysis(ISPD) guidelines [18, 19]. Unfortunately, our database does not include the reasons for choosing PD as RRT. Finally, investment data were collected retrospectively, so we do not have information about how much was exclusively designated for treating ESKD patients. Likewise, it was not possible to know how much of the global investments were used in concrete effective medical services.
In conclusion, the investment in different healthcare levels in Brazil, particularly financial resources for high- and medium-complexity levels and professional training, had a positive impact on PD patient survival. Given the need of gaining efficiency for any country that provides universal access to healthcare [21], such as ours, incentives for the development of programs to improve the training of healthcare workers may be a strategy to improve outcomes of PD patients at relatively low cost.
SUPPLEMENTARY DATA
Supplementary data are available at ckj online.
ACKNOWLEDGEMENTS
The authors thank the centers participating in the study for their contributions and dedication. They also thank Dr Eliana Goldfarb Cyrino for her suggestions regarding this manuscript.
FUNDING
This study was financed by Baxter Healthcare, Brazil.
AUTHORS’ CONTRIBUTIONS
All authors contributed to the conception and design of the study. G.L. wrote the first draft of the manuscript. G.L. and T.P.d.M. organized the database. T.P.d.M. performed the statistical analysis.
CONFLICT OF INTEREST STATEMENT
R.P.-F. received research grants, consulting fees and speaker honoraria from Baxter Healthcare. A.E.F., P.B. and T.P.d.M. received consulting fees and speaker honoraria from Baxter Healthcare. G.L. and J.A.W.C. declare that the research was conducted in the absence of any commercial or financial relationships that could be construed as a potential conflict of interest.
REFERENCES
United States Renal Data System. 2018 Annual Data Report Chapter 9: Healthcare Expenditures for Persons with ESRD. https://www.usrds.org/2018/view/v2_09.aspx (11 November 2019, date last accessed)
Brasil, Ministério da Saúde: Portaria n° 1.675, de 7 de junho de 2018,
Brasil, Presidência da República, Lei complementar n° 141, de 13 de janeiro de 2012. http://www.planalto.gov.br/ccivil_03/leis/LCP/Lcp141.htm. (11 November 2019, date last accessed)
Brasil, Ministério da Saúde, Portaria n° 198/GM/MS, de 13 de fevereiro de 2004. http://bvsms.saude.gov.br/bvs/saudelegis/gm/2017/MatrizesConsolidacao/comum/13150.html. (11 November 2019, date last accessed)


Comments