


Abstract
A haemodialysis patient with periprosthetic fractures and a history of corticosteroid use was referred for assessment for bone mineral disorders. Mixed renal osteodystrophy was diagnosed following a bone biopsy. Correction for vitamin D insufficiency did not improve the clinical signs, which prompted a potential diagnosis of hypophosphataemic osteomalacia to be considered. No causes for hypophosphataemia were found, except for phosphate dietary restrictions. Phosphorus supplementation was administered, resulting in an upturn in bone biochemical and histological parameters and increased bone mineral density, thus confirming the diagnosis of hypophosphataemic osteomalacia due to low phosphate intake. Characteristic features related to this diagnosis are shown from three repeated bone biopsies performed during the course of patient follow-up.
CASE REPORT
A 52-year-old haemodialysis patient was referred in 2015 for mechanical pain in the left hip. His medical history began in 1985 with a diagnosis of immunoglobulin A (IgA) nephropathy, which led to haemodialysis therapy. The patient underwent three kidney transplantations that failed between 1986 and 1987. Secondary hyperparathyroidism ensued, requiring a subtotal parathyroidectomy in 1990. In addition, bilateral hip replacement was performed in 1989, following corticosteroid-induced ischaemic necrosis of both femoral heads. The left hip was replaced for instability in 2000.
X-ray of the left femur revealed bilateral thin radiolucent areas around the hip prosthesis components and between the cement mantle and bone, corresponding to loosening of the prosthesis.
Blood tests showed normal calcium concentrations, a high serum concentration of parathyroid hormone (PTH), 25-hydroxyvitamin D [25(OH)D] insufficiency, high concentrations of bone-specific alkaline phosphatase (bs-ALP) and low serum phosphate concentration (Table 1). The patient was anuric and did not show any potential urinary phosphate loss.
Evolution of biological, BMD and histomorphometric parameters
| Unit | Reference range | 2010 | 2015 | 2016 | 2017 | 2019 | |
|---|---|---|---|---|---|---|---|
| Biochemical markers |  | ||||||
| Serum calcium colorimetric | mmol/L | 2.15–2.5 | 2.35 | 2.33 | 2.4 | 2.35 | 2.48 |
| Serum phosphate colorimetric | mmol/L | 0.81–1.45 | 0.93 | 0.42 | 0.54 | 1.25 | 0.99 |
| P × Ca | – | – | 2.19 | 0.98 | 1.3 | 2.94 | 2.46 |
| 1-84 parathyroid hormone electrochemiluminescence | ng/L | 15–65 | 124 | 96 | 180 | 456 | |
| 25(OH)D3 electrochemiluminescence | nmol/L | – | 66 | 48 | 53 | 101 | 72 |
| bs-ALP CLIA-Liaison XL Diasorin | µg/L | 5.5–22.9 | 15 | 70.8 | 43.6 | 56.4 | 20.3 |
| P1NP chemiluminescence | µg/L | 15–80 | 755.2 | 2326 | 1596 | ||
| DXA measurement | |||||||
| BMD lumbar spine L1–L4 | g/cm² | – | 1.094 | 1.079 | 1.222 | 1.251 | |
| BMD midwrist | g/cm² | – | 0.667 | 0.5 | 0.543 | 0.537 | |
| BMD-UDR | g/cm² | – | 0.360 | 0.353 | 0.377 | 0.403 | |
| T-score lumbar spine | – | – | 0 | 0.2 | 1.2 | −1.5 | |
| T-score wrist | – | – | −2.8 | −5.2 | −4.9 | −4.3 | |
| Z-score lumbar spine | – | – | 0.2 | 0.1 | 1.5 | −1.8 | |
| Z-score wrist | – | – | −2.5 | −5.6 | −4.5 | −3.9 | |
| Histomorphometry | |||||||
| BV/TV | % | 15–22 | 24.4 | 15.88 | 17 | ||
| OV/BV | % | 2 ± 1 | 56.56 | 53.54 | 25.88 | ||
| OS/BS | % | 15 ± 5 | 54.47 | 81.43 | 68.66 | ||
| ObS/BS | % | 4 ± 2 | 0 | 6.42 | 8.21 | ||
| ES/BS | % | 0.88 ± 0.3 | 6.22 | 1.66 | 2.61 | ||
| N.Oc | n/mm² | 0.54 ± 0.05 | 5.09 | 1.06 | 2.19 | ||
| Unit | Reference range | 2010 | 2015 | 2016 | 2017 | 2019 | |
|---|---|---|---|---|---|---|---|
| Biochemical markers | | ||||||
| Serum calcium colorimetric | mmol/L | 2.15–2.5 | 2.35 | 2.33 | 2.4 | 2.35 | 2.48 |
| Serum phosphate colorimetric | mmol/L | 0.81–1.45 | 0.93 | 0.42 | 0.54 | 1.25 | 0.99 |
| P × Ca | – | – | 2.19 | 0.98 | 1.3 | 2.94 | 2.46 |
| 1-84 parathyroid hormone electrochemiluminescence | ng/L | 15–65 | 124 | 96 | 180 | 456 | |
| 25(OH)D3 electrochemiluminescence | nmol/L | – | 66 | 48 | 53 | 101 | 72 |
| bs-ALP CLIA-Liaison XL Diasorin | µg/L | 5.5–22.9 | 15 | 70.8 | 43.6 | 56.4 | 20.3 |
| P1NP chemiluminescence | µg/L | 15–80 | 755.2 | 2326 | 1596 | ||
| DXA measurement | |||||||
| BMD lumbar spine L1–L4 | g/cm² | – | 1.094 | 1.079 | 1.222 | 1.251 | |
| BMD midwrist | g/cm² | – | 0.667 | 0.5 | 0.543 | 0.537 | |
| BMD-UDR | g/cm² | – | 0.360 | 0.353 | 0.377 | 0.403 | |
| T-score lumbar spine | – | – | 0 | 0.2 | 1.2 | −1.5 | |
| T-score wrist | – | – | −2.8 | −5.2 | −4.9 | −4.3 | |
| Z-score lumbar spine | – | – | 0.2 | 0.1 | 1.5 | −1.8 | |
| Z-score wrist | – | – | −2.5 | −5.6 | −4.5 | −3.9 | |
| Histomorphometry | |||||||
| BV/TV | % | 15–22 | 24.4 | 15.88 | 17 | ||
| OV/BV | % | 2 ± 1 | 56.56 | 53.54 | 25.88 | ||
| OS/BS | % | 15 ± 5 | 54.47 | 81.43 | 68.66 | ||
| ObS/BS | % | 4 ± 2 | 0 | 6.42 | 8.21 | ||
| ES/BS | % | 0.88 ± 0.3 | 6.22 | 1.66 | 2.61 | ||
| N.Oc | n/mm² | 0.54 ± 0.05 | 5.09 | 1.06 | 2.19 | ||
BMD-UDR, bone mineral density at the ultradistal radius; BV/TV, bone volume/total volume; DXA, dual-energy X-ray absorptiometry; ES/BS, eroded surface/bone surface; N.Oc, number of osteoclasts; OV/BV, osteoid volume/bone volume; OS/BS, osteoid surface/bone surface; ObS/BS, osteoblast surface/bone surface; P × Ca, calcium–phosphate product.
The arrow indicates the time of the introduction of phosphorus supplementation.
Evolution of biological, BMD and histomorphometric parameters
| Unit | Reference range | 2010 | 2015 | 2016 | 2017 | 2019 | |
|---|---|---|---|---|---|---|---|
| Biochemical markers | | ||||||
| Serum calcium colorimetric | mmol/L | 2.15–2.5 | 2.35 | 2.33 | 2.4 | 2.35 | 2.48 |
| Serum phosphate colorimetric | mmol/L | 0.81–1.45 | 0.93 | 0.42 | 0.54 | 1.25 | 0.99 |
| P × Ca | – | – | 2.19 | 0.98 | 1.3 | 2.94 | 2.46 |
| 1-84 parathyroid hormone electrochemiluminescence | ng/L | 15–65 | 124 | 96 | 180 | 456 | |
| 25(OH)D3 electrochemiluminescence | nmol/L | – | 66 | 48 | 53 | 101 | 72 |
| bs-ALP CLIA-Liaison XL Diasorin | µg/L | 5.5–22.9 | 15 | 70.8 | 43.6 | 56.4 | 20.3 |
| P1NP chemiluminescence | µg/L | 15–80 | 755.2 | 2326 | 1596 | ||
| DXA measurement | |||||||
| BMD lumbar spine L1–L4 | g/cm² | – | 1.094 | 1.079 | 1.222 | 1.251 | |
| BMD midwrist | g/cm² | – | 0.667 | 0.5 | 0.543 | 0.537 | |
| BMD-UDR | g/cm² | – | 0.360 | 0.353 | 0.377 | 0.403 | |
| T-score lumbar spine | – | – | 0 | 0.2 | 1.2 | −1.5 | |
| T-score wrist | – | – | −2.8 | −5.2 | −4.9 | −4.3 | |
| Z-score lumbar spine | – | – | 0.2 | 0.1 | 1.5 | −1.8 | |
| Z-score wrist | – | – | −2.5 | −5.6 | −4.5 | −3.9 | |
| Histomorphometry | |||||||
| BV/TV | % | 15–22 | 24.4 | 15.88 | 17 | ||
| OV/BV | % | 2 ± 1 | 56.56 | 53.54 | 25.88 | ||
| OS/BS | % | 15 ± 5 | 54.47 | 81.43 | 68.66 | ||
| ObS/BS | % | 4 ± 2 | 0 | 6.42 | 8.21 | ||
| ES/BS | % | 0.88 ± 0.3 | 6.22 | 1.66 | 2.61 | ||
| N.Oc | n/mm² | 0.54 ± 0.05 | 5.09 | 1.06 | 2.19 | ||
BMD-UDR, bone mineral density at the ultradistal radius; BV/TV, bone volume/total volume; DXA, dual-energy X-ray absorptiometry; ES/BS, eroded surface/bone surface; N.Oc, number of osteoclasts; OV/BV, osteoid volume/bone volume; OS/BS, osteoid surface/bone surface; ObS/BS, osteoblast surface/bone surface; P × Ca, calcium–phosphate product.
The arrow indicates the time of the introduction of phosphorus supplementation.
Once infection had been excluded, the left hip prosthesis was replaced and a bone sample was taken and analysed, revealing mixed renal osteodystrophy (Figure 1A). Bone mineral density (BMD) was reduced compared with that obtained in 2010. Vitamin D supplementation was therefore optimized, aiming for higher 25(OH)D concentrations.
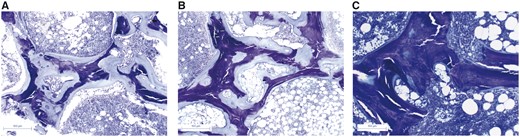
Histological changes throughout treatment. Bone biopsies stained with Toluidine Blue dramatic reduction in osteoid thickness following phosphorus supplementation. (A) Bone biopsy in 2015 with large amounts of osteoid tissue. (B) Bone biopsy in 2016 after optimized 25(OH)-vitamin D and Calcium supplementation with no improvement. (C) Bone biopsy in 2017 after phosphorus supplementation showing the mineralization of osteoid tissue.
Femoral pain reappeared 17 months later, revealing an extrusion of the distal screw of the prosthesis. A second bone biopsy was performed (Figure 1B), showing persistent, severe osteomalacia. Serum biochemistry values remained unchanged, despite optimized calcium and vitamin D supplementation apart from an increase in 25(OH)D concentrations. These findings were suggestive of hypophosphataemic osteomalacia.
The medical history and results from initial biochemical investigations dismissed most common causes of hypophosphataemia, such as toxic agent exposure, drug intake, alcohol abuse and common metabolic disorders.
Although we did not assess daily dietary phosphate intake, the patient did not have any nutritional changes but had slightly less than the recommended protein and phosphate intake, with 0.8 g/kg/day and 600–800 mg/g/day, respectively. In addition to this slightly low phosphate intake, the dialysis technique also resulted in excessive phosphate removal. Therefore we introduced oral phosphorus supplementation (1600 mg/day) that led to normalization of the serum phosphate concentration within a few days and a large increase in serum procollagen type 1 N-terminal propeptide (P1NP). Serum PTH concentrations remained high.
A treatment duration of only 5 months was required for bone recovery, as revealed histologically by a spectacular regression of osteomalacia from a third bone biopsy (Figure 1C). A significant increase in BMD was also observed.
To date, in 2019, no further bone event has occurred. The patient is ambulant and able to participate in exercise activities.
DISCUSSION
This dialysis patient with multiple fractures presented with a rare and reversible case of hypophosphataemic osteomalacia due to low phosphate intake.
Osteomalacia is a bone mineral disorder that occurs when newly laid-down matrix remains unmineralized. The major causes of osteomalacia are malnutrition or malabsorption of vitamin D and, more rarely, phosphate and/or calcium deficiency.
Vitamin D insufficiency–associated osteomalacia was the first suggested diagnosis in this case, as supported by increased serum bs-ALP and normal serum calcium concentrations. Despite the high prevalence of vitamin D deficiency in haemodialysis patients [1], the relationship between osteomalacia and vitamin D deficiency is not supported by controlled studies involving haemodialysis patients.
Once calcium-/vitamin D–associated osteomalacia had been excluded, persistent hypophosphataemia was the next most plausible diagnosis, although rarely reported in dialysis patients. Hypophosphataemic osteomalacia is generally not associated with hypocalcaemia. The prevalence of hypophosphataemia in retrospective studies is about 10%, as observed in the Dialysis Outcomes and Practice Patterns Study cohort [2]. In chronic kidney disease (CKD) patients, it is recommended to prevent severe hyperphosphataemia, which is a major cardiovascular risk factor.
Although the natural history of hypophosphataemic osteomalacia remains unknown, the accumulation of unmineralized osteoid is considered similar to that seen in vitamin D deficiency.
Toxic agent exposure (lead, carbon tetrachloride, ifosfamide, cadmium), drug intake (phosphate binders, sodium–phosphate cotransporter inhibitors) and alcohol abuse [3] were excluded as potential causes of hypophosphataemia through patient interviews. No clinical explanations were found for extrarenal damage (no splenomegaly for Gaucher’s disease etc.) and normal baseline biochemical investigations (e.g. normal serum potassium concentrations excluding Fanconi syndrome, normal aminotransferases excluding Wilson s disease) led us to cease further aetiological exploration in this IgA nephropathy patient on long-term dialysis. We did not investigate for the presence of renal tubular acidosis (RTA), even if it has been reported to be associated with bone mineral disorders. If release of phosphate and calcium is accelerated with acidosis, it can be employed as a buffer [5]. RTA can affect the response to calcitriol in bone and also decrease calcium reabsorption, which can occur in long-term osteomalacia.
The patient was anuric and did not show any potential urinary phosphate loss. Therefore, with no evidence for excessive urinary loss of phosphate in this dialysis patient, we did not assess the circulating concentrations of Klotho or fibroblast growth factor 23, which were expected to be low and high, respectively, in this case.
The recovery of clinical, biochemical and histological signs following phosphorus supplementation supports the diagnosis of hypophosphataemia due to low phosphate intake/excessive phosphate removal, a rare complication that has been mostly observed in extreme diet conditions such as in refeeding syndrome [4].
One of the strengths of this case report is the patient follow-up that included three bone biopsies. However, serial measurements of BMD will allow confirming increased mineralization, as recommended by the Kidney Disease Improving Global Outcomes in Chronic Kidney Disease patients.
In conclusion, atypical fractures in dialysis patients require a detailed assessment for bone mineral disorders with a view to excluding causes of hypophosphataemic osteomalacia. Aiming for the lowest serum phosphate concentrations in dialysis patients has to be weighed against the occurrence of bone mineral disorders.
ACKNOWLEDGEMENTS
The patient gave informed consent for this publication.
CONFLICT OF INTEREST STATEMENT
None declared.


Comments