


Abstract
This article presents a summary of the 2017 Annual Report of the European Renal Association–European Dialysis and Transplant Association (ERA-EDTA) Registry and describes the epidemiology of renal replacement therapy (RRT) for end-stage renal disease (ESRD) in 37 countries.
The ERA-EDTA Registry received individual patient data on patients undergoing RRT for ESRD in 2017 from 32 national or regional renal registries and aggregated data from 21 registries. The incidence and prevalence of RRT, kidney transplantation activity and survival probabilities of these patients were calculated.
In 2017, the ERA-EDTA Registry covered a general population of 694 million people. The incidence of RRT for ESRD was 127 per million population (pmp), ranging from 37 pmp in Ukraine to 252 pmp in Greece. A total of 62% of patients were men, 52% were ≥65 years of age and 23% had diabetes mellitus as the primary renal disease. The treatment modality at the onset of RRT was haemodialysis for 85% of patients. On 31 December 2017, the prevalence of RRT was 854 pmp, ranging from 210 pmp in Ukraine to 1965 pmp in Portugal. The transplant rate in 2017 was 33 pmp, ranging from 3 pmp in Ukraine to 103 pmp in the Spanish region of Catalonia. For patients commencing RRT during 2008–12, the unadjusted 5-year patient survival probability for all RRT modalities combined was 50.8%.
INTRODUCTION
This article is based on the European Renal Association–European Dialysis and Transplant Association (ERA-EDTA) Registry’s 2017 Annual Report and presents the most recent data on the epidemiology of renal replacement therapy (RRT) for end-stage renal disease (ESRD) in Europe. Data for the year 2017 were received from 53 national or regional renal registries from 37 countries in Europe and countries bordering the Mediterranean Sea [1]. In total, these registries represent a general population of 694 million people. When excluding Israel and Tunisia, the remaining countries cover a general population of 684.3 million people. This represents 81.1% of the 2017 European general population, which is similar when compared with the 80.5% covered in the 2016 Aannual Rreport [2]. A total of 32 national or regional renal registries from 17 countries provided individual patient data to the ERA-EDTA Registry, whereas another 21 countries or regions provided aggregated data (Appendix 1). Compared with our 2016 Annual Report, the Canary Islands (Spain) are now included with individual patient data and Kosovo with aggregated data, whereas data for the Valencia region (Spain) could not be included this year.
This article presents the 2017 incidence and prevalence of RRT, kidney transplantation activity and both patient and graft survival. A detailed description of the methods used to analyse the data, along with the complete results, can be found in the ERA-EDTA Registry 2017 Annual Report [1].
RESULTS
Incidence of RRT
In 2017, 88 453 individuals out of a population of 694 million started RRT for ESRD, resulting in an overall unadjusted incidence of 127 per million population (pmp; Table 1). The unadjusted incidence ranged from 37, 66 and 67 pmp in Ukraine, Estonia and Russia, respectively, to 236, 242 and 252 pmp in Cyprus, the Sfax region (Tunisia) and Greece, respectively (Table 1;Figures 1 and 2). Of the patients starting RRT, 62% were men, 52% were ≥65 years of age and 23% had diabetes mellitus (DM) as their primary renal disease (Figure 3). The median age of the patients starting RRT differed by >20 years between Albania (52.1 years) and Greece (74.0 years; Table 1), whereas the median age in all countries and regions combined was 66.2 years. The vast majority (85%) of patients started RRT with haemodialysis (HD), while 11% started with peritoneal dialysis (PD) and only 4% of patients received a pre-emptive kidney transplant (Figure 4). Nevertheless, there were considerable differences in the initial treatment modality between age groups, with decreasing proportions of patients receiving either PD or a pre-emptive transplant with increasing age (Figure 4). Moreover, compared with patients without a primary renal disease of DM, those with DM more often started RRT on HD (85% versus 80%) and less frequently received a pre-emptive kidney transplant (2% versus 6%). Among the incident patients receiving RRT at Day 91 after the start of treatment, 82% were receiving HD, 13% were receiving PD and 5% were living with a functioning kidney transplant (Figure 5). When compared with Day 1, the percentage of patients receiving HD decreased, which was particularly evident in the younger age groups.
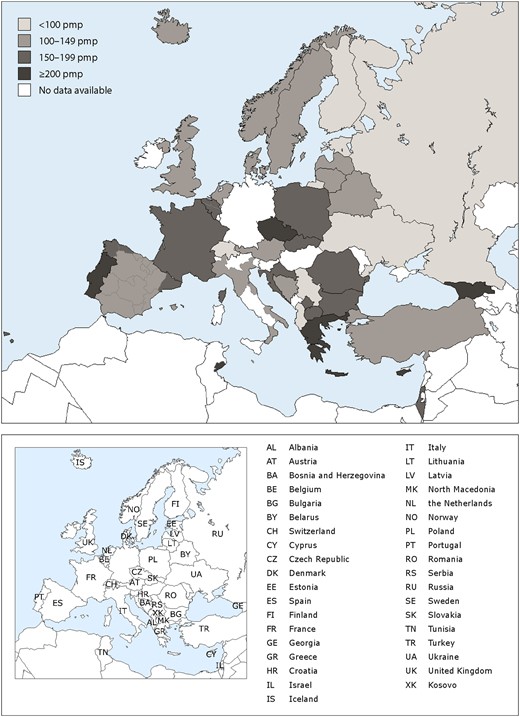
Incidence (pmp) of RRT in 2017, at Day 1, by country/region, unadjusted. The incidence for the Czech Republic, Poland, Russia, Slovakia and Sfax region (Tunisia) only includes patients receiving dialysis. For England (UK), the incidence is underestimated by 2% (Table 1).

Unadjusted (left panel) and adjusted (right panel) incidence of RRT pmp in 2017, at Day 1, by country/region. Registries providing individual patient data are shown as dark bars and registries providing aggregated data as light bars. Adjustment of incidence was performed by standardizing the rates to the age and sex distribution of the 27 European Union (EU27) countries' population. The incidence for the Czech Republic, Poland, Russia, Slovakia and Sfax region (Tunisia) only includes patients receiving dialysis. For England (UK), the incidence is underestimated by 2% (Table 1).
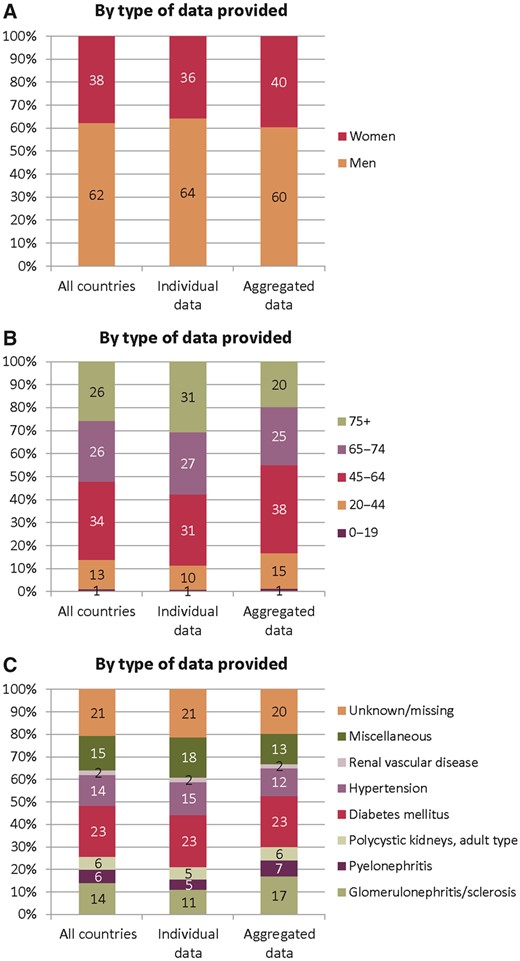
(A) Sex, (B) age and (C) primary renal disease distribution by type of data provided for incident patients accepted for RRT in 2017, at Day 1. See Appendix A1 for a list of countries and regions providing individual patient data or aggregated data.
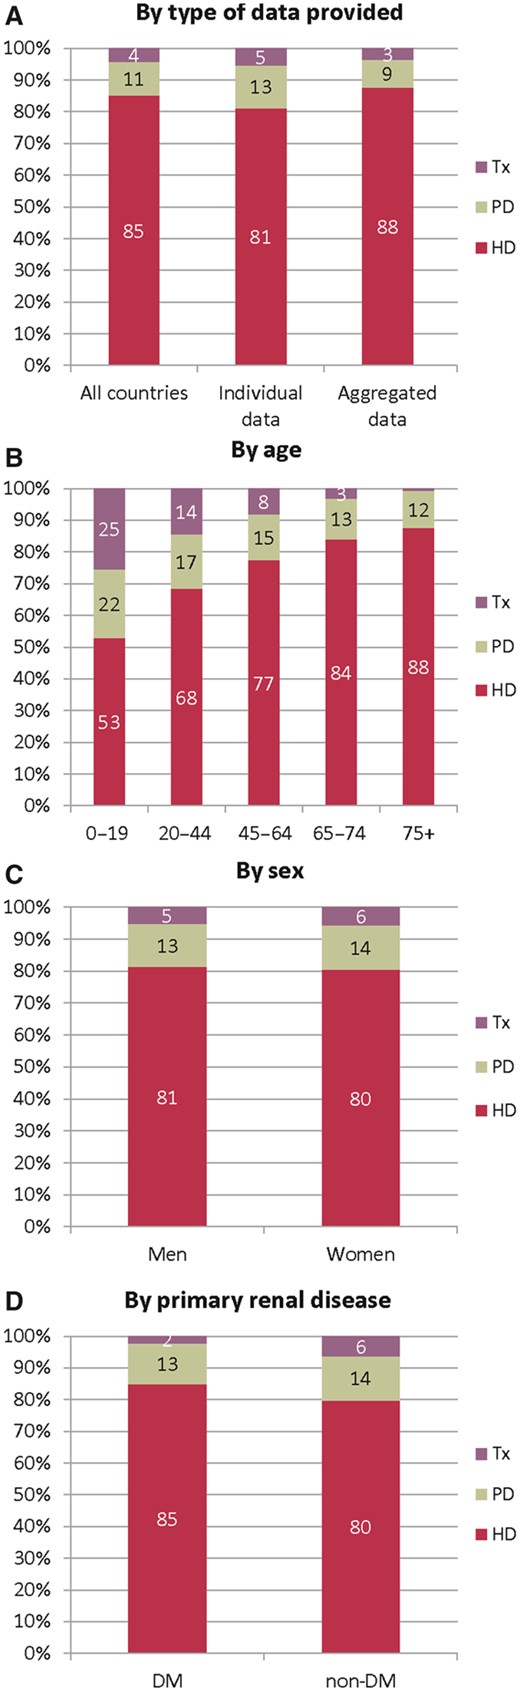
Treatment modality distribution, at Day 1, by (A) type of data provided, (B) age, (C) sex and (D) primary renal disease (DM and non-DM) for incident patients accepted for RRT in 2017. (B–D) Based on the data from registries providing individual patient data. See Appendix A1 for a list of countries and regions providing individual patient data or aggregated data. Tx, kidney transplant.
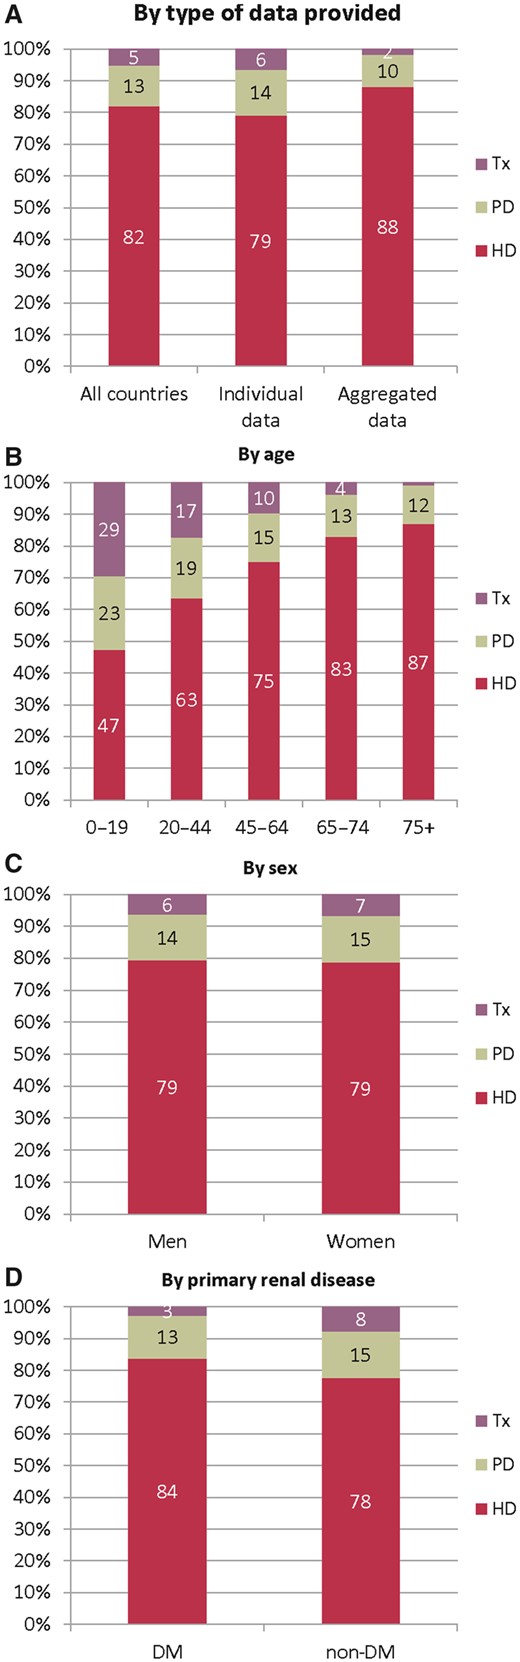
Treatment modality distribution, at Day 91, by (A) type of data provided, (B) age, (C) sex and (D) primary renal disease (DM and non-DM) for incident patients accepted for RRT in 2017. (B–D) Based on the data from registries providing individual patient data. See Appendix A1 for a list of countries and regions providing individual patient data or aggregated data. Tx, kidney transplant.
Incidence of RRT in 2017 at Day 1, by country/region, presented as count (n) and unadjusted rate pmp, the mean and median age at the start of RRT and the number and rate of patients with types 1 and 2 DM as primary renal disease
| Country/region | General population covered by the registry in thousands | Incidence of RRT in 2017, at Day 1 | |||||
|---|---|---|---|---|---|---|---|
| All (n) | All (pmp) | Mean age (years) | Median age (years) | DM (n) | DM (pmp) | ||
| Albania | 2847 | 255 | 90 | 51.2 | 52.1 | 51 | 18 |
| Austria | 8773 | 1134 | 129 | 65.7 | 68.8 | 308 | 35 |
| Belarus | 9492 | 952 | 100 | 216 | 23 | ||
| Belgium, Dutch-speakinga | 6543 | 1194 | 182 | 70.6 | 73.4 | 255 | 39 |
| Belgium, French-speakinga | 4832 | 941 | 195 | 68.3 | 70.7 | 231 | 48 |
| Bosnia and Herzegovina | 3531 | 381 | 108 | 61.9 | 63.5 | 114 | 32 |
| Bulgaria | 7050 | 1195 | 170 | 322 | 46 | ||
| Croatia | 3713 | 710 | 191 | 67.6 | 69.0 | 204 | 55 |
| Cyprus | 864 | 204 | 236 | 68.0 | 69.0 | 78 | 90 |
| Czech Republicb | 9920 | 2301 | 232 | ||||
| Denmark | 5821 | 761 | 131 | 63.8 | 67.5 | 198 | 34 |
| Estonia | 1317 | 87 | 66 | 57.0 | 60.3 | 16 | 12 |
| Finland | 5508 | 549 | 100 | 60.9 | 64.9 | 182 | 33 |
| France | 66 865 | 11 571 | 173 | 67.7 | 70.5 | 2678 | 40 |
| Georgia | 3726 | 782 | 210 | 60.9 | 63.3 | 194 | 52 |
| Greece | 10 755 | 2712 | 252 | 71.3 | 74.0 | 675 | 63 |
| Iceland | 343 | 49 | 143 | 62.2 | 66.3 | 4 | 12 |
| Israel | 8713 | 1683 | 193 | 65.6 | 68.4 | 779 | 89 |
| Italy (8 of 20 regions) | 26 298 | 3722 | 140 | 68.9 | 71.8 | 675 | 25 |
| Kosovo | 1688 | 321 | 190 | 62.9 | 65.0 | 104 | 62 |
| Latvia | 1547 | 177 | 114 | 60.9 | 62.0 | 29 | 19 |
| Lithuania | 2848 | 341 | 120 | 61.7 | 62.7 | 50 | 18 |
| North Macedonia | 2022 | 365 | 181 | 62.7 | 63.0 | 100 | 49 |
| Norway | 5277 | 584 | 111 | 63.5 | 66.9 | 104 | 20 |
| Polandb | 38 430 | 6550 | 170 | 1470 | 38 | ||
| Portugal | 10 310 | 2372 | 230 | 753 | 73 | ||
| Romania | 19 000 | 3559 | 187 | 62.3 | 64.3 | 456 | 24 |
| Russiab | 142 473 | 9495 | 67 | 55.8 | 58.0 | 1680 | 12 |
| Serbia | 6810 | 678 | 100 | 57.4 | 62.4 | 200 | 29 |
| Slovakiab | 5437 | 927 | 170 | 62.0 | 65.0 | 344 | 63 |
| Spain (all regions) | 46 572 | 6567 | 141 | 63.5 | 68.1 | 1572 | 34 |
| Spain, Andalusia | 8409 | 1107 | 132 | 63.6 | 66.5 | 270 | 32 |
| Spain, Aragon | 1315 | 168 | 128 | 64.5 | 68.6 | 45 | 34 |
| Spain, Asturias | 1034 | 161 | 156 | 67.0 | 71.1 | 41 | 40 |
| Spain, Basque Country | 2169 | 249 | 115 | 63.7 | 67.2 | 72 | 33 |
| Spain, Canary Islands | 2166 | 346 | 160 | 63.8 | 66.1 | 124 | 57 |
| Spain, Cantabriaa | 581 | 65 | 112 | 64.7 | 67.5 | 13 | 22 |
| Spain, Castile and Leóna | 2427 | 296 | 122 | 67.3 | 68.9 | 75 | 31 |
| Spain, Castile-La Manchaa | 2037 | 265 | 130 | 66.2 | 68.5 | 74 | 36 |
| Spain, Catalonia | 7556 | 1250 | 165 | 66.7 | 70.3 | 257 | 34 |
| Spain, Community of Madrid | 6507 | 865 | 133 | 65.0 | 68.0 | 228 | 35 |
| Spain, Extremadura | 1080 | 119 | 110 | 63.3 | 65.3 | 29 | 27 |
| Spain, Galicia | 2707 | 416 | 154 | 65.2 | 68.0 | 97 | 36 |
| Spain, Murcia | 1470 | 202 | 137 | 64.9 | 67.7 | 49 | 33 |
| Spain, Navarrea | 642 | 79 | 123 | 65.1 | 68.4 | 18 | 28 |
| Sweden | 10 058 | 1165 | 116 | 63.8 | 67.7 | 284 | 28 |
| Switzerland | 8452 | 824 | 97 | 65.5 | 68.8 | 160 | 19 |
| The Netherlands | 15 932 | 1839 | 115 | 64.5 | 68.1 | 370 | 23 |
| Tunisia, Sfax regionb | 990 | 239 | 242 | 62.3 | 64.0 | 66 | 67 |
| Turkeyc | 80 811 | 11 837 | 146 | 703 | 9 | ||
| UK, Englanda,d | 55 619 | 6649 | 120 | 61.9 | 63.9 | 1656 | 30 |
| UK, Northern Irelanda | 1871 | 212 | 113 | 63.7 | 67.7 | 50 | 27 |
| UK, Scotland | 5425 | 639 | 118 | 59.3 | 61.9 | 172 | 32 |
| UK, Walesa | 3125 | 379 | 121 | 62.9 | 66.3 | 105 | 34 |
| Ukraine | 42 415 | 1551 | 37 | 52.2 | 55.0 | 327 | 8 |
| All countries | 694 024 | 88 453 | 127 | 63.4 | 66.2 | 17 935 | 29 |
When cells are left empty, the data were unavailable and could not be used for the calculation of the summary data.
Patients <20 years of age are not reported. The true incidence counts are therefore slightly higher than the counts reported here.
Data include dialysis patients only.
Data on primary renal disease are available for 1893 dialysis patients (16.0%; total n = 11 837).
The incidence is underestimated by ∼2% due to one centre not submitting data since 2014.
Prevalence of RRT
On 31 December 2017, 592 779 patients were receiving RRT for ESRD (Table 2), corresponding to an overall unadjusted prevalence of 854 pmp. Among the individual countries/regions, the unadjusted prevalence ranged from 210, 319 and 333 pmp in Ukraine, Kosovo and Russia, respectively, to 1400, 1427 and 1965 pmp in the Canary Island (Spain), Catalonia (Spain) and Portugal, respectively (Table 2;Figures 6 and 7). Of the prevalent patients, 60% were men, 43% were ≥65 years and 16% had DM as their primary renal disease (Figure 8). The median age of prevalent patients receiving RRT in all countries and regions combined was 62.6 years; in individual countries, it ranged from 50.5 years in Albania to 68.4 years in the Dutch-speaking part of Belgium and Israel (Table 2). Of prevalent patients, 57% were receiving HD, 37% were living with a kidney transplant and 5% were receiving PD (Figure 9). Compared with prevalent patients without DM as their primary renal disease, those with DM were less likely to be living with a functioning kidney transplant (51% versus 28%).
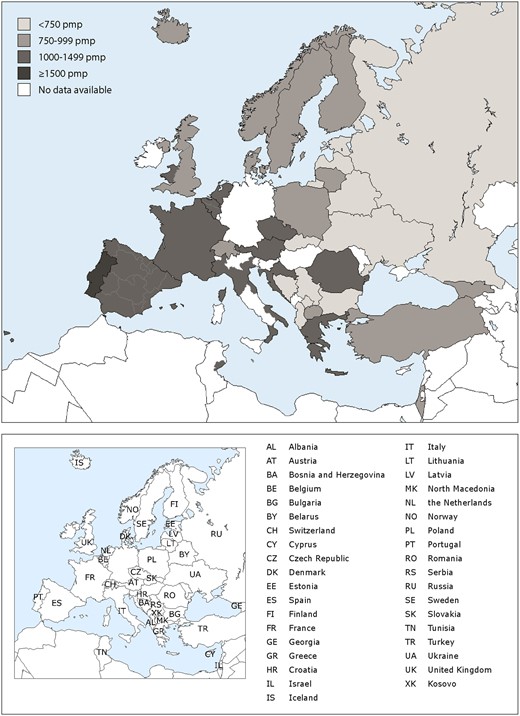
Prevalence (pmp) of RRT on 31 December 2017 by country/region. The prevalence of Israel, Slovakia and Sfax region (Tunisia) only includes patients receiving dialysis. For England (UK), the prevalence is underestimated by 1% (Table 2).
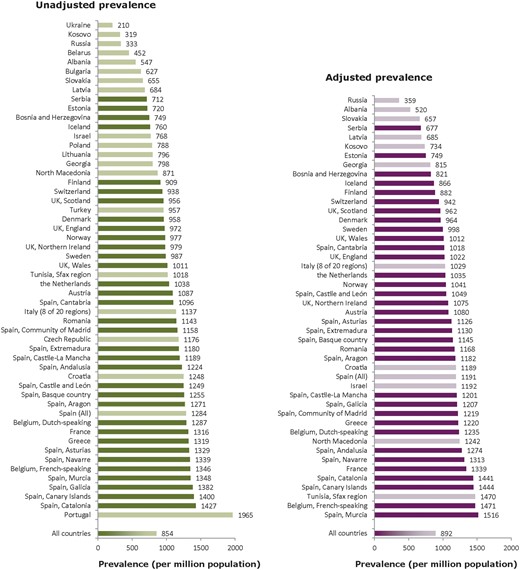
Unadjusted (left panel) and adjusted (right panel) prevalence (pmp) of RRT on 31 December 2017 by country/region. Registries providing individual patient data are shown as dark bars and registries providing aggregated data as light bars. Adjustment of the prevalence was performed by standardizing the prevalence to the age and sex distribution of the EU27 population. The prevalence of Israel only includes patients receiving dialysis. For England (UK), the prevalence is underestimated by 1% (Table 2).
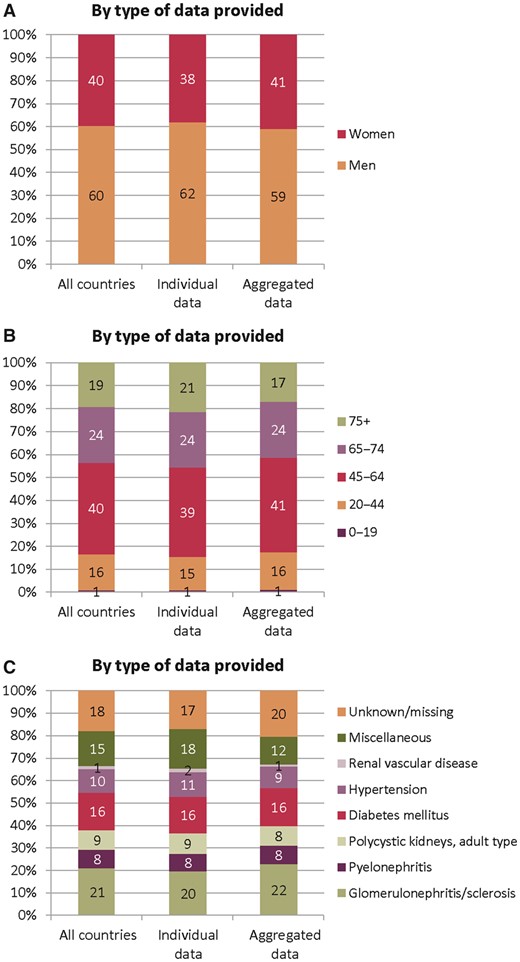
(A) Sex, (B) age and (C) primary renal disease distribution by type of data provided for prevalent patients on RRT on 31 December 2017. See Appendix A1 for a list of countries and regions providing individual patient data or aggregated data.
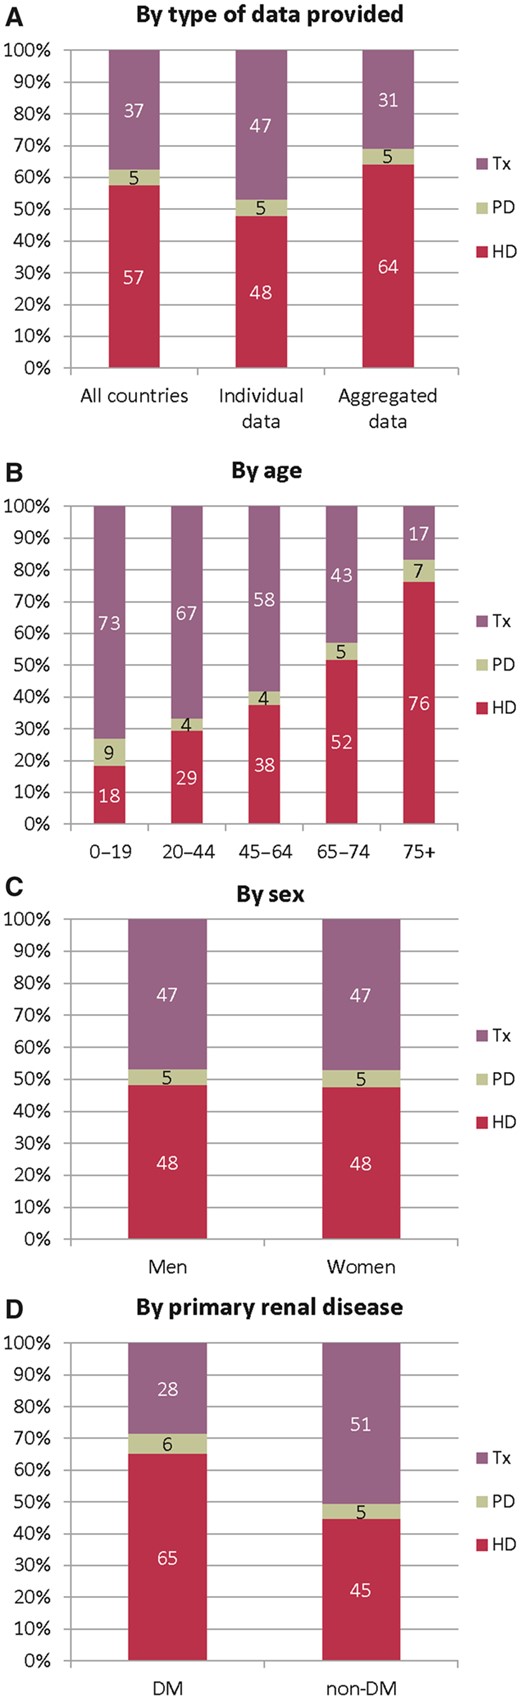
Treatment modality distribution by (A) type of data provided, (B) age, (C) sex and (D) primary renal disease (DM and non-DM) for prevalent patients on RRT on 31 December 2017. (B–D) Based on the data from registries providing individual patient data. See Appendix A1 for a list of countries and regions providing individual patient data or aggregated data. Tx, kidney transplant.
Prevalence of RRT on 31 December 2017, by country/region, presented as count (n) and unadjusted rate pmp, mean and median age on 31 December 2017 and the number and rate of patients with types 1 and 2 DM as primary renal disease
| Country/region | General population covered by the registry in thousands | Prevalent patients on RRT in 2017 | |||||
|---|---|---|---|---|---|---|---|
| All (n) | All (Pmp) | Mean age (years) | Median age (years) | DM (n) | DM (Pmp) | ||
| Albania | 2847 | 1557 | 547 | 49.5 | 50.5 | 331 | 116 |
| Austria | 8773 | 9540 | 1087 | 61.6 | 63.1 | 1874 | 214 |
| Belarus | 9492 | 4295 | 452 | 593 | 62 | ||
| Belgium, Dutch-speakinga | 6543 | 8419 | 1287 | 66.3 | 68.4 | 1441 | 220 |
| Belgium, French-speakinga | 4832 | 6506 | 1346 | 65.1 | 66.8 | 1177 | 244 |
| Bosnia and Herzegovina | 3531 | 2644 | 749 | 59.7 | 61.4 | 520 | 147 |
| Bulgaria | 7050 | 4421 | 627 | ||||
| Croatia | 3713 | 4635 | 1248 | 65.7 | 67.0 | 919 | 248 |
| Cyprus | 864 | ||||||
| Czech Republic | 9920 | 11 666 | 1176 | ||||
| Denmark | 5821 | 5579 | 958 | 59.0 | 60.6 | 951 | 163 |
| Estonia | 1317 | 949 | 720 | 58.2 | 58.9 | 168 | 128 |
| Finland | 5508 | 5008 | 909 | 59.4 | 61.7 | 1270 | 231 |
| France | 66 865 | 87 989 | 1316 | 63.0 | 65.0 | 14 423 | 216 |
| Georgia | 3726 | 2972 | 798 | 59.8 | 61.0 | 590 | 158 |
| Greece | 10 755 | 14 183 | 1319 | 65.0 | 67.0 | 2676 | 249 |
| Iceland | 343 | 261 | 760 | 56.4 | 58.4 | 26 | 76 |
| Israelb | 8713 | 6692 | 768 | 66.3 | 68.3 | 3132 | 359 |
| Italy (6 of 20 regions) | 26 298 | 30 191 | 1137 | 62.6 | 64.8 | 3920 | 148 |
| Kosovo | 1688 | 539 | 319 | 63.2 | 66.0 | 159 | 94 |
| Latvia | 1547 | 1058 | 684 | 56.4 | 58.0 | 102 | 66 |
| Lithuania | 2848 | 2268 | 796 | ||||
| North Macedonia | 2022 | 1761 | 871 | 59.0 | 60.0 | 300 | 148 |
| Norway | 5277 | 5155 | 977 | 59.7 | 61.7 | 707 | 134 |
| Poland | 38 430 | 30 278 | 788 | 5200 | 135 | ||
| Portugal | 10 310 | 20 259 | 1965 | 67.9 | 68.4 | 3511 | 341 |
| Romania | 19 000 | 21 708 | 1143 | 61.8 | 63.6 | 2189 | 115 |
| Russia | 142 473 | 47 486 | 333 | 54.2 | 57.0 | 6696 | 47 |
| Serbia | 6810 | 4850 | 712 | 58.7 | 61.2 | 835 | 123 |
| Slovakiab | 5437 | 3559 | 655 | 63.6 | 66.0 | 1177 | 216 |
| Spain (all regions) | 46 572 | 59 810 | 1284 | 59.5 | 62.7 | 9714 | 209 |
| Spain, Andalusia | 8409 | 10 296 | 1224 | 60.8 | 62.1 | 1604 | 191 |
| Spain, Aragon | 1315 | 1671 | 1271 | 63.4 | 64.7 | 299 | 227 |
| Spain, Asturias | 1034 | 1375 | 1329 | 63.4 | 64.5 | 226 | 219 |
| Spain, Basque Country | 2169 | 2722 | 1255 | 62.1 | 63.9 | 318 | 147 |
| Spain, Canary Islands | 2166 | 3032 | 1400 | 61.3 | 62.5 | 340 | 157 |
| Spain, Cantabriaa | 581 | 637 | 1096 | 62.3 | 63.6 | 92 | 158 |
| Spain, Castile and Leóna | 2427 | 3031 | 1249 | 65.3 | 66.1 | 549 | 226 |
| Spain, Castile-La Manchaa | 2037 | 2422 | 1189 | 62.8 | 63.6 | 393 | 193 |
| Spain, Catalonia | 7556 | 10 785 | 1427 | 63.2 | 65.0 | 1520 | 201 |
| Spain, Community of Madrid | 6507 | 7537 | 1158 | 62.1 | 63.5 | 1345 | 207 |
| Spain, Extremadura | 1080 | 1274 | 1180 | 62.0 | 62.7 | 194 | 180 |
| Spain, Galicia | 2707 | 3741 | 1382 | 62.9 | 64.3 | 627 | 232 |
| Spain, Murcia | 1470 | 1982 | 1348 | 62.4 | 63.3 | 283 | 192 |
| Spain, Navarrea | 642 | 860 | 1339 | 62.8 | 64.3 | 123 | 192 |
| Sweden | 10 058 | 9927 | 987 | 60.0 | 62.0 | 1776 | 177 |
| Switzerland | 8452 | 7927 | 938 | 62.2 | 64.1 | 1176 | 139 |
| The Netherlands | 16 617 | 17 246 | 1038 | 60.7 | 62.6 | 2308 | 139 |
| Tunisia, Sfax regionb | 990 | 1007 | 1018 | 58.6 | 60.0 | 211 | 213 |
| Turkeyc | 80 811 | 77 311 | 957 | 2366 | 29 | ||
| UK, Englanda,d | 55 619 | 54 043 | 972 | 58.9 | 59.4 | 9417 | 169 |
| UK, Northern Irelanda | 1871 | 1831 | 979 | 59.0 | 58.8 | 273 | 146 |
| UK, Scotland | 5425 | 5184 | 956 | 56.8 | 57.8 | 847 | 156 |
| UK, Walesa | 3125 | 3161 | 1011 | 59.5 | 60.4 | 520 | 166 |
| Ukraine | 42 415 | 8904 | 210 | 50.0 | 51.0 | 1358 | 32 |
| All countries | 694 709 | 592 779 | 854 | 60.7 | 62.6 | 84 853 | 141 |
When cells are left empty, the data were unavailable and could not be used for the calculation of the summary data.
Patients <20 years of age are not reported. The true prevalent counts are therefore slightly higher than the counts reported here.
Data on prevalence include dialysis patients only.
Data on primary renal disease (DM) is based on 6888 dialysis patients (8.9%; total n = 77 311).
The prevalence is underestimated by ∼1% due to one centre not submitting data since 2014.
Kidney transplantation
In 2017, 22 902 kidney transplantations were performed, equating to an overall unadjusted transplant rate of 33 pmp (Figure 10). In the individual countries/regions, the unadjusted kidney transplant rates ranged between 3 pmp in Ukraine and 6 pmp in Bulgaria and Kosovo to 79 and 83 pmp in Cantabria (Spain) and Basque Country (Spain), respectively, and even exceeding 100 pmp in Catalonia (Spain). Overall, the unadjusted deceased donor kidney transplant rate was more than twice that of living donor transplants [23 versus 10 pmp (71% versus 29%); Figures 11 and 12]. The highest unadjusted rates of deceased donor kidney transplants were observed in several Spanish regions (>70 pmp; Figure 12), whereas the highest unadjusted rates of living donor transplants were observed in Northern Ireland (37 pmp), Turkey (33 pmp) and The Netherlands (31 pmp; Figure 12).
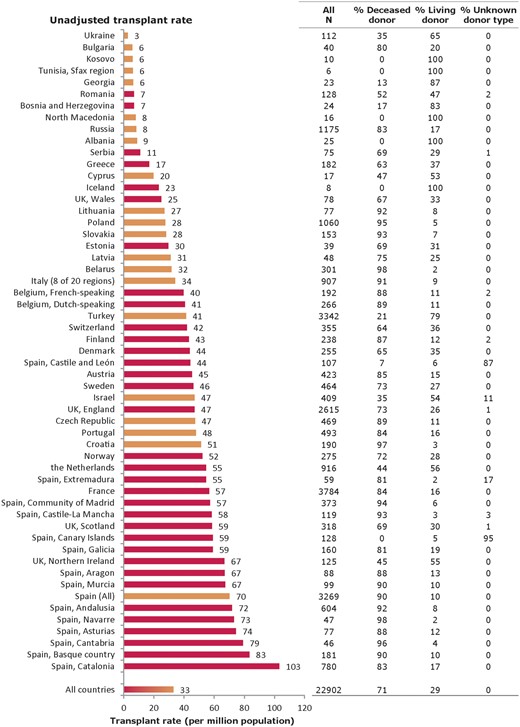
Kidney transplants performed in 2017, presented as counts and pmp (unadjusted) by country/region. Registries providing individual patient data are shown as red bars and registries providing aggregated data as orange bars. The total count for Austria is based on residents and non-residents. For Romania, Serbia and England (UK), the overall kidney transplant rate is underestimated by 30, 15 and 7%, respectively.
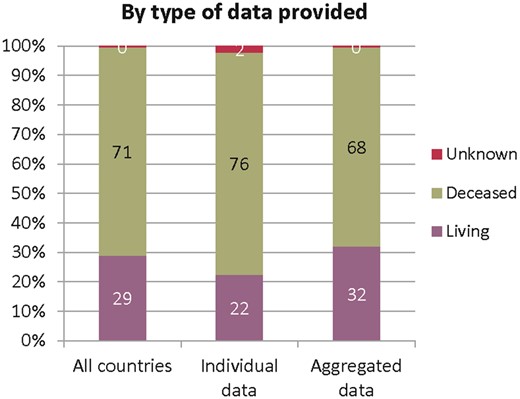
Donor-type distribution for kidney transplants performed in 2017, by type of data provided. See Appendix A1 for a list of countries and regions providing individual patient data or aggregated data.
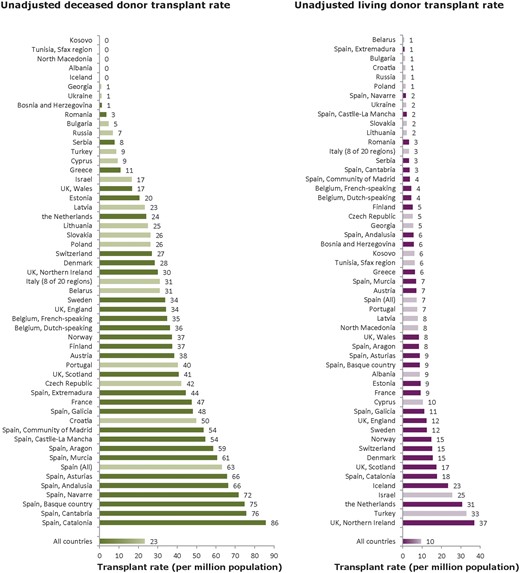
Deceased donor (left panel) and living donor (right panel) kidney transplants performed in 2017 pmp, by country/region, unadjusted. Registries providing individual patient data are shown as dark bars and registries providing aggregated data as light bars. The total count for Austria is based on residents and non-residents. For Romania and England (UK), the kidney transplant rate is underestimated by 30 and 7%, respectively. For Serbia, the transplant rate is underestimated by 16% for deceased donor transplants and by 12% for living donor transplants.
Survival of patients receiving RRT
For patients commencing RRT in the period 2008–12, the 5-year unadjusted patient survival probability for all RRT modalities combined was 50.8% [95% confidence interval (CI) 50.7–51.0]. For patients starting RRT with dialysis in this period, the unadjusted 5-year patient survival probability was 42.2% (95% CI 42.1–42.4). Adjusted analyses for patient survival on HD and PD revealed higher survival probabilities in the first 3 years for those receiving PD (Figure 13). For patients receiving a kidney transplant in the period 2008–12, living donor transplant recipients experienced a higher adjusted 5-year patient survival than recipients of deceased donor transplants [94.6% (95% CI 94.2–95.1) versus 92.1% (95% CI 91.8–92.4)], as well as a higher adjusted 5-year graft survival [86.7% (95% CI 86.0–87.4) versus 81.4% (95% CI 80.9–81.9)]. See Table 3 for a description of the adjustments made and the countries/regions included in these analyses.
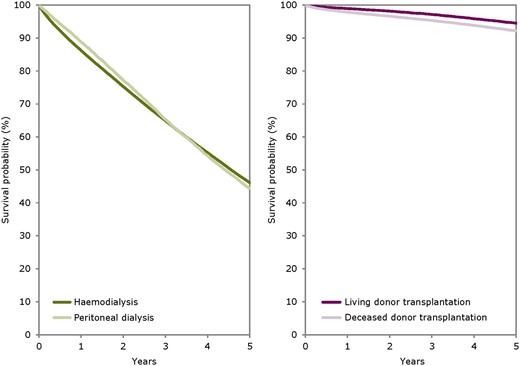
Survival of patients starting HD and PD between 2008 and 2012 from Day 91 (left panel) and patients receiving a first kidney transplant from a living or deceased donor between 2008 and 2012 (right panel). Survival on dialysis was censored for kidney transplantation and adjusted using fixed values for age (67 years), sex (63% men) and primary renal disease (24% DM, 19% hypertension/renal vascular disease, 11% glomerulonephritis and 46% other causes). Survival after kidney transplantation was adjusted using fixed values for age (50 years), sex (63% men) and primary renal disease (14% DM, 10% hypertension/renal vascular disease, 23% glomerulonephritis and 53% other causes). These figures are based on data from the following registries providing individual patient data: Austria, Belgium (Dutch-speaking), Belgium (French-speaking), Denmark, Finland, France, Greece, Iceland, Norway, Spain (Andalusia), Spain (Aragon), Spain (Asturias), Spain (Basque Country), Spain (Cantabria), Spain (Castile and León), Spain (Castile-La Mancha), Spain (Catalonia), Spain (Extremadura), Spain (Galicia), Spain (Community of Madrid), Sweden, The Netherlands, UK (England, Northern Ireland, Wales) and UK (Scotland).
The survival probabilities at 1, 2 and 5 years by treatment modality and cohort from Day 1 of the start of RRT/dialysis or from the day of kidney transplantation
| Survival type | Survival probabilities as a percentage (95% CI) | ||||
|---|---|---|---|---|---|
| Cohort: 2008–12 | Cohort: 2011–15 | ||||
| 1 year | 2 years | 5 years | 1 year | 2 years | |
| Patient survival on RRT | |||||
| Unadjusted | 83.9 (83.7–84.0) | 73.7 (73.6–73.9) | 50.8 (50.7–51.0) | 84.8 (84.6–84.9) | 74.8 (74.6–74.9) |
| Adjusteda | 86.6 (86.4–86.7) | 77.2 (77.0–77.4) | 52.4 (52.1–52.7) | 87.2 (87.1–87.4) | 78.0 (77.8–78.2) |
| Patient survival on dialysis | |||||
| Unadjusted | 82.8 (82.6–82.9) | 71.2 (71.0–71.4) | 42.2 (42.1–42.4) | 83.6 (83.5–83.8) | 72.1 (72.0–72.3) |
| Adjusteda | 84.9 (84.8–85.1) | 74.4 (74.2–74.6) | 45.7 (45.4–46.1) | 85.9 (85.8–86.1) | 75.6 (75.4–75.9) |
| Patient survival after first kidney transplantation (deceased donor) | |||||
| Unadjusted | 96.3 (96.1–96.5) | 94.3 (94.0–94.5) | 87.3 (87.0–87.6) | 96.3 (96.1–96.5) | 94.2 (94.0–94.5) |
| Adjustedb | 97.8 (97.7–98.0) | 96.6 (96.4–96.8) | 92.1 (91.8–92.4) | 98.0 (97.9–98.1) | 96.8 (96.7–97.0) |
| Graft survival after first kidney transplantation (deceased donor) | |||||
| Unadjusted | 91.2 (90.9–91.5) | 88.3 (88.0–88.6) | 78.6 (78.2–79.0) | 91.4 (91.1–91.7) | 88.3 (88.0–88.6) |
| Adjustedb | 92.6 (92.3–92.9) | 90.0 (89.7–90.4) | 81.4 (80.9–81.9) | 93.1 (92.9–93.4) | 90.6 (90.3–91.0) |
| Patient survival after first kidney transplantation (living donor) | |||||
| Unadjusted | 98.8 (98.6–99.0) | 97.9 (97.6–98.2) | 93.9 (93.5–94.4) | 99.0 (98.8–99.2) | 98.1 (97.8–98.3) |
| Adjustedb | 99.0 (98.8–99.2) | 98.2 (98.0–98.5) | 94.6 (94.2–95.1) | 99.2 (99.0–99.3) | 98.4 (98.1–98.6) |
| Graft survival after first kidney transplantation (living donor) | |||||
| Unadjusted | 96.3 (96.0–96.7) | 94.6 (94.2–95.0) | 87.5 (86.9–88.1) | 96.9 (96.5–97.2) | 95.1 (94.7–95.5) |
| Adjustedb | 96.1 (95.7–96.5) | 94.3 (93.8–94.8) | 86.7 (86.0–87.4) | 96.7 (96.3–97.0) | 94.9 (94.5–95.3) |
The findings are based on data from the following renal registries providing individual patient data: Austria, Belgium (Dutch-speaking), Belgium (French-speaking), Denmark, Finland, France, Greece, Iceland, Norway, Spain (Andalusia), Spain (Aragon), Spain (Asturias), Spain (Basque Country), Spain (Cantabria), Spain (Castile and León), Spain (Castile-La Mancha), Spain (Catalonia), Spain (Community of Madrid), Spain (Extremadura), Spain (Galicia), Sweden, The Netherlands, UK (England, Northern Ireland, Wales) and UK (Scotland).
Unadjusted survival probabilities were calculated using the Kaplan–Meier method and adjusted survival probabilities using the Cox regression model.
Analyses were adjusted using fixed values: age (67 years), sex (63% men) and primary renal disease (24% DM, 19% hypertension/renal vascular disease, 11% glomerulonephritis and 46% other causes).
Analyses were adjusted using fixed values: age (50 years), sex (63% men) and primary renal disease (14% DM, 10% hypertension/renal vascular disease, 23% glomerulonephritis and 53% other causes).
Expected remaining lifetime
There was a substantial difference in the expected remaining lifetime between patients receiving dialysis between 2013 and 2017 and the general population (Figure 14). Although patients living with a functioning kidney transplant have a longer life expectancy than those receiving dialysis, it is still lower than that of the age-matched general population. With the advancing age of kidney transplant recipients, the relative difference in the expected remaining lifetime compared with the age-matched general population increases, although the absolute difference decreases.
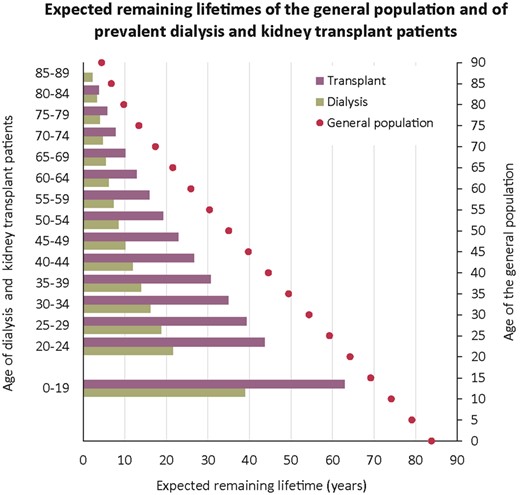
Expected remaining lifetimes of prevalent dialysis and kidney transplant patients (cohort 2013–17) and the general population (cohort 2013–17), by age. This figure is based on data from the following registries providing individual patient data: Austria, Belgium (Dutch-speaking), Belgium (French-speaking), Denmark, Finland, France, Greece, Iceland, Norway, Spain (Andalusia), Spain (Aragon), Spain (Asturias), Spain (Basque Country), Spain (Cantabria), Spain (Castile and León), Spain (Castile-La Mancha), Spain (Catalonia), Spain (Extremadura), Spain (Galicia), Spain (Community of Madrid), Sweden, The Netherlands and UK (all countries).
AFFILIATED REGISTRIES
Albanian Renal Registry: M. Barbullushi, A. Idrizi and E. Bolleku Likaj; Austrian Dialysis and Transplant Registry (OEDTR): R. Kramar; Belarus Renal Registry: K.S. Komissarov, K.S. Kamisarau and A.V. Kalachyk; Dutch-speaking Belgian Society of Nephrology (NBVN): M. Couttenye, F. Schroven and J. De Meester; French-speaking Belgian Society of Nephrology (GNFB): J.M. des Grottes and F. Collart; Renal Registry Bosnia and Herzegovina: H. Resić, B. Jakovljevic and M. Tomić; Bulgarian Renal Registry: E.S. Vazelov and I. Velinova; Croatian Registry of Renal Replacement Therapy (CRRRT): I. Bubić and M. Knotek; Cyprus Renal Registry: K. Ioannou and all of the renal units providing data; Czech Republic Registry of Dialysis Patients (RDP): I. Rychlík, J. Potucek and F. Lopot; Danish Nephrology Registry (DNS): J.G. Heaf; Estonian Society of Nephrology: Ü. Pechter, K. Lilienthal and M. Rosenberg; Finnish Registry for Kidney Diseases: P. Finne, J. Helve and P.H. Groop; France – Renal Epidemiology and Information Network (REIN): M. Lassalle and C. Couchoud; Georgian Renal Registry: N. Kantaria and Dialysis Nephrology and Transplantation Union of Georgia; Hellenic Renal Registry: G. Moustakas; Icelandic End-Stage Renal Disease Registry: R. Pálsson; Israel National Registry of Renal Replacement Therapy: R. Dichtiar, L. Keinan-Boker and E. Golan; Italian Registry of Dialysis and Transplantation (RIDT): A. Limido, M. Nordio and M. Postorino; Kosovo Renal Registry: H. Korca, S. Selmani and M. Tolaj-Avdiu; Latvian Renal Registry: H. Cernevskis, V. Kuzema and A. Popova; Lithuanian Renal Registry: V. Vainauskas, K. Petruliene and E. Žiginskiené; Macedonian Renal Registry: O. Stojceva-Taneva and N. Dimitriova; Norwegian Renal Registry: A.V. Reisæter and A. Åsberg; Polish Renal Registry: A. Dębska-Ślizień, R. Gellert and G. Korejwo; Portuguese Renal Registry: F. Macário and A. Ferreira; Romanian Renal Registry (RRR): G. Mircescu, L. Garneata and E. Podgoreanu; Russian Renal Registry: N. Tomilina, A. Andrusev and H. Zakharova; Renal Registry in Serbia: M. Lausevic, R. Naumovic, all of the Serbian renal units and the Serbian Society of Nephrology; Slovakian Renal Registry: V. Spustová, I. Lajdová and M. Karolyova; Spanish RRT National Registry at ONT, Spanish Regional Registries and Spanish Society of Nephrology (SEN); Swedish Renal Registry: M. Stendahl, H. Rydell, M. Evans, K.G. Prütz, T. Lundgren and M. Segelmark; Swiss Dialysis Registry: P. Ambühl and R. Winzeler; Dutch Renal Registry (RENINE): L. Heuveling, S. Vogelaar and M. Hemmelder; Tunisia, Sfax region: F. Jarraya and D. Zalila; Registry of the Nephrology, Dialysis and Transplantation in Turkey (TSNNR): G. Süleymanlar, N. Seyahi and K. Ateş; Ukrainian Renal Data System (URDS): M. Kolesnyk, S. Nikolaenko and O. Razvazhaieva; UK Renal Registry: all the staff of the UK Renal Registry and of the renal units submitting data; Scottish Renal Registry: all of the Scottish renal units); and the regional registries of Andalusia (SICATA): P. Castro de la Nuez (on behalf of all users of SICATA); Aragon: F. Arribas Monzón, J.M. Abad Diez and J.I. Sanchez Miret; Asturias: P. Beltrán, J.R. Quirós and RERCA Working Group; Basque Country (UNIPAR): Á. Magaz, J. Aranzabal, M. Rodrigo and I. Moina; Canary Islands: H. Sánchez Janáriz; Cantabria: J.C. Ruiz San Millán, O. Garcia Ruiz and C. Piñera Haces; Castile and León: M.A. Palencia García; Castile-La Mancha: G. Gutiérrez Ávila and I. Moreno Alía; Catalonia (RMRC): E. Arcos, J. Comas and J. Tort; Community of Madrid: M.I. Aparicio de Madre; Extremadura: all the renal units (Nephrology and Dialysis); Galicia: E. Bouzas-Caamaño; Renal Registry of the Region of Murcia: C. Santiuste de Pablos and I. Marín Sánchez; and Navarre: M.F. Slon Roblero, J. Manrique Escola and J. Arteaga Coloma.
ERA-EDTA REGISTRY COMMITTEE MEMBERS
C. Zoccali (Italy; ERA-EDTA President), Z.A. Massy (France, Chairman), P. Ambühl (Switzerland), M. Arici (Turkey), M. Evans (Sweden), P. Finne (Finland), J. Harambat (France), L. Mercadal (France), M. Nordio (Italy), S.S. Sørensen (Denmark) and E. Vidal (Italy).
ERA-EDTA REGISTRY OFFICE STAFF
K.J. Jager (Managing Director), M. Bonthuis (for the paediatric section), R. Boenink, J.R. Bosdriesz, R. Cornet, G. Guggenheim, A. Kramer, M. Noordzij, V.S. Stel and A.J. Weerstra.
ACKNOWLEDGEMENTS
The ERA-EDTA Registry would like to thank the patients and staff of all the dialysis and transplant units who have contributed data via their national and regional renal registries. In addition, we would like to thank the persons and organizations listed in the ‘Affiliated Registries’ section for their contribution to the work of the ERA-EDTA Registry.
FUNDING
The ERA-EDTA Registry is funded by the ERA-EDTA. This article was written by Kramer et al. on behalf of the ERA-EDTA Registry, which is an official body of the ERA-EDTA. In addition, M.F.S.R. reports personal fees from NxStage outside the submitted work and K.J.J. reports grants from the ERA-EDTA during the conduct of the study and a speaker fee from Fresenius Medical Care outside the submitted work.
CONFLICT OF INTEREST STATEMENT
None declared.
REFERENCES
ERA-EDTA Registry. ERA-EDTA Registry Annual Report
Appendix 1
Countries or regions providing individual patient data to the ERA-EDTA Registry: Austria; Dutch-speaking Belgium; French-speaking Belgium; Bosnia and Herzegovina; Denmark; Estonia; Finland; France; Greece; Iceland; Norway; Romania; Serbia; the Spanish regions of Andalusia, Aragon, Asturias, Basque Country, Canary Islands, Cantabria, Castile and León, Castile-La Mancha, Catalonia, Community of Madrid, Extremadura, Galicia, Murcia and Navarre; Sweden; Switzerland; The Netherlands; UK (England, Northern Ireland ,Wales and Scotland).
Countries or regions providing aggregated data to the ERA-EDTA Registry: Albania, Belarus, Bulgaria, Croatia, Cyprus, the Czech Republic, Georgia, Israel, Italy, Kosovo, Latvia, Lithuania, North Macedonia, Poland, Portugal, Russia, Slovakia, Spain, Sfax region (Tunisia), Turkey and Ukraine.
Countries not providing data to the ERA-EDTA Registry: Andorra, Armenia, Azerbaijan, Germany, Hungary, Ireland, Liechtenstein, Luxembourg, Malta, Moldova, Monaco, San Marino and Slovenia.
Appendix 2
Miscellaneous primary renal diseases: nephropathy (interstitial) due to analgesic drugs, nephropathy (interstitial) due to cis-platinum, nephropathy (interstitial) due to cyclosporin A, lead-induced nephropathy (interstitial), drug-induced nephropathy (interstitial) not mentioned above, cystic kidney disease–type unspecified, polycystic kidneys– infantile (recessive), medullary cystic disease, including nephronophthisis, cystic kidney disease – other specified type, hereditary/familial nephropathy – type unspecified, hereditary nephritis with nerve deafness (Alport’s syndrome), cystinosis, primary oxalosis, Fabry’s disease, hereditary nephropathy – other specified type, renal hypoplasia (congenital) – type unspecified, oligomeganephronic hypoplasia, congenital renal dysplasia with or without urinary tract malformation, syndrome of agenesis of abdominal muscles (prune belly), renal vascular disease due to polyarteritis, Wegener’s granulomatosis, ischemic renal disease/cholesterol embolism, glomerulonephritis related to liver cirrhosis, cryoglobulinemic glomerulonephritis, myelomatosis/light chain deposit disease, amyloid, lupus erythematosus, Henoch–Schönlein purpura, Goodpasture’s syndrome, systemic sclerosis (scleroderma), haemolytic–uraemic syndrome (including Moschcowitz syndrome), multisystem disease – other (not mentioned above), tubular necrosis (irreversible) or cortical necrosis, tuberculosis, gout, nephrocalcinosis and hypercalcemic nephropathy, Balkan nephropathy, kidney tumour, traumatic or surgical loss of kidney and other identified renal disorders.


Comments